Helicobacter pylori Adapts to Chronic Infection and Gastric Disease via pH-Responsive BabA-Mediated Adherence - PubMed (original) (raw)
. 2017 Mar 8;21(3):376-389.
doi: 10.1016/j.chom.2017.02.013.
Oscar Björnham 2, Yevgen A Chernov 1, Pär Gideonsson 1, Sara Henriksson 1, Melissa Mendez 1, Rolf Sjöström 1, Jafar Mahdavi 3, Anna Shevtsova 1, Dag Ilver 4, Kristof Moonens 5, Macarena P Quintana-Hayashi 4, Roman Moskalenko 6, Christopher Aisenbrey 7, Göran Bylund 1, Alexej Schmidt 1, Anna Åberg 1, Kristoffer Brännström 1, Verena Königer 8, Susanne Vikström 1, Lena Rakhimova 9, Anders Hofer 1, Johan Ögren 10, Hui Liu 11, Matthew D Goldman 12, Jeannette M Whitmire 13, Jörgen Ådén 7, Justine Younson 14, Charles G Kelly 14, Robert H Gilman 15, Abhijit Chowdhury 16, Asish K Mukhopadhyay 17, G Balakrish Nair 18, Konstantinos S Papadakos 19, Beatriz Martinez-Gonzalez 19, Dionyssios N Sgouras 19, Lars Engstrand 20, Magnus Unemo 21, Dan Danielsson 21, Sebastian Suerbaum 22, Stefan Oscarson 23, Ludmilla A Morozova-Roche 1, Anders Olofsson 1, Gerhard Gröbner 7, Jan Holgersson 24, Anders Esberg 10, Nicklas Strömberg 10, Maréne Landström 25, Angela M Eldridge 26, Brett A Chromy 26, Lori M Hansen 27, Jay V Solnick 28, Sara K Lindén 4, Rainer Haas 29, Andre Dubois 11, D Scott Merrell 13, Staffan Schedin 2, Han Remaut 5, Anna Arnqvist 1, Douglas E Berg 30, Thomas Borén 31
Affiliations
- PMID: 28279347
- PMCID: PMC5392239
- DOI: 10.1016/j.chom.2017.02.013
Helicobacter pylori Adapts to Chronic Infection and Gastric Disease via pH-Responsive BabA-Mediated Adherence
Jeanna A Bugaytsova et al. Cell Host Microbe. 2017.
Abstract
The BabA adhesin mediates high-affinity binding of Helicobacter pylori to the ABO blood group antigen-glycosylated gastric mucosa. Here we show that BabA is acid responsive-binding is reduced at low pH and restored by acid neutralization. Acid responsiveness differs among strains; often correlates with different intragastric regions and evolves during chronic infection and disease progression; and depends on pH sensor sequences in BabA and on pH reversible formation of high-affinity binding BabA multimers. We propose that BabA's extraordinary reversible acid responsiveness enables tight mucosal bacterial adherence while also allowing an effective escape from epithelial cells and mucus that are shed into the acidic bactericidal lumen and that bio-selection and changes in BabA binding properties through mutation and recombination with babA-related genes are selected by differences among individuals and by changes in gastric acidity over time. These processes generate diverse H. pylori subpopulations, in which BabA's adaptive evolution contributes to H. pylori persistence and overt gastric disease.
Keywords: Helicobacter pylori; acid responsiveness; adaptation; blood group antigen-binding adhesion; diversity; gastric acidity; gastric cancer; multimerization; polymorphism; subpopulations.
Copyright © 2017 Elsevier Inc. All rights reserved.
Figures
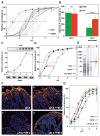
Figure 1. H. pylori Binding to Leb in Human Gastric Mucosa is Acid Sensitive, Responsive, Reversible, and Robust
(A) In vitro binding of fluorescent H. pylori 17875/Leb (binds only to Leb) at (a) pH 6, (b) pH 4, and (c) pH 2 (quantified in Figure S1A); (d) H/E-stained adjacent section. (B) H. pylori bacterial cells demonstrate pH dependence in binding to mucins (Lindén et al., 2004). Purified human gastric MUC5AC mucin was probed with gastric cancer (GC)-patient isolate (Y0 in Figure 6D) (means + SEM, n = 13 replicates). (C) 17875/Leb bacteria were mixed with 125I-Leb-conjugate (125I-Leb) at pH 6 then acidified to pH 2. The proportion of Leb that remained bound was scored (means ± SD for n = 2). (D) The 4 × 10¹¹ M−1 affinity (Ka) at pH 6 showed log-fold reductions at pH 4, 3.3, 2.8, and 2.1 (arrows), and these are shown with 95% confidence intervals (CI). (E) The acid sensitivity profile, here denoted pHgram (in black), was determined by a 1 h incubation with 125I-Leb at pH from 6 to 2. The dashed line shows when half of the Leb binding remained, i.e. 17875/Leb pH50 = 3.4. Reconditioning of bacterial cells to pH 5 after a 1 h exposure to acidic conditions and testing reactivation of Leb binding (in red) showed that the Leb glycan conjugate exhibited full acid stability at pH 2 (in green), which suggests that acid sensitivity involves the BabA protein itself. (F) 17875/Leb bacteria were tested for Leb binding after each pH-cycle (means ± SD, n = 2 replicates). (G and H) 17875/Leb bacterial binding in real time to recLeb-CHO cells (G and Figure S1G) or human BECs (H and Figure S1H) as measured by LigandTracer. The integrity of BECs (H) and recLeb-CHO cells (Figure S1G) was assessed at the end of the pH-cycle. Alexa488 was acid stabile (Figure S1E), and the restoration of Leb binding after neutralization resulted from pre-existing BabA protein, not de novo synthesis, because these experiments used previously frozen (dead) H. pylori.
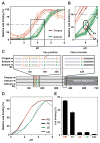
Figure 2. Diversity in Acid Sensitivity in Binding to Leb Among Clinical Isolates is Encoded by the Protein Sequence of BabA
(A) Leb binding is displayed by pHgram in relative terms to facilitate inter-strain comparison in acid sensitivity in binding (absolute Leb binding is shown in Figure S2A). Each individual pHgram and pH50 value is highly reproducible (Figure S2B). (B) Attachment at pH 6 and re-attachment after a full pH-cycle (Figure S2C, similar to Figure 1G) by strains SW7 (Alexa555, red) and SW38 (Alexa488, green) was significantly different as measured by Bonferroni post-hoc tests; means ± SD, n = 7 and n = 10 field views for SW7 and SW38, respectively. (C) 17875/Leb whole-cell proteins were separated by SDS-PAGE, transferred to a membrane, and strips were probed with Leb (Ilver et al., 1998) at pH 2–6 (Leb-binding is shown at the top and quantified in the middle, and the confirmation of full BabA membrane retention is shown at the bottom). (D) pHgrams of babA donor strain SW7, strain SW38, and the Trans38-7 transformant. SW7 and SW38 were chosen because of their divergence in pH50 (A) and sequence difference (44 amino acids (6%)) (Table S5; Figure S2F) but similar binding affinities (Aspholm-Hurtig at al., 2004). The Trans38-7’s ~25% reduction in gained acid resistance might come from its lower BabA expression, which was more similar to SW38 (Figure S2E). (E) Protein purification of BabA from H. pylori bacterial cells. SDS-PAGE of (a) whole bacterial cell protein extract (lane 1), ZW-12 detergent bacterial extract (lane 2), proteins eluted from the CEX column (lane 3), and BabA eluted from the Leb column (lane 4) (Figure S2G). (b) Silver staining and MALDI–MS (Figure S2H) shows BabA purified to homogeneity with high yield (Table S1). (F) Purified BabA was applied to gastric mucosa at pH 6 and then exposed to (a) pH 6, (b) pH 4, or (c) pH 2 followed by immunostaining (yellow) (quantified in Figure S2I); (d) BabA was acidified at pH 2, reconditioned at pH 6, then applied to gastric mucosa and immunostained. (G) pHgrams of Leb-ELISA of BabA protein purified from H. pylori strains SW7, 17875/Leb and SW38 with pH50 values of 3.3, 3.7, and 4.1, respectively (means ± SD for n = 2).
Figure 3. Gastric Antrum vs. Corpus Adaptation in Acid Sensitivity and Affinity in Binding is Encoded in BabA
(A) pHgrams of 30 isolates from patient SO-2 from Orebro University Hospital, Sweden. The most and least acid sensitive isolates displayed a full pH unit difference. (B) The Exceptional Antrum (AEx) and Corpus (CEx) isolates are circled. (C) Location of the SO-2 BabA substitutions: P199L in Key-position and E192K/G205D in the Exceptional (Ex) isolates are all in the proximity of the fucose-binding CL2 disulfide-clasped loop (yellow) that constitutes the basis for the CBD. The G428E substitution is located diametrically opposite the CBD where it is part of Velcro Domain and is situated at the very junction of the Repeat-Sequence-1, i.e. the C-terminal 200 amino acid segment including the membrane anchored domain (Figure 4B) that is conserved between BabA, BabB and BabC (Alm et al., 2000). (D) SPR-derived pHgram analyses of Leb-binding by E. coli recBabA526 protein from SO-2 corpus (P199/G428 (PG)), antrum (L199/E428 (LE)) and chimeric variants L199/G428 (LG) and P199/E428 (PE) (sensograms in Figure S3C). (E) Leb binding by E. coli bacterial cells that express full-length recBabA720 from SO-2 corpus (PG), antrum (LE), and chimeric variants LG and PE was assessed by RIA. E. coli with no expression of recBabA was used as the control (Ctrl) (means + SD for n = 2).
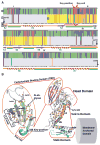
Figure 4. Amino Acid Replacements for Adaptation in Acid Sensitivity in Leb-Binding
(A) The BabA CBD is under both positive and adaptive selection. Here, the BabA aa133–399 segment is shown with the Key-position and Key-coil (red vertical box) indicated in close proximity to the fucose-binding CL2 disulfide-clasped loop (red bracket). (a) The colored bars represent amino acid residues under positive selection, i.e. single nucleotide mutations that result in high level (red) or moderate level (blue) of amino acid substitutions or conservation (green) of amino acids (Aspholm-Hurtig et al., 2004). The high-level positive selection clusters are indicated as I–IV. (b) The pH50-dependent substitutions co-localize the strongest with Cluster II (CBD, aa175–255 (yellow)), but not with Cluster IV. (c) The series of pH50 substitutions in Greek strains (purple bars (Figure S4D)), SO-2 isolates (light-blue bars (Figure S3B)), and the GC-patient isolates (orange bars (Figure 6E)) are located in Clusters I–III. (d) The reference sequence is P448 BabA, and stars indicate positions missing in this strain’s BabA sequence (Aspholm-Hurtig et al., 2004). (e) Intrinsically unstructured regions (IUR) (green bars) were predicted by DisEMBL and GlobPlot. In BabA, the IUR segments join β-strands (lilac arrows) and α-helices (ribbons) and exhibit higher prevalence of polar amino acids and prolines for rapid and precise responses to changes in the local environment (Dyson and Wright, 2005; Rauscher et al., 2006). (B) Structural organization of the CBD and Velcro Domain acid-sensitivity determinants. The CBD is carried by the Head Domain. The coiled-coil Stalk Domain connects the Head Domain with the predicted Membrane-Anchored Domain (Hage et al., 2015; Moonens et al., 2016). The four β-strands S3–S6 with IUR loops constitute the CBD along with the disulfide (C189/C197)-clasped (in magenta) fucose-binding loop CL2, which is immediately followed by the Key-coil (aa198–202) and Key-position (aa199) in most BabAs. D198 in the Key-coil forms a salt bridge with R207 that acts as a structural clamp (dashed red arrow). The salt bridge acts as a pH sensor and breaks open due to protonation of the aspartic acid at pH <4. H9 in the Head Domain and H1/10 in the Stalk Domain together comprise the Velcro Domain. The K192/D205 Exceptional (Ex) motif (red stars) seems to constitute an additional mechanism for increased acid sensitivity in binding.
Figure 5. Acid Inactivation of Leb Binding Depends on the pH Response-Sensor in the Key-Coil
(A) pHgrams of 17 Asian Indian and 20 Peruvian strains with acid-resistant Indian I18 shown in red and more acid-sensitive Indian I9 shown in green. (B) BabA sequences from 17875/Leb, the Asian-Indian strains (I), and strains from Japan (J) and Spain (S) with/without Key-coil positions 199 and 200 ranked according to their pH50. A red vertical box indicates the Key-coil. The acid-resistant strain I18 (horizontal red box) and acid-sensitive strain I9 (horizontal green box) are indicated. The three green arrows show strains that carry the K192/D205 Exceptional (Ex) motif for increased acid sensitivity in binding (similar to Ex motif in Figure 3C). (C) The prevalence of P in the Key-position is ~25% in Europe, ~50% among North American Amerindians (Alaska), and ~90% among South American Amerindians (Peru) (Table S2). The red vertical box illustrates the missing Key-position in most Indian strains. (D) The three I9-SV BabA mutants (M) with 3, 8, or 11 amino acids from the Key-coil region of strain I18. (E) pHgrams show that BabA I9 with the S198–S208 (11 aa) segment, expressed in H. pylori strain P1Δ_babA,_ gave strain M3 a 60% increase in acid resistance (arrow) compared to the original I9 strain (pH50 4.17). M3 pH50 = 3.56 (blue), whereas the M1 and M2 mutants (orange) showed contrasting increased acid sensitivity (pH50 = 4.46) (means ± SD for n = 5 (M1), n = 6 (M2 and M3), or n = 3 (I9 and I18) individual clones). (F) Recombinant expression of BabA I18-SV and I18-SV- KQ in H. pylori strain P1Δ_babA_, demonstrated increased acid sensitivity from pH50 3.3 to 3.9 (means ± SD for n = 4) due to deletion of the two residues 199K and 200Q. (G) Recombinant expression of BabA I9-SV and I9-SV-D198A in H. pylori strain P1Δ_babA_ demonstrated increased acid sensitivity from pH50 = 4.1 to 4.9 (means ± SD for n = 4) due to inactivation of the salt bridge’s D-node by the D198A substitution. (H) Bond strengths for twelve combinations of acidity and loading rate. These are the effective loading rates for the binding when the influence of the elasticity of the bacterium body has been compensated for (Bell, 1978). (I) The off-rate was assessed by a linear fit of the measured bond strength versus the logarithm of the loading rate (from H), where the off-rate is calculated from the slope of this line (Björnham et al., 2009). The measured increase in off-rate (dissociation) is comparable to the decrease in bacterial binding affinity at pH 3.6 (Figure 1D). The results are based on >4000 single measurements.
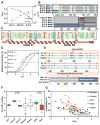
Figure 6. BabA Adaptation in Acid Sensitivity During Severe Disease Progression
(A) The 81G antrum and 81G corpus clones had pH50 values of 3.9 and 4.25 and Ka values of 6.8 × 10¹⁰ M−1 and 5.6 × 10¹¹ M−1, respectively, compared to 4.15 and 2.9 × 10¹¹ M−1 for the USU101 parent strain. (B) Amino acid replacements in BabA due to babA/babB recombinations. The 81G corpus and antrum BabAs had six and three amino acid substitutions, respectively, compared to USU101 (Figure S6G). (C) UniProt alignment of 98 BabA Velcro Domain sequences with the seven 81G substitutions indicated. (D) pHgrams of H. pylori isolated from the GC-patient at Year (Y)0, Y3, Y16-1, Y16-2, and Y16-3 (means ± SD, n = 2). (E) BabA alignment of the Y0/Y3 (identical) isolates, the Y16-1 isolate, and the more acid-sensitive Y16-2/3 (identical) isolates, where all but one substitution (aa343) are located in the CBD (in red, blue, and green, respectively, see panel D). (F) Box plots of pH50 for 26 SO-1 (non-reflux dyspepsia) isolates, 20 SO-2 (gastric reflux) antrum (A) and 10 SO-2 corpus (C) isolates (Figure 3A), and 21 Swedish (Figure 2A), 30 Greek (Figure S4B), 17 Indian, and 20 Peruvian (Figure 5A) strains with values outside the box shown as individual points. Mann–Whitney U-tests show significant differences (** p < 0.01; *** p < 0.001). (G) Tests of strains from Sweden (n = 21,) Peru (n = 20), India (n = 17), Greece (n = 30), and Japan (n = 22) showed that acid sensitivity (pH50) correlates with Leb-binding capacity for the combined set (rs = −0.68, n = 110, p < 0.0001), see also Figure S7F.
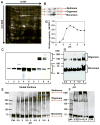
Figure 7. BabA Multimerization and Reversible Acid Dissociation
(A) H. pylori J166 whole-protein extracts analyzed by 2D-DIGE. The two green bands (white arrows) that were missing or significantly reduced after 8 weeks of infection in a rhesus macaque (presumable BabA oligomers and multimers) were, together with the dominant yellow band that corresponds to the BabA monomer, positive for BabA by immunoblot (B) (see also differential fluorescence in Figure S7A). (B) BabA immunoblot of J166 wild-type whole-protein extract separated by 2D-DIGE revealed three groups of bands – BabA monomer, oligomers, and HMM (double-band) multimers (arrows). (C) Non-reducing SDS-PAGE of CEX fractions from BabA purification (Figure S2Ga). BabA eluted as a monomer followed by HMM oligomers and possible multimers. (D) Non-reducing SDS-PAGE of ZW-12 detergent extracts of 17875/Leb bacterial cells in a pH range from 3.5 to 6. Acidification of the bacterial extract caused dissociation of BabA oligomers and multimers into monomers. (E) Glutaraldehyde crosslinking of 17875/Leb bacterial cells after exposure to pH 2.5–6. Digital integration of the BabA fluoro-Infra-Red (IR)-signal is shown in Figure S7D. (F) Glutaraldehyde crosslinking of 17875/Leb bacterial cells after exposure to pH 2.5 with BabA dissociation into monomers (pH 2.5); reconstitution of BabA into multimers by pH 6 reconditioning after prior pH 2.5 acidification (pH 2.5→6); and pH 6 exposure for visualization of the predominant multimers (pH 6). Digital integration of the BabA IR-signal is shown in Figure S7E. (G) Correlation between acid dependence (pH50) and maximal Leb-binding capacity (as an approximation of active and available BabA adhesin protein) for 17875/Leb bacterial cells was estimated by equilibrium-in-binding affinity analysis.
Comment in
- A Sour Relationship between BabA and Lewis b.
Hatakeyama M. Hatakeyama M. Cell Host Microbe. 2017 Mar 8;21(3):318-320. doi: 10.1016/j.chom.2017.02.014. Cell Host Microbe. 2017. PMID: 28279343 - Bacterial physiology: When things turn sour for Helicobacter.
Du Toit A. Du Toit A. Nat Rev Microbiol. 2017 May;15(5):256-257. doi: 10.1038/nrmicro.2017.32. Epub 2017 Mar 27. Nat Rev Microbiol. 2017. PMID: 28344352 No abstract available.
Similar articles
- Dynamics of Lewis b binding and sequence variation of the babA adhesin gene during chronic Helicobacter pylori infection in humans.
Nell S, Kennemann L, Schwarz S, Josenhans C, Suerbaum S. Nell S, et al. mBio. 2014 Dec 16;5(6):e02281-14. doi: 10.1128/mBio.02281-14. mBio. 2014. PMID: 25516619 Free PMC article. - BabA-mediated adherence of pediatric ulcerogenic H. pylori strains to gastric mucins at neutral and acidic pH.
Quintana-Hayashi MP, Rocha R, Padra M, Thorell A, Jin C, Karlsson NG, Roxo-Rosa M, Oleastro M, Lindén SK. Quintana-Hayashi MP, et al. Virulence. 2018;9(1):1699-1717. doi: 10.1080/21505594.2018.1532243. Virulence. 2018. PMID: 30298790 Free PMC article. - Fut2-null mice display an altered glycosylation profile and impaired BabA-mediated Helicobacter pylori adhesion to gastric mucosa.
Magalhães A, Gomes J, Ismail MN, Haslam SM, Mendes N, Osório H, David L, Le Pendu J, Haas R, Dell A, Borén T, Reis CA. Magalhães A, et al. Glycobiology. 2009 Dec;19(12):1525-36. doi: 10.1093/glycob/cwp131. Epub 2009 Aug 25. Glycobiology. 2009. PMID: 19706747 Free PMC article. - Helicobacter pylori BabA in adaptation for gastric colonization.
Ansari S, Yamaoka Y. Ansari S, et al. World J Gastroenterol. 2017 Jun 21;23(23):4158-4169. doi: 10.3748/wjg.v23.i23.4158. World J Gastroenterol. 2017. PMID: 28694656 Free PMC article. Review. - Helicobacter pylori adhesion to gastric epithelial cells is mediated by glycan receptors.
Magalhães A, Reis CA. Magalhães A, et al. Braz J Med Biol Res. 2010 Jul;43(7):611-8. doi: 10.1590/s0100-879x2010007500049. Epub 2010 Jun 7. Braz J Med Biol Res. 2010. PMID: 20521012 Review.
Cited by
- Multi-omics and temporal dynamics profiling reveal disruption of central metabolism in Helicobacter pylori on bismuth treatment.
Han B, Zhang Z, Xie Y, Hu X, Wang H, Xia W, Wang Y, Li H, Wang Y, Sun H. Han B, et al. Chem Sci. 2018 Jul 25;9(38):7488-7497. doi: 10.1039/c8sc01668b. eCollection 2018 Oct 14. Chem Sci. 2018. PMID: 30510674 Free PMC article. - Bacterial physiology: When things turn sour for Helicobacter.
Du Toit A. Du Toit A. Nat Rev Microbiol. 2017 May;15(5):256-257. doi: 10.1038/nrmicro.2017.32. Epub 2017 Mar 27. Nat Rev Microbiol. 2017. PMID: 28344352 No abstract available. - Helicobacter pylori Outer Membrane Proteins and Virulence Factors: Potential Targets for Novel Therapies and Vaccines.
Sedarat Z, Taylor-Robinson AW. Sedarat Z, et al. Pathogens. 2024 May 8;13(5):392. doi: 10.3390/pathogens13050392. Pathogens. 2024. PMID: 38787244 Free PMC article. Review. - Aeromonas salmonicida binds α2-6 linked sialic acid, which is absent among the glycosphingolipid repertoires from skin, gill, stomach, pyloric caecum, and intestine.
Benktander J, Sundh H, Sharba S, Teneberg S, Lindén SK. Benktander J, et al. Virulence. 2022 Dec;13(1):1741-1751. doi: 10.1080/21505594.2022.2132056. Virulence. 2022. PMID: 36205522 Free PMC article. - Changes in the tissue elements of the gastric mucosa interacting with different strains of Helicobacter pylori, taking into consideration the patient's genotype.
Molodozhnikova N, Berestova A, Berechikidze I, Shorina D, Morugina O. Molodozhnikova N, et al. Biosci Microbiota Food Health. 2024;43(3):213-221. doi: 10.12938/bmfh.2023-070. Epub 2024 Mar 19. Biosci Microbiota Food Health. 2024. PMID: 38966050 Free PMC article.
References
- Aspholm-Hurtig M, Dailide G, Lahmann M, Kalia A, Ilver D, Roche N, Vikström S, Sjöström R, Lindén S, Bäckström A, et al. Functional adaptation of BabA, the H. pylori ABO blood group antigen binding adhesin. Science. 2004;305:519–522. - PubMed
- Bell MG. Models for the specific adhesion of cells to cells. Science. 1978;200:618–627. - PubMed
- Björnham O, Fällman E, Axner O, Ohlsson J, Nilsson UJ, Borén T, Schedin S. Measurements of the binding force between the Helicobacter pylori adhesin BabA and the Lewis b blood group antigen using optical tweezers. J Biomed Opt. 2005;10:44024-1–9. - PubMed
- Björnham O, Bugaytsova J, Borén T, Schedin S. Dynamic force spectroscopy of the Helicobacter pylori BabA-Lewis b binding. Biophys Chem. 2009;143:102–105. - PubMed
MeSH terms
Substances
Grants and funding
- R01 AI070803/AI/NIAID NIH HHS/United States
- P51 OD011107/OD/NIH HHS/United States
- R01 DK063041/DK/NIDDK NIH HHS/United States
- R01 CA082312/CA/NCI NIH HHS/United States
- R01 AI081037/AI/NIAID NIH HHS/United States
LinkOut - more resources
Full Text Sources
Other Literature Sources
Medical

