Exhaustion-associated regulatory regions in CD8+ tumor-infiltrating T cells - PubMed (original) (raw)
Exhaustion-associated regulatory regions in CD8+ tumor-infiltrating T cells
Giuliana P Mognol et al. Proc Natl Acad Sci U S A. 2017.
Abstract
T-cell exhaustion is a progressive loss of effector function and memory potential due to persistent antigen exposure, which occurs in chronic viral infections and cancer. Here we investigate the relation between gene expression and chromatin accessibility in CD8+ tumor-infiltrating lymphocytes (TILs) that recognize a model tumor antigen and have features of both activation and functional exhaustion. By filtering out accessible regions observed in bystander, nonexhausted TILs and in acutely restimulated CD8+ T cells, we define a pattern of chromatin accessibility specific for T-cell exhaustion, characterized by enrichment for consensus binding motifs for Nr4a and NFAT transcription factors. Anti-PD-L1 treatment of tumor-bearing mice results in cessation of tumor growth and partial rescue of cytokine production by the dysfunctional TILs, with only limited changes in gene expression and chromatin accessibility. Our studies provide a valuable resource for the molecular understanding of T-cell exhaustion in cancer and other inflammatory settings.
Keywords: ATAC-seq; T-cell exhaustion; anti–PD-L1; checkpoint blockade therapy; chromatin accessibility.
Conflict of interest statement
The authors declare no conflict of interest.
Figures
Fig. 1.
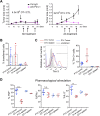
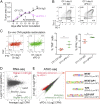
Tumor-specific CTLs become phenotypically and functionally exhausted, whereas tumor-ignorant bystander CTLs do not. (A, Upper) Flowchart of experiment: in vitro-generated OT-I and P14 CTLs were adoptively transferred into mice bearing subcutaneous B16-OVA tumors. (A, Lower) Flow cytometry plot showing the fraction of OT-I (CD45.1+) and P14 (Th1.1+) cells in the total CD8+ T-cell gate, in the tumor or spleen of a representative mouse, 8 days after in vivo transfer. (B and C, Upper), Expression of inhibitory receptors (PD-1 and LAG-3) and activation molecules (CD69 and 4-1BB) on tumor-infiltrating OT-I and P14 CD8+ T cells and on OT-I cells isolated from the spleen of a representative mouse. (B and C, Lower) Quantification (geometric mean of fluorescence intensity ± SD) of the expression levels of the cell-surface proteins indicated above each graph. Each dot represents one mouse. (D and E) Intracellular staining for the cytokines TNF, IFNγ, and IL-2, upon restimulation of OT-I and P14 cells isolated from the tumor (D) or spleen (E) with their cognate peptides. Data are from one representative experiment out of three. (F) Summary of cytokine production by P14 and OT-I cells infiltrating tumor or spleen upon restimulation with cognate peptides. Horizontal bars show averaged values ± SD (***P < 0.01, unpaired t test). Representative of three independent experiments. Each dot represents one mouse.
Fig. S1.
Growth curves of B16-OVA tumors and phenotype of TILs. (A) Growth profile of B16-OVA tumors inoculated intradermally into C57BL/6 recipient mice. On days 12–13 after tumor inoculation, the indicated numbers of OT-I CTLs were adoptively transferred i.v. into tumor-bearing mice. Mice were treated with anti–PD-L1 or control IgG as indicated. The graphs show tumor progression upon transfer of 4.5 × 10⁶ (Left) or 2 × 10⁶ (Right) OT-I cells; n = 4 mice per group; average ±SE are shown; each experimental condition was tested once as part of the initial setup. (B) Percentages of OT-I and P14 TILs 8 days after in vivo transfer, measured after gating on total CD8+ TILs. Each dot represents a mouse; bars represent averages and SE; experiment is representative of three independent experiments. (C) Expression of Tim-3 in OT-I and P14 TILs, 8 days after transfer or in spleen-infiltrating OT-I cells (Left). One representative mouse out of four is shown. Gate indicates percentage of Tim-3+ cells. Average percentage of Tim-3+ cells (±SD) is shown on the Right, representative of at least three experiments. (D) Summary of cytokine production by P14 and OT-I cells infiltrating tumor or spleen, as indicated. Percentages of cells producing TNF, IFNγ, or IL-2 after ex vivo restimulation with PMA + thapsigargin are shown. Horizontal bars show averaged values ±SD (***P < 0.01, unpaired t test), representative of three independent experiments.
Fig. S2.
Phenotypic and functional analysis of OT-I and P14 TILs on day 3 after in vivo transfer. (A) PD-1 and LAG-3 expression in OT-I and P14 T cells isolated from B16-OVA tumors 3 days after in vivo T-cell transfer, as well as in splenic OT-I cells. (Upper) Expression of the indicated cell-surface proteins in a representative mouse out of four or five. (Lower) Quantification across different mice, including analysis of P14 cells from spleens of recipient mice (mean ± SD). Each dot indicates a mouse, representative of two independent experiments. (B, Upper) Expression of Tim-3 versus PD-1 in tumor-infiltrating and splenic P14 and OT-I cells 3 days after in vivo transfer in one representative mouse out of four or five. (Lower) Quantification of Tim-3 levels across different mice. (C) Intracellular staining for TNF, IFNγ, and IL-2 production by tumor-infiltrating and splenic OT-I and P14 cells, isolated 3 days after in vivo transfer, upon restimulation with cognate peptide ex vivo. Each dot represents a mouse, horizontal bars show averaged values (n.s., not significant; **P < 0.05; ***P < 0.01, unpaired t test). A single experiment, representative of two independent experiments, is shown.
Fig. 2.
Transcriptional profiles of OT-I and P14 TILs and comparison with other exhaustion models. (A) MA plot showing the log2-fold change of mRNA transcript levels and average counts per million (CPM) between OT-I and P14 TILs, isolated from B16-OVA tumors 8 days after in vivo transfer (averaged from three to five biological replicates). Each dot represents an expressed gene. Red and blue dots indicate genes significantly up-regulated [abs(log2 FC) ≥ 1 and FDR ≤ 0.05] in OT-I or P14 TILs, respectively. (B) Heat maps of expression of representative genes up-regulated in OT-I versus P14 TILs, showing individual replicates. (C) Venn diagrams showing the overlap between genes up-regulated in day 8 OT-I versus P14 TILs (red) and genes up-regulated (green) or down-regulated (yellow) in exhausted versus effector CTLs isolated from mice 15 days after LCMV infection (37). The percentage of genes up-regulated in OT-I TILs that are also differentially expressed in the indicated comparison is shown in red. The statistical significance of intersections is from Fisher’s exact tests (n.s. if P > 0.05). (D) Venn diagrams showing the overlap between genes up-regulated in OT-I TILs (red) and genes up-regulated (green) or down-regulated (yellow) in CA-RIT-NFAT1–transduced CTLs versus mock-transduced CTLs (38). (E) Heatmap of log2-fold changes of genes shown in B, in OT-I versus P14 TILs; in exhausted versus effector CTLs from mice infected with LCMV (37); or in CA-RIT-NFAT1–transduced CTLs versus control cells (38).
Fig. 3.
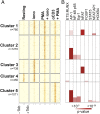
Analysis of the chromatin accessibility landscape in acutely restimulated CTLs. (A) Heat map of ATAC-seq signal (averaged from two to three biological replicates) at ∼4,300 genomic regions whose accessibility was significantly altered in CTLs primed for 6 days and restimulated for 2 h with ionomycin (iono), anti-CD3 + PMA, PMA + iono, or left unstimulated (resting). Unsupervised clustering was used to identify patterns of chromatin accessibility across samples. (B, Top) Transcription factor-binding motifs associated with each cluster, color coded by enrichment P value. For significant motif enrichment (P value ≤10–5), the percentage of regions in the cluster with at least one motif occurrence is proportional to the colored area in each box. Therefore, the plot can be interpreted as for column charts.
Fig. S3.
Genome browser snapshots of ATAC-seq signal at representative regions modulated by acute restimulation in CTLs. Accessible regions at the representative genomic loci (A) Pdcd1 and (B) Il2 in acutely restimulated CTLs, as clustered in Fig. 3_A_. Peaks are highlighted by brown boxes, and cluster numbers are shown below in red. NFAT ChIP-seq signal in CTLs restimulated with PMA + ionomycin is from published datasets (38). The ATAC-seq signal is averaged from two to three biological replicates.
Fig. 4.
Analysis of chromatin accessibility in OT-I and P14 TILs. (A) ATAC-seq signal (averaged from two biological replicates) in OT-I and P14 TILs, isolated 8 days after transfer. Each dot represents an ATAC-seq peak. The number of regions similarly accessible in both samples (dark gray), more accessible in OT-I than in P14 cells (red), and more accessible in P14 than in OT-I cells (blue) are indicated. (B) Pie chart showing the classification of ATAC-seq peaks from A compared with the mouse genome (mm10). (C) Log2-fold enrichment of the genomic classes shown in B relative to the whole genome. (D) Genome browser snapshots showing the ATAC-seq signal at two representative loci (Lag3 and Irf8). Regions more accessible in day 8 OT-I than P14 TILs are highlighted by orange boxes. (E) Correlation between ATAC-seq and RNA-seq data. Genes were associated with regions selectively accessible in day 8 OT-I (red) or P14 (blue) TILs by proximity to the TSS (proximal: −5 kb to +1 kb; distal: ±50 kb, with the exclusion of the proximal window). The distributions of log2-fold expression changes (as measured by RNA-seq) of the associated genes are shown in box plots and compared with a Mann–Whitney U test. (F) Transcription factor motifs associated with ATAC-seq regions more accessible in OT-I (red) or P14 (blue) TILs. The enrichment is relative to all accessible (both differential and nondifferential) regions of OT-I or P14 TILs, respectively. Only significant enrichment scores (P value ≤10–5) are shown.
Fig. S4.
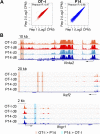
Genome ATAC-seq in OT-I versus P14 TILs. (A) ATAC-seq signal from individual biological replicates in OT-I and P14 TILs. Dots represent the 20,088 regions shown in Fig. 4_A_. (B) Representative regions more accessible in OT-I than P14 day 8 TILs at the Nr4a2 and Ikzf2 loci (orange) or in P14 than OT-I day 8 TILs at the Ifngr1 locus (light blue). The ATAC-seq signal is averaged from two biological replicates.
Fig. 5.
Identification of accessible regions associated with exhaustion or activation in OT-I TILs. (A) Heat maps of ATAC-seq signal (averaged from two to three biological replicates) at regions more accessible in day 8 OT-I than P14 TILs and either more accessible (Top, exhaustion related) or similarly accessible (Bottom, activation related) in OT-I TILs versus CTLs acutely restimulated in vitro. (B) Transcription factor motifs associated with exhaustion- (purple) or activation-related (green) ATAC-seq regions. Only significant enrichment scores (P value ≤10–5) are shown. (C) Genome browser snapshot of ATAC-seq signal at the Pdcd1 locus, showing representative regions associated with exhaustion (purple) or activation (green) phenotypes. ATAC-seq tracks are shown for OT-I and P14 TILs 8 days after in vivo transfer, in vitro-generated CTL, resting and restimulated as indicated, and CTL transduced with CA-RIT-NFAT1 or a DNA-binding mutated NFAT (DBDmut) (28). The bottom track shows the NFAT ChIP-seq signal in CTLs restimulated in vitro with PMA + iono, taken from published datasets (38). The star highlights the exhaustion-associated Pdcd1 enhancer (−22.4 kb). (D) Overlap between exhaustion-associated open chromatin regions from OT-I TILs and from LCMV chronic infection in Scott-Browne et al. (28). Statistical significance is computed using the Fisher’s exact test.
Fig. S5.
Genome browser snapshots of ATAC-seq signal at representative exhaustion- or activation-associated regions. (A) ATAC-seq signal (averaged from two to three biological replicates) at representative genomic loci (Top, Lag3; Bottom, Ifng) highlighting accessible regions identified as either exhaustion- (purple) or activation-associated (green). NFAT ChIP-seq signal in CTLs restimulated with PMA + iono is from published datasets (38). (B) Sequence of the exhaustion-associated open-chromatin region in the Pdcd1 locus marked by a star in Fig. 5_C_, with manually curated Nur77 and NFAT motif occurrences. (C) Representative genes, categorized by function or localization, found within 200 kb from the exhaustion- or activation-related genomic regions identified in Fig. 5_A_.
Fig. 6.
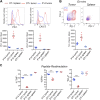
Effects of anti–PD-L1 treatment on phenotype and chromatin accessibility of OT-I TILs. Mice bearing s.c. B16-OVA tumors adoptively transferred with 2 × 10⁶ OT-I CTLs on day 12 received two injections of anti–PD-L1 or control IgG as indicated (day 15 and day 18); n = 4–5 mice per group. (A) Tumor growth curves with average ± SEM. (B) Expression of PD-1 and Tim-3 on OT-I TILs 8 days after in vivo transfer; each plot corresponds to a pool of two to four mice. (C, Left) TNF and IFNγ intracellular staining of OT-I TILs from mice treated with control IgG or anti–PD-L1, after restimulation with OVA peptide. (C, Right) Quantification of TNF and IFNγ production; each dot represents a mouse; mean ± SD is shown (*P value <0.05, unpaired t test). (D) MA plot of gene expression changes in OT-I TILs isolated from mice treated with anti–PD-L1 versus Ctrl IgG (n = 2–3). Each dot represents a gene. Dots highlighted in color are significantly different [abs(log2 FC) ≥ 1 and FDR ≤ 0.1] between the two groups. (E, Left) Scatterplot showing the averaged ATAC-seq signal in OT-I TILs 8 days after transfer from mice treated with anti–PD-L1 or control IgG (n = 2–4). Each dot represents a peak. Regions more accessible in anti–PD-L1 than control or vice versa using a relaxed metric (fold changes exceeding 2 SDs from the mean) are highlighted in green and red, respectively. (E, Right) Transcription factor-binding motifs significantly enriched in regions dampened by anti–PD-L1 treatment. Enrichment scores (ES) and P values are shown.
Similar articles
- NR4A transcription factors limit CAR T cell function in solid tumours.
Chen J, López-Moyado IF, Seo H, Lio CJ, Hempleman LJ, Sekiya T, Yoshimura A, Scott-Browne JP, Rao A. Chen J, et al. Nature. 2019 Mar;567(7749):530-534. doi: 10.1038/s41586-019-0985-x. Epub 2019 Feb 27. Nature. 2019. PMID: 30814732 Free PMC article. - TOX and TOX2 transcription factors cooperate with NR4A transcription factors to impose CD8+ T cell exhaustion.
Seo H, Chen J, González-Avalos E, Samaniego-Castruita D, Das A, Wang YH, López-Moyado IF, Georges RO, Zhang W, Onodera A, Wu CJ, Lu LF, Hogan PG, Bhandoola A, Rao A. Seo H, et al. Proc Natl Acad Sci U S A. 2019 Jun 18;116(25):12410-12415. doi: 10.1073/pnas.1905675116. Epub 2019 May 31. Proc Natl Acad Sci U S A. 2019. PMID: 31152140 Free PMC article. - Checkpoint Blockade Immunotherapy Induces Dynamic Changes in PD-1-CD8+ Tumor-Infiltrating T Cells.
Kurtulus S, Madi A, Escobar G, Klapholz M, Nyman J, Christian E, Pawlak M, Dionne D, Xia J, Rozenblatt-Rosen O, Kuchroo VK, Regev A, Anderson AC. Kurtulus S, et al. Immunity. 2019 Jan 15;50(1):181-194.e6. doi: 10.1016/j.immuni.2018.11.014. Epub 2019 Jan 8. Immunity. 2019. PMID: 30635236 Free PMC article. - Effector, Memory, and Dysfunctional CD8(+) T Cell Fates in the Antitumor Immune Response.
Reiser J, Banerjee A. Reiser J, et al. J Immunol Res. 2016;2016:8941260. doi: 10.1155/2016/8941260. Epub 2016 May 22. J Immunol Res. 2016. PMID: 27314056 Free PMC article. Review. - CD8+ T-cell exhaustion in cancer: mechanisms and new area for cancer immunotherapy.
He QF, Xu Y, Li J, Huang ZM, Li XH, Wang X. He QF, et al. Brief Funct Genomics. 2019 Mar 22;18(2):99-106. doi: 10.1093/bfgp/ely006. Brief Funct Genomics. 2019. PMID: 29554204 Review.
Cited by
- TCA metabolism regulates DNA hypermethylation in LPS and _Mycobacterium tuberculosis_-induced immune tolerance.
Abhimanyu, Longlax SC, Nishiguchi T, Ladki M, Sheikh D, Martinez AL, Mace EM, Grimm SL, Caldwell T, Portillo Varela A, Sekhar RV, Mandalakas AM, Mlotshwa M, Ginidza S, Cirillo JD, Wallis RS, Netea MG, van Crevel R, Coarfa C, DiNardo AR. Abhimanyu, et al. Proc Natl Acad Sci U S A. 2024 Oct 8;121(41):e2404841121. doi: 10.1073/pnas.2404841121. Epub 2024 Sep 30. Proc Natl Acad Sci U S A. 2024. PMID: 39348545 - Phenotypic and spatial heterogeneity of CD8+ tumour infiltrating lymphocytes.
Sun Y, Yinwang E, Wang S, Wang Z, Wang F, Xue Y, Zhang W, Zhao S, Mou H, Chen S, Jin L, Li B, Ye Z. Sun Y, et al. Mol Cancer. 2024 Sep 9;23(1):193. doi: 10.1186/s12943-024-02104-w. Mol Cancer. 2024. PMID: 39251981 Free PMC article. Review. - Enhancing the Efficacy of CAR-T Cell Therapy: A Comprehensive Exploration of Cellular Strategies and Molecular Dynamics.
Baysal MA, Chakraborty A, Tsimberidou AM. Baysal MA, et al. J Cancer Immunol (Wilmington). 2024;6(1):20-28. doi: 10.33696/cancerimmunol.6.080. J Cancer Immunol (Wilmington). 2024. PMID: 39119270 Free PMC article. - Longitudinal Intravascular Antibody Labeling Identified Regulatory T Cell Recruitment as a Therapeutic Target in a Mouse Model of Lung Cancer.
Shanahan SL, Kunder N, Inaku C, Hagan NB, Gibbons G, Mathey-Andrews N, Anandappa G, Soares S, Pauken KE, Jacks T, Schenkel JM. Shanahan SL, et al. J Immunol. 2024 Sep 15;213(6):906-918. doi: 10.4049/jimmunol.2400268. J Immunol. 2024. PMID: 39082930 - Patient-Derived Tumor Organoids Combined with Function-Associated ScRNA-Seq for Dissecting the Local Immune Response of Lung Cancer.
Liu C, Li K, Sui X, Zhao T, Zhang T, Chen Z, Wu H, Li C, Li H, Yang F, Liu Z, Lu YY, Wang J, Chen X, Liu P. Liu C, et al. Adv Sci (Weinh). 2024 Aug;11(31):e2400185. doi: 10.1002/advs.202400185. Epub 2024 Jun 19. Adv Sci (Weinh). 2024. PMID: 38896792 Free PMC article.
References
- Robert C, et al. Nivolumab in previously untreated melanoma without BRAF mutation. N Engl J Med. 2015;372(4):320–330. - PubMed
Publication types
MeSH terms
Substances
LinkOut - more resources
Full Text Sources
Other Literature Sources
Molecular Biology Databases
Research Materials

