Immunofluorescence identifies distinct subsets of endothelial cells in the human liver - PubMed (original) (raw)
Immunofluorescence identifies distinct subsets of endothelial cells in the human liver
Otto Strauss et al. Sci Rep. 2017.
Abstract
As well as systemic vascular endothelial cells, the liver has specialised sinusoidal endothelial cells (LSEC). LSEC dysfunction has been documented in many diseased states yet their phenotype in normal human liver has not been comprehensively assessed. Our aim was to improve characterisation of subsets of endothelial cells and associated pericytes in the human liver. Immunofluorescence microscopy was performed on normal human liver tissue samples to assess endothelial and structural proteins in a minimum of three donors. LSEC are distributed in an acinar pattern and universally express CD36, but two distinctive subsets of LSEC can be identified in different acinar zones. Type 1 LSEC are CD36hiCD32-CD14-LYVE-1- and are located in acinar zone 1 of the lobule, while Type 2 LSEC are LYVE-1+CD32hiCD14+CD54+CD36mid-lo and are located in acinar zones 2 and 3 of the lobule. Portal tracts and central veins can be identified using markers for systemic vascular endothelia and pericytes, none of which are expressed by LSEC. In areas of low hydrostatic pressure LSEC are lined by stellate cells that express the pericyte marker CD146. Our findings identify distinctive populations of LSEC and distinguish these cells from adjacent stellate cells, systemic vasculature and pericytes in different zones of the liver acinus.
Conflict of interest statement
The authors declare no competing financial interests.
Figures
Figure 1. Graphical representation of the liver lobule highlighting the findings of this study. Microscopically the liver can be described by its functional unit, the acinus.
Blood drains from the portal vein and hepatic artery and mixes in the sinusoids and eventually drains to the CV. Z1 refers to area between two PT, and hepatocyte function changes as blood drains towards the CV. Hepatocytes are lined by two distinct subsets of LSEC, Type 1 which are located in Z1, and Type 2 which are located in Z2 and Z3. Bile is produced by hepatocytes and flows back via bile caniculi (Canals of Hering) towards the PT and eventually enters the bile duct. The authors acknowledge the assistance of Vivian L. Ward in the production of this figure.
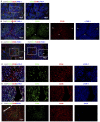
Figure 2. CD36 and LYVE-1 identify distinct subsets of LSEC.
(A) CD36hiLYVE-1loCD32− Type 1 LSEC are found in Z1. LYVE-1hi Type 2 LSEC line hepatocytes in Z2 and Z3 of the acinus (A–D) Z2 and Z3. CD32 (A) is most prominent closest to the CV on Type 2 LSEC. Type 2 LSEC also express CD14 (C–E). Z1 is clearly seen as being negative or low for CD32, LYVE-1 and CD14 and bright for CD36. (F) CD54 is also expressed by Type 2 LSEC, CK19 is used to identify PT and bile ducts in Z1.
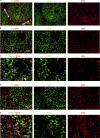
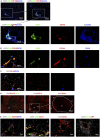
Figure 3. CD32 and CD36.
Representative Immunofluorescent Microscopy Images showing CD32 and CD36. (A) CD36 is expressed by LSEC in all zones of the lobule but is brightest in Z1 (Type 1 LSEC). Much like LYVE-1, CD32 is expressed brightly on LSEC throughout the lobule except on CD36hi Type 1 LSEC. (B and C) CD32 is brightest in Z2 and near the CV and although present, CD36 is lower on LSEC near the CV. (D and E) a transition zone of orange cells is visible on the border of Z1 as cells that brightly co-express CD32 and CD36. Type 1 LSEC are orientated in a more web-like pattern than Type 2 LSEC.
Figure 4. Z1 contains Type 1 CD36hi LSEC and terminating PT vasculature.
(A to D) Z1 in A is indicated by double pointed arrows, the inset is a higher magnification image. Terminal branches of the portal vein and hepatic artery, as shown by CD31 (green in A), CD34 (blue in C and D), CD105 (green in B) and associated CD146+ pericytes are replaced by sinusoidal endothelium. (C and D) CD146 can be seen very brightly in the Z1 region closest to the PT, presumably on or wrapped around terminal branches of arterial vascuature as it leaves the PT.
Figure 5. LSEC can be distinguished from CD36+, CD14+ and CD32+ APC.
(A) CD36hi Type 1 LSEC are distinct from CD68+ KC that can be seen occupying the sinusoidal lumen. This is exemplified by the lack of CD68 and CD36 co-expression. (B) Type 2 LSEC (in this slide represented by CD32) are spindle shaped and CD45−, as opposed to what appears to be a transiting monocyte identified by the arrow, Type 2 LSEC can also be identified by CD14 and are distinct from KC (as seen by the spindle shaped CD45−. Type 2 LSEC are also distinguishable from transiting monocytes (the round CD14hiCD45hi cells as identified by the arrow in this example) by using CD45.
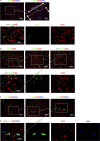
Figure 6. Identifying portal tracts using specific markers for pericytes.
(A) aSMA, laminin and CD146 is expressed by pericytes surrounding the hepatic artery and portal vein. These markers can be used individually or in combination to identify portal tracts. (B) Cytokeratin 19 (CK19) is brightly expressed on bile ducts, aSMA and CD146 identify pericytes surrounding portal vasculature. (C) CD13 (red) identifies bile caniculi coursing towards bile ducts, the luminal surface of which are also CD13+. PTs can be seen surrounding central veins. As bile ducts coalesce their CD13 appears more prominent, the white outline in third image in D roughly highlights the areas of Z1 between PTs. (E) Endothelial cells in the PT were positive for CD146, CD105, CD31, CD34, and von Willebrand factor. CD144 was expressed in the PT.
Figure 7. Identifying systemic vascular endothelium on the CV.
(A and B) aSMA and laminin are brightly expressed on cells around the outside of the CV and CD146 is present on CV endothelia but is much weaker than on PT vessels. (C) CV endothelia express CD146, CD105, CD31, CD34, and von Willebrand factor. CD144 was present in the CV. This particular image highlights the autofluoresence of red blood cells in a central vein.
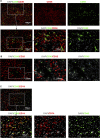
Figure 8. Immunofluoresence microscopy allows for an appreciation of the complexity of the perisinusoidal space.
(A and B) aSMA and laminin are expressed by cells in the “long axis” between two CV and are closely associated with LSEC. These cells have a higher expression of CD146 and may represent lobular pericytes, or stellate cells. LSEC in this region also express CD105. The expression of aSMA of these cells indicates a potential role in modulating blood flow within the lobule. (C) Higher magnification images highlight the complexity of the perisinusoidal space, CD105 on red identifies LSEC, aSMA stellate cells lie between hepatocytes in the Space of Disse, and CD13 identifying Canals of Hering between abutting hepatocytes.
Similar articles
- Endothelial transdifferentiation in hepatocellular carcinoma: loss of Stabilin-2 expression in peri-tumourous liver correlates with increased survival.
Géraud C, Mogler C, Runge A, Evdokimov K, Lu S, Schledzewski K, Arnold B, Hämmerling G, Koch PS, Breuhahn K, Longerich T, Marx A, Weiss C, Damm F, Schmieder A, Schirmacher P, Augustin HG, Goerdt S. Géraud C, et al. Liver Int. 2013 Oct;33(9):1428-40. doi: 10.1111/liv.12262. Epub 2013 Jul 21. Liver Int. 2013. PMID: 23870052 - Hepatic stellate cells display a functional vascular smooth muscle cell phenotype in a three-dimensional co-culture model with endothelial cells.
Wirz W, Antoine M, Tag CG, Gressner AM, Korff T, Hellerbrand C, Kiefer P. Wirz W, et al. Differentiation. 2008 Sep;76(7):784-94. doi: 10.1111/j.1432-0436.2007.00260.x. Epub 2008 Jan 3. Differentiation. 2008. PMID: 18177423 - Hepatic stellate cells--the pericytes in the liver.
Hellerbrand C. Hellerbrand C. Pflugers Arch. 2013 Jun;465(6):775-8. doi: 10.1007/s00424-012-1209-5. Epub 2013 Jan 5. Pflugers Arch. 2013. PMID: 23292551 Review. - Pericytes in the Liver.
Kostallari E, Shah VH. Kostallari E, et al. Adv Exp Med Biol. 2019;1122:153-167. doi: 10.1007/978-3-030-11093-2_9. Adv Exp Med Biol. 2019. PMID: 30937868 Free PMC article. Review.
Cited by
- Resolving the graft ischemia-reperfusion injury during liver transplantation at the single cell resolution.
Wang L, Li J, He S, Liu Y, Chen H, He S, Yin M, Zou D, Chen S, Luo T, Yu X, Wan X, Huang S, Guo Z, He X. Wang L, et al. Cell Death Dis. 2021 Jun 8;12(6):589. doi: 10.1038/s41419-021-03878-3. Cell Death Dis. 2021. PMID: 34103479 Free PMC article. - Endotheliopathy in the metabolic syndrome: Mechanisms and clinical implications.
Furuta K, Tang X, Islam S, Tapia A, Chen ZB, Ibrahim SH. Furuta K, et al. Pharmacol Ther. 2023 Apr;244:108372. doi: 10.1016/j.pharmthera.2023.108372. Epub 2023 Mar 7. Pharmacol Ther. 2023. PMID: 36894027 Free PMC article. Review. - Generation of functional liver sinusoidal endothelial-like cells from human bone marrow-derived mesenchymal stem cells.
Mitani S, Onodera Y, Hosoda C, Takabayashi Y, Sakata A, Shima M, Tatsumi K. Mitani S, et al. Regen Ther. 2023 Aug 1;24:274-281. doi: 10.1016/j.reth.2023.07.006. eCollection 2023 Dec. Regen Ther. 2023. PMID: 37575681 Free PMC article. - Multispectral Imaging Enables Characterization of Intrahepatic Macrophages in Patients With Chronic Liver Disease.
Saldarriaga OA, Freiberg B, Krishnan S, Rao A, Burks J, Booth AL, Dye B, Utay N, Ferguson M, Akil A, Yi M, Beretta L, Stevenson HL. Saldarriaga OA, et al. Hepatol Commun. 2020 Mar 3;4(5):708-723. doi: 10.1002/hep4.1494. eCollection 2020 May. Hepatol Commun. 2020. PMID: 32363321 Free PMC article. - CD32 captures committed haemogenic endothelial cells during human embryonic development.
Scarfò R, Randolph LN, Abou Alezz M, El Khoury M, Gersch A, Li ZY, Luff SA, Tavosanis A, Ferrari Ramondo G, Valsoni S, Cascione S, Didelon E, Passerini L, Amodio G, Brandas C, Villa A, Gregori S, Merelli I, Freund JN, Sturgeon CM, Tavian M, Ditadi A. Scarfò R, et al. Nat Cell Biol. 2024 May;26(5):719-730. doi: 10.1038/s41556-024-01403-0. Epub 2024 Apr 9. Nat Cell Biol. 2024. PMID: 38594587 Free PMC article.
References
- Lamers W. H. et al.. Hepatic enzymic zonation: a reevaluation of the concept of the liver acinus. Hepatology 10, 72–76 (1989). - PubMed
Publication types
MeSH terms
Substances
LinkOut - more resources
Full Text Sources
Other Literature Sources
Research Materials
Miscellaneous

