Regulatory Role of RNA Chaperone TDP-43 for RNA Misfolding and Repeat-Associated Translation in SCA31 - PubMed (original) (raw)
. 2017 Apr 5;94(1):108-124.e7.
doi: 10.1016/j.neuron.2017.02.046. Epub 2017 Mar 23.
Nozomu Sato 2, Morio Ueyama 3, Nobuhiro Fujikake 4, Chantal Sellier 5, Akemi Kanegami 6, Eiichi Tokuda 7, Bita Zamiri 8, Terence Gall-Duncan 9, Mila Mirceta 9, Yoshiaki Furukawa 7, Takanori Yokota 2, Keiji Wada 4, J Paul Taylor 10, Christopher E Pearson 9, Nicolas Charlet-Berguerand 5, Hidehiro Mizusawa 2, Yoshitaka Nagai 11, Kinya Ishikawa 12
Affiliations
- PMID: 28343865
- PMCID: PMC5681996
- DOI: 10.1016/j.neuron.2017.02.046
Regulatory Role of RNA Chaperone TDP-43 for RNA Misfolding and Repeat-Associated Translation in SCA31
Taro Ishiguro et al. Neuron. 2017.
Abstract
Microsatellite expansion disorders are pathologically characterized by RNA foci formation and repeat-associated non-AUG (RAN) translation. However, their underlying pathomechanisms and regulation of RAN translation remain unknown. We report that expression of expanded UGGAA (UGGAAexp) repeats, responsible for spinocerebellar ataxia type 31 (SCA31) in Drosophila, causes neurodegeneration accompanied by accumulation of UGGAAexp RNA foci and translation of repeat-associated pentapeptide repeat (PPR) proteins, consistent with observations in SCA31 patient brains. We revealed that motor-neuron disease (MND)-linked RNA-binding proteins (RBPs), TDP-43, FUS, and hnRNPA2B1, bind to and induce structural alteration of UGGAAexp. These RBPs suppress UGGAAexp-mediated toxicity in Drosophila by functioning as RNA chaperones for proper UGGAAexp folding and regulation of PPR translation. Furthermore, nontoxic short UGGAA repeat RNA suppressed mutated RBP aggregation and toxicity in MND Drosophila models. Thus, functional crosstalk of the RNA/RBP network regulates their own quality and balance, suggesting convergence of pathomechanisms in microsatellite expansion disorders and RBP proteinopathies.
Keywords: ALS; Drosophila melanogaster; RAN translation; RNA chaperone; RNA foci; SCA31; TDP-43; microsatellite repeat expansion diseases; ribonucleoprotein.
Copyright © 2017 Elsevier Inc. All rights reserved.
Figures
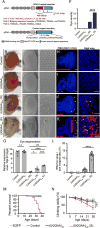
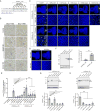
Figure 1. Expression of UGGAAexp in Drosophila Results in RNA Foci Formation and Toxicity
(A) Schematic of constructs used to express UGGAAexp and control repeat. (B–E) Light microscopy (LM; left) and scanning electron microscopy (SEM; middle and right) images of compound eyes from Drosophila females expressing control repeats (B), UGGAA22 (C), UGGAAexp (W) (D) or UGGAAexp (S) (E) using GMR-Gal4 (See also Figure S1 and Table S1). (F) Eye degeneration scores from the flies of the indicated genotypes. (G) Quantitative real-time PCR analysis of transgene expression in the indicated Drosophila lines (four independent experiments, n = 80 flies per genotype). (H–K) RNA FISH analyses in eye imaginal discs of L3 expressing the control repeat (H), UGGAA22 (I), UGGAAexp (W) (J) or UGGAAexp (S) (K) under GMR-GAL4 using LNA probes (red) and DAPI (blue). Scale bars = 50 or 10 µm (high mag.). RNA foci (arrowheads) are observed in (J) and (K). RNA foci are present in nuclei (arrows) and cytoplasm. (L) Quantification of area of RNA foci per larva. n = 8 (Control), 8(UGGAA22), 10 (W), 8 (S) respectively. (M) Lifespan analysis using _ELAV_-GeneSwitch. UGGAAexp (S) flies had a shorter lifespan than flies expressing EGFP, control repeats or UGGAA22 (p < 0.0001, log-rank test; n = 100–120 flies per group). (N) Changes in motor performance with age. UGGAAexp (S) flies showed more severe locomotor defects compared with flies expressing EGFP, control repeats or UGGAA22 (mean ± SD, n = 100–120; ***p < 0.001, two-way ANOVA). Data are presented as mean ± SEM. In (F), (G) and (L), p < 0.0001, one-way ANOVA; *p = 0.0186, ***p = 0.0008 (G), ****p < 0.0001, as assessed by Tukey’s post hoc analysis.
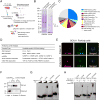
Figure 2. RNA-Binding Protein TDP-43 Interacts with UGGAA RNA In Vitro and In Vivo
(A) Schematic of method to identify RBPs in PC-12 cells and mouse brain. (B) Representative Coomassie-stained gels showing proteins pulled down by UGGAAexp repeat and control repeat. Arrow indicates TDP-43. (C) A pie-chart showing all 88 hits categorized by GO terms. (D) Protein candidates identified by binding to UGGAAexp RNA (See also Table S2). (E) Immunoblots confirming specific binding of TDP-43 to UGGAAexp RNA. (F) Combined RNA FISH and immunostaining in human SCA31 brains. (G) Binding of RNA oligonucleotides to increasing amounts of TDP-43 WT (See also Figure S2). (H) Heat denaturation and/or proteinase K treatment abolishes TDP-43 WT binding to RNA oligos, which then comigrate with unbound RNA.
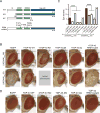
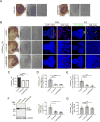
Figure 3. TDP-43 Suppresses UGGAAexp-Mediated Toxicity, and RNA Recognition Motifs in TDP-43 Are Required for its Rescuing Effects
(A) Schematic diagram of wild-type (WT) TDP-43, N- or C-terminus-deleted TDP43 (ΔN or ΔC, respectively), and RRM mutants used. (B) LM images of compound eyes from Drosophila females co-expressing TDP-43 variants or endogenous dTDP43 RNAi with UGGAAexp (W) and (S) using GMR-Gal4 (See also Figure S2). (C) Eye degeneration scores from the flies of the indicated genotypes (n = 10 per genotype). Data are presented as mean ± SEM, p < 0.0001, one-way ANOVA, ****p < 0.0001, p = 0.2353 (W line with EGFP versus W line with TDP-43 RRM mutant), p = 0.9999 (S line with EGFP versus S line with TDP-43 RRM mutant), Dunnett’s post hoc analysis; n.s. indicates no significant difference. (D) LM images of compound eyes from Drosophila females expressing TDP-43 variants using GMR-GAL4. TDP-43 WT and ΔN exhibited a slight rough-eye phenotype in Drosophila, whereas EGFP-expressing flies had a normal eye phenotype.
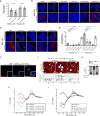
Figure 4. TDP-43 Functions as an RNA Chaperone for UGGAAexp RNA Misfolding
(A) Quantitative real-time PCR analysis of transgene expression in the indicated Drosophila lines (four independent experiments, n = 80 flies per genotype). Data are presented as mean ± SEM, p = 0.139 (W line with EGFP versus W line with TDP-43 WT), p = 0.5514 (S line with EGFP versus S line with TDP-43 WT), two-tailed unpaired Student’s _t_-test; n.s.: not significant. (B) RNA FISH analyses of eye imaginal discs of UGGAAexp (W) L3 coexpressing TDP-43, RRM mutant or dTDP-43 RNAi. Arrows indicate increased numbers of nuclear RNA foci. Scale bars = 50 or 10 µm (high mag.). (C) RNA FISH analyses of eye imaginal discs of L3 of the UGGAAexp (S) coexpressing TDP-43 or RRM mutant. Arrows indicate abnormally large RNA foci, and arrowheads indicate granular RNA foci. Scale bars = 50 or 10 µm (high mag.). (D) Quantification of the area of RNA foci in flies of each genotype (n = 6–10). Data are presented as mean ± SEM, p < 0.0001 (W line group), p < 0.0001 (S line group), one-way ANOVA; ***p < 0.001, ****p < 0.0001, p = 0.2577 (W line with EGFP versus W line with TDP-43 RRM), *p = 0.0125 (S line with EGFP versus S line with TDP-43 RRM), Dunnett’s _post hoc_ analysis; n.s.: not significant. (E) Immunostaining of TDP-43 in eye imaginal disc of L3 expressing UGGAAexp (W) and TDP-43. TDP-43 colocalized with UGGAAexp RNA transcripts in cell nuclei (arrowheads). Dotted line represents morphogenetic furrow (MF). (F and G) AFM images (F) and distribution column (G) of RNAs UGGAAexp having approximately 20 repeat units or more, the RNA solution showing decreased UGGAAexp aggregation by TDP-43 ΔC. In (F), scale bars = 50 nm. (G) Relative amount of RNA species between TDP43 ΔC (−) and (+) at 10 min; n > 900 molecules counted. Data are presented as mean ± SD, p < 0.0001(ssRNA), p = 0.0001 (small aggregates), p < 0.0001 (large aggregates), one –way ANOVA. **p = 0.0016, ****p < 0.0001, Tukey’s post hoc analysis (See also Figure S3). (H) Titration experiments [0 mM (black), 5 mM (red), 10 mM (blue) and 15 mM (green)] of GST–TDP-43 WT were used with a fixed concentration of (UGGAA)8 RNAs (5 µM) and assessed by CD spectroscopy. (I) CD spectra of (UGGAA)8 alone (black), TDP-43 alone (red), the sum of spectrum obtained from TDP-43 and (UGGAA)8 separately (blue) and the spectra obtained from incubating them together, corresponding to (UGGAA)8 + TDP-43 binding (green).
Figure 5. TDP-43 Negatively Regulates the Synthesis of PPR Proteins
(A) Schematic of PPR proteins. Amino acids are shown as single letters. Asterisk (*) indicates a stop codon in the sequence surrounding the UGGAA repeat. (B) Immunostaining for PPR proteins with SGJ-1705 (top) and SGJ-176 (bottom) antibodies in human brain tissues. PPR proteins are detected in cell bodies and dendrites of SCA31 Purkinje cells as dot-like granules (arrows), but not in controls. Scale bars = 50 µm (See also Figure S4). (C) Immunofluorescence of PPR proteins in eye imaginal discs of the UGGAAexp (W) or (S) line coexpressing TDP-43 WT, RRM mutant or dTDP-43 knockdown (RNAi). Scale bars = 50 or 10 µm (high mag.). (D) PPR proteins are not observed in eye imaginal discs of flies expressing control repeat or UGGAA22 using GMR-GAL4 by immunostaining with an anti-PPR antibody. Scale bars = 50 or 10 µm (high mag.). (E) Quantification of PPR protein area in flies of the indicated genotypes (n = 6–10). (F) Immunoblotting and quantification of PPR proteins in lysates of eye imaginal discs (four independent experiments, n = 40 flies per each genotype). Data are presented as mean ± SEM, p = 0.0004, two-tailed unpaired Student’s t-test. Note that the molecular weights of PPR proteins are slightly different between the W and S lines or between experiments because of their difference in the sizes of UGGAA repeats in our SCA31 flies due to their instability. (G–H) Immunoblotting and quantification of PPR proteins in lysates of eye imaginal discs (four independent experiments, n = 40 flies per each genotype) (See also Figure S5). In (E), data are presented as mean ± SEM, p < 0.0001 (W line group), p < 0.0001 (S line group), one-way ANOVA; *p = 0.0313, ***p = 0.0001, ****p < 0.0001, p = 0.8703 (W line with EGFP versus W line with dTBPH-KD), Dunnett’s post hoc analysis, n.s.: not significant. In (G–H), p < 0.0001, one-way ANOVA, ***p <0.001, ****p < 0.0001, p = 0.9984 (W line with EGFP versus W line with dTDP-43 KD), Dunnett’s post hoc analysis, n.s.: not significant.
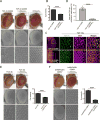
Figure 6. FUS and hnRNPA2B1 Suppress UGGAAexp-Mediated Toxicity, RNA Foci Formation and PPR Protein Synthesis
(A) LM (left) and SEM (middle and right) images of the compound eyes of Drosophila females expressing FUS (upper) or hnRNPA2B1 (lower). The expression of FUS or hnRNPA2B1 alone caused slight compound eye degeneration in Drosophila. (B) Upregulation of FUS and hnRNPA2B1 mitigates compound eye degeneration of Drosophila expressing UGGAAexp (S) (See also Figure S6). FUS and hnRNPA2B1 reduce RNA foci and PPR protein accumulation in eye imaginal discs of L3. FUS (W) has weak FUS expression. Scale bars = 50 or 10 µm (high mag.). (C) Eye degeneration scores from the flies of the indicated genotypes (n = 10). (D) Quantification of the area of RNA foci in each Drosophila line (n = 7–11). (E) Quantification of PPR proteins in each Drosophila line (n = 6–10). (F) Immunoblotting and quantification of PPR protein in lysates of eye imaginal discs (three independent experiments, n =30 flies per each genotype). (G) Quantitative real-time PCR analysis of transgene expression in each indicated Drosophila line (four independent experiments, n = 80 flies per each genotype). In (C–E), data are presented as mean ± SEM, p < 0.0001, one-way ANOVA; ****p =0.0001, as assessed by Dunnett’s post hoc analysis. In (F), p = 0.0155 (F), one-way ANOVA, *p = 0.0249 (S line with EGFP versus S line with FUS W), *p = 0.0143 (S line with EGFP versus S line with hnRNPA2B1), Dunnett’s post hoc analysis. In (G), p = 0.3073, one-way ANOVA, n.s.: not significant.
Figure 7. Nontoxic Short UGGAA Repeat RNAs Mitigate ALS-Linked TDP-43 Toxicity
(A) LM (upper) and SEM (middle and lower) images of compound eyes from Drosophila females expressing TDP-43 G298S mutant only, UGGGAA22 only and TDP-43 G298S mutant with UGGAA22 (See also Figure S7). (B) Eye degeneration scores from the flies of the indicated genotypes (n = 7). (C) Immunohistochemistry of eye imaginal discs detected TDP-43 (green) and DAPI staining (magenta). Scale bars = 20 µm. (D) Quantification of proportion of cells with TDP-43 cytoplasmic inclusions in TDP-43 G298S and TDP-43 G298S/UGGAA22 fly lines. (E–F) LM and SEM images with eye degeneration scores of compound eyes from Drosophila females in each genotype (n = 7). In (B–F), data are presented as mean ± SEM, ****p < 0.0001, two-tailed unpaired Student’s _t_-test.
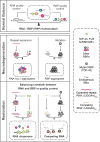
Figure 8. Model of Pathogenic Imbalance in RNP Homeostasis in Microsatellite Expansion Disorders or MND
Our in vivo and in vitro data suggest that not only TDP-43 regulate RNA toxicity, but the opposite can also occur; namely, nontoxic short RNA can regulate TDP-43 toxicity, suggesting that balanced crosstalk of RNA and RBP contributes to maintaining RNP homeostasis.
Comment in
- SCA31 Flies Perform in a Balancing Act between RAN Translation and RNA-Binding Proteins.
Jackson GR. Jackson GR. Neuron. 2017 Apr 5;94(1):4-5. doi: 10.1016/j.neuron.2017.03.030. Neuron. 2017. PMID: 28384473
Similar articles
- Insight Into Spinocerebellar Ataxia Type 31 (SCA31) From Drosophila Model.
Ishiguro T, Nagai Y, Ishikawa K. Ishiguro T, et al. Front Neurosci. 2021 May 25;15:648133. doi: 10.3389/fnins.2021.648133. eCollection 2021. Front Neurosci. 2021. PMID: 34113230 Free PMC article. Review. - Molecular Mechanisms and Future Therapeutics for Spinocerebellar Ataxia Type 31 (SCA31).
Ishikawa K, Nagai Y. Ishikawa K, et al. Neurotherapeutics. 2019 Oct;16(4):1106-1114. doi: 10.1007/s13311-019-00804-6. Neurotherapeutics. 2019. PMID: 31755042 Free PMC article. Review. - Abnormal RNA structures (RNA foci) containing a penta-nucleotide repeat (UGGAA)n in the Purkinje cell nucleus is associated with spinocerebellar ataxia type 31 pathogenesis.
Niimi Y, Takahashi M, Sugawara E, Umeda S, Obayashi M, Sato N, Ishiguro T, Higashi M, Eishi Y, Mizusawa H, Ishikawa K. Niimi Y, et al. Neuropathology. 2013 Dec;33(6):600-11. doi: 10.1111/neup.12032. Epub 2013 Apr 22. Neuropathology. 2013. PMID: 23607545 - SCA31 Flies Perform in a Balancing Act between RAN Translation and RNA-Binding Proteins.
Jackson GR. Jackson GR. Neuron. 2017 Apr 5;94(1):4-5. doi: 10.1016/j.neuron.2017.03.030. Neuron. 2017. PMID: 28384473 - TDP-43 suppresses CGG repeat-induced neurotoxicity through interactions with HnRNP A2/B1.
He F, Krans A, Freibaum BD, Taylor JP, Todd PK. He F, et al. Hum Mol Genet. 2014 Oct 1;23(19):5036-51. doi: 10.1093/hmg/ddu216. Epub 2014 May 8. Hum Mol Genet. 2014. PMID: 24920338 Free PMC article.
Cited by
- Midbrain atrophy related to parkinsonism in a non-coding repeat expansion disorder: five cases of spinocerebellar ataxia type 31 with nigrostriatal dopaminergic dysfunction.
Norioka R, Sugaya K, Murayama A, Kawazoe T, Tobisawa S, Kawata A, Takahashi K. Norioka R, et al. Cerebellum Ataxias. 2021 Mar 30;8(1):11. doi: 10.1186/s40673-021-00134-4. Cerebellum Ataxias. 2021. PMID: 33785066 Free PMC article. - U6 snRNA expression prevents toxicity in TDP-43-knockdown cells.
Yahara M, Kitamura A, Kinjo M. Yahara M, et al. PLoS One. 2017 Nov 10;12(11):e0187813. doi: 10.1371/journal.pone.0187813. eCollection 2017. PLoS One. 2017. PMID: 29125873 Free PMC article. - Therapeutic Genome Editing for Myotonic Dystrophy Type 1 Using CRISPR/Cas9.
Wang Y, Hao L, Wang H, Santostefano K, Thapa A, Cleary J, Li H, Guo X, Terada N, Ashizawa T, Xia G. Wang Y, et al. Mol Ther. 2018 Nov 7;26(11):2617-2630. doi: 10.1016/j.ymthe.2018.09.003. Epub 2018 Sep 11. Mol Ther. 2018. PMID: 30274788 Free PMC article. - CCG•CGG interruptions in high-penetrance SCA8 families increase RAN translation and protein toxicity.
Perez BA, Shorrock HK, Banez-Coronel M, Zu T, Romano LE, Laboissonniere LA, Reid T, Ikeda Y, Reddy K, Gomez CM, Bird T, Ashizawa T, Schut LJ, Brusco A, Berglund JA, Hasholt LF, Nielsen JE, Subramony SH, Ranum LP. Perez BA, et al. EMBO Mol Med. 2021 Nov 8;13(11):e14095. doi: 10.15252/emmm.202114095. Epub 2021 Oct 11. EMBO Mol Med. 2021. PMID: 34632710 Free PMC article. - RAN proteins in neurodegenerative disease: Repeating themes and unifying therapeutic strategies.
Guo S, Nguyen L, Ranum LPW. Guo S, et al. Curr Opin Neurobiol. 2022 Feb;72:160-170. doi: 10.1016/j.conb.2021.11.001. Epub 2021 Dec 22. Curr Opin Neurobiol. 2022. PMID: 34953315 Free PMC article. Review.
References
- Buratti E, Baralle FE. Characterization and functional implications of the RNA binding properties of nuclear factor TDP-43, a novel splicing regulator of CFTR exon 9. J. Biol. Chem. 2001;276:36337–36343. - PubMed
MeSH terms
Substances
Supplementary concepts
LinkOut - more resources
Full Text Sources
Other Literature Sources
Molecular Biology Databases
Miscellaneous
