Locoregional Effects of Microbiota in a Preclinical Model of Colon Carcinogenesis - PubMed (original) (raw)
. 2017 May 15;77(10):2620-2632.
doi: 10.1158/0008-5472.CAN-16-3472. Epub 2017 Apr 17.
Ye Yang 1, Kathryn Winglee 3, Josee Gauthier 1, Marcus Mühlbauer 1, Xiaolun Sun 1, Mansour Mohamadzadeh 4, Xiuli Liu 5, Patricia Martin 6 7, Gary P Wang 8, Eric Oswald 6 7, Anthony A Fodor 3, Christian Jobin 9 4
Affiliations
- PMID: 28416491
- PMCID: PMC5468752
- DOI: 10.1158/0008-5472.CAN-16-3472
Locoregional Effects of Microbiota in a Preclinical Model of Colon Carcinogenesis
Sarah Tomkovich et al. Cancer Res. 2017.
Abstract
Inflammation and microbiota are critical components of intestinal tumorigenesis. To dissect how the microbiota contributes to tumor distribution, we generated germ-free (GF) ApcMin/+ and ApcMin/+ ;Il10-/- mice and exposed them to specific-pathogen-free (SPF) or colorectal cancer-associated bacteria. We found that colon tumorigenesis significantly correlated with inflammation in SPF-housed ApcMin/+ ;Il10-/- , but not in ApcMin/+ mice. In contrast, small intestinal neoplasia development significantly correlated with age in both ApcMin/+ ;Il10-/- and ApcMin/+ mice. GF ApcMin/+ ;Il10-/- mice conventionalized by an SPF microbiota had significantly more colon tumors compared with GF mice. Gnotobiotic studies revealed that while Fusobacterium nucleatum clinical isolates with FadA and Fap2 adhesins failed to induce inflammation and tumorigenesis, pks+Escherichia coli promoted tumorigenesis in the ApcMin/+ ;Il10-/- model in a colibactin-dependent manner, suggesting colibactin is a driver of carcinogenesis. Our results suggest a distinct etiology of cancers in different locations of the gut, where colon cancer is primarily driven by inflammation and the microbiome, while age is a driving force for small intestine cancer. Cancer Res; 77(10); 2620-32. ©2017 AACR.
©2017 American Association for Cancer Research.
Figures
Figure 1
Inflammation fosters CRC development in genetically engineered mice. A) Macroscopic colon tumor counts from 12–51 week old SPF ApcMin/+;_Il10_−/− and ApcMin/+ mice. B) Colon combined histological inflammation scores (the average of the proximal and distal inflammation scores) from SPF ApcMin/+;_Il10_−/− and ApcMin/+ mice. C-D) Cecum and small intestine macroscopic tumor counts from SPF ApcMin/+;_Il10_−/− and ApcMin/+ mice. E) Colon H&Es from 30–40 week old SPF ApcMin/+;_Il10_−/− and ApcMin/+ mice (5×, 40× magnification). F) Relationship between colon inflammation score and macroscopic colon or small intestine tumors in SPF ApcMin/+;_Il10_−/− and ApcMin/+ mice. G) Relationship between mouse endpoint age and macroscopic tumors in SPF ApcMin/+;_Il10_−/− and ApcMin/+ mice. Spearman correlation r values and corresponding p values are noted in each panel. Data are expressed as mean +/− standard deviation (SD). Two-tailed Mann-Whitney statistical analysis: ****p< 0.0001, ***p< 0.001, **p< 0.01, *p< 0.05, NS: not significant.
Figure 2
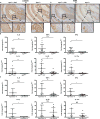
ApcMin/+;_Il10_−/− mice have increased colon proliferation and inflammation. A-B) CTNNB1 immunohistochemistry (IHC) from ~16 week old SPF ApcMin/+;_Il10_−/− (A) and ApcMin/+ (B) colons. C-D) PCNA IHC from SPF ApcMin/+;_Il10_−/− (C) and ApcMin/+ (D) colons. Higher magnification of both dysplastic and normal regions are shown for SPF ApcMin/+;_Il10_−/− mice. E) IL-6, TNFα, IFNγ, IL-1β, IL-22 and IL-17a mRNA expression in 16–48 week old SPF ApcMin/+;_Il10_−/− and ApcMin/+ proximal colon tissue snips with relative fold expression compared to ApcMin/+ mice. F) IL-6, TNFα, IFNγ, IL-1β, IL-22 and IL-17a mRNA expression in 16–48 week old SPF ApcMin/+;_Il10_−/− stratified by tumor number (high: > 2 tumors or low: ≤ 2 tumors) with relative fold expression compared to ApcMin/+ mice. Data are expressed as mean +/− SD. Two-tailed Mann-Whitney statistical analysis: ****p< 0.0001, ***p< 0.001, **p< 0.01, *p< 0.05, NS: not significant.
Figure 3
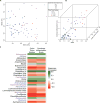
SPF ApcMin/+;_Il10_−/− with colon tumors and colitis have an altered stool microbiota. A) PCoA comparing the stool microbial composition of SPF ApcMin/+;_Il10_−/− mice. Each symbol represents an individual mouse (n= 70) with symbol shape and color according to colon inflammation score and tumor number, respectively. B) 3D plot showing how MDS1 from the PCoA (x axis) varies with combined inflammation score (y axis) and colon tumor number (z axis). C) Heatmap depicting the Spearman correlations (positive correlations in green, negative correlations in red) for genera that are significantly associated with colon tumor number and/or colitis in ApcMin/+;_Il10_−/− mice. Genera significant for both colon tumor number and combined inflammation score are in black font, colon tumor number only in purple font, and combined inflammation score only in blue font.
Figure 4
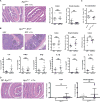
Bacteria promote distal colon inflammation and tumorigenesis in ApcMin/+;_Il10_−/− mice. A–C) Colon macroscopic tumor counts (A), colitis scores (B), and small intestine tumor counts (C) from GF (n=7), SPF transferred (n=5) and SPF gavaged (n=7) ApcMin/+;_Il10_−/− mice. SPF transfer (transferred to SPF and allowed to naturally acquire their microbiota) and gavage (transferred to SPF and gavaged with the cecal and fecal contents from a wild type 129SvEv mouse) mice were sacrificed 16 weeks after transfer from GF. D) Colon H&Es from GF, SPF transferred, and SPF gavaged ApcMin/+;_Il10_−/− mice. Data are expressed as mean +/− SD. Two-tailed Mann-Whitney statistical analysis: ****p< 0.0001, ***p< 0.001, **p< 0.01, *p< 0.05, NS: not significant.
Figure 5
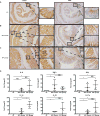
Microbiota promote colon inflammation and proliferation in ApcMin/+;_Il10_−/− mice. A-C) β-catenin and PCNA IHC from GF (A), SPF transferred (B), and SPF gavaged (C) ApcMin/+;_Il10_−/− distal colons. Higher magnification of both dysplastic and normal regions are shown for SPF transfer and gavage ApcMin/+;_Il10_−/− mice. D) IL-6, TNFα, IFNγ, IL-1β, IL-22 and IL-17a mRNA expression in GF (n=5), SPF transfer (n=4), and SPF gavaged (n=4) ApcMin/+;_Il10_−/− proximal colon tissue snips with relative fold expression compared to GF. Data are expressed as mean +/− SD. Two-tailed Mann-Whitney statistical analysis: ****p< 0.0001, ***p< 0.001, **p< 0.01, *p< 0.05, NS: not significant.
Figure 6
F. nucleatum (Fn) does not exhibit pro-inflammatory and pro-tumorigenic activities. A) GF ApcMin/+ mice were transferred to SPF conditions and immediately gavaged with SPF microbiota (n= 6). SPF+Fn mice (n= 8) received Fn (a single strain human CRC isolate) via weekly gavage. SPF (control) mice received weekly gavage of BHI medium. Tumorigenesis was examined 20 weeks later. B) GF ApcMin/+;_Il10_−/− mice were transferred to SPF conditions and immediately gavaged with SPF microbiota (n= 4). SPF+Fn mice (n=6) received Fn (a mixture of 6 human CRC isolates) via weekly gavage. SPF (control) mice received weekly gavage of BHI medium. Tumorigenesis and inflammation were examined 16 weeks later (top panel). IL-6, TNFα, IFNγ, IL-1β, IL-22 and IL-17a mRNA expression in SPF and SPF+Fn ApcMin/+;_Il10_−/− distal colon snips (bottom panel). C) qPCR examination of fecal Fn levels in SPF+Fn ApcMin/+ and ApcMin/+;_Il10_−/−− mice. D) GF ApcMin/+ mice were transferred to a gnotobiotic isolator and gavaged with Fn (a mixture of 6 human CRC isolates). Tumorigenesis was examined 16 weeks later (GF n= 5 and Fn colonized n=9). In panels A-B, D, representative histology images of the colon are shown on the left. Macroscopic tumor counts are shown on the right. Data are expressed as mean +/− SD. Two-tailed Mann-Whitney statistical analysis: *p< 0.05, NS: not significant.
Figure 7
Colibactin promotes CRC development in ApcMin/+;_Il10_−/− mice. A–C) Colon tumor counts (A), colitis scores (B), and small intestine tumor counts (C) from GF ApcMin/+;Il10_−/− (n=6) and 16 week E. coli NC101 (n=7) or Δ_clbP (n=6) mono-associated ApcMin/+;Il10_−/− mice. D) IL-6, TNFα, IFNγ, IL-1β, IL-22 and IL-17a mRNA expression in NC101 (n=5) or Δ_clbP (n=5) mono-associated ApcMin/+;Il10_−/− distal colon snips with relative fold expression compared to Δ_clbP mono-associated ApcMin/+;_Il10_−/− mice. Data are expressed as mean +/− SD. Two-tailed Mann-Whitney statistical analysis: ****p< 0.0001, ***p< 0.001, **p< 0.01, *p< 0.05, NS: not significant.
Similar articles
- Microbiota Effects on Carcinogenesis: Initiation, Promotion, and Progression.
Lopez LR, Bleich RM, Arthur JC. Lopez LR, et al. Annu Rev Med. 2021 Jan 27;72:243-261. doi: 10.1146/annurev-med-080719-091604. Epub 2020 Oct 14. Annu Rev Med. 2021. PMID: 33052764 Free PMC article. Review. - Autophagy of Intestinal Epithelial Cells Inhibits Colorectal Carcinogenesis Induced by Colibactin-Producing Escherichia coli in ApcMin/+ Mice.
Lucas C, Salesse L, Hoang MHT, Bonnet M, Sauvanet P, Larabi A, Godfraind C, Gagnière J, Pezet D, Rosenstiel P, Barnich N, Bonnet R, Dalmasso G, Nguyen HTT. Lucas C, et al. Gastroenterology. 2020 Apr;158(5):1373-1388. doi: 10.1053/j.gastro.2019.12.026. Epub 2020 Jan 7. Gastroenterology. 2020. PMID: 31917256 - Comparative Analysis of Colon Cancer-Derived Fusobacterium nucleatum Subspecies: Inflammation and Colon Tumorigenesis in Murine Models.
Queen J, Domingue JC, White JR, Stevens C, Udayasuryan B, Nguyen TTD, Wu S, Ding H, Fan H, McMann M, Corona A, Larman TC, Verbridge SS, Housseau F, Slade DJ, Drewes JL, Sears CL. Queen J, et al. mBio. 2021 Feb 22;13(1):e0299121. doi: 10.1128/mbio.02991-21. Epub 2022 Feb 8. mBio. 2021. PMID: 35130731 Free PMC article. - Aspirin Reduces Colorectal Tumor Development in Mice and Gut Microbes Reduce its Bioavailability and Chemopreventive Effects.
Zhao R, Coker OO, Wu J, Zhou Y, Zhao L, Nakatsu G, Bian X, Wei H, Chan AWH, Sung JJY, Chan FKL, El-Omar E, Yu J. Zhao R, et al. Gastroenterology. 2020 Sep;159(3):969-983.e4. doi: 10.1053/j.gastro.2020.05.004. Epub 2020 May 6. Gastroenterology. 2020. PMID: 32387495 - The Intestinal Microbiota and Colorectal Cancer.
Cheng Y, Ling Z, Li L. Cheng Y, et al. Front Immunol. 2020 Nov 30;11:615056. doi: 10.3389/fimmu.2020.615056. eCollection 2020. Front Immunol. 2020. PMID: 33329610 Free PMC article. Review.
Cited by
- Microbiota Effects on Carcinogenesis: Initiation, Promotion, and Progression.
Lopez LR, Bleich RM, Arthur JC. Lopez LR, et al. Annu Rev Med. 2021 Jan 27;72:243-261. doi: 10.1146/annurev-med-080719-091604. Epub 2020 Oct 14. Annu Rev Med. 2021. PMID: 33052764 Free PMC article. Review. - Determination of biomarkers associated with neoadjuvant treatment response focusing on colibactin-producing Escherichia coli in patients with mid or low rectal cancer: a prospective clinical study protocol (MICARE).
Taoum C, Carrier G, Jarlier M, Roche G, Gagniere J, Fiess C, De Forges H, Chevarin C, Colombo PE, Barnich N, Rouanet P, Bonnet M. Taoum C, et al. BMJ Open. 2022 Dec 2;12(12):e061527. doi: 10.1136/bmjopen-2022-061527. BMJ Open. 2022. PMID: 36460331 Free PMC article. Clinical Trial. - Multi-kingdom microbial signatures in excess body weight colorectal cancer based on global metagenomic analysis.
Zhu X, Xu P, Zhu R, Gao W, Yin W, Lan P, Zhu L, Jiao N. Zhu X, et al. Commun Biol. 2024 Jan 5;7(1):24. doi: 10.1038/s42003-023-05714-0. Commun Biol. 2024. PMID: 38182885 Free PMC article. - Intestinal bacteria and colorectal cancer: etiology and treatment.
Dougherty MW, Jobin C. Dougherty MW, et al. Gut Microbes. 2023 Jan-Dec;15(1):2185028. doi: 10.1080/19490976.2023.2185028. Gut Microbes. 2023. PMID: 36927206 Free PMC article. Review. - Antibiotics suppress colon tumorigenesis through inhibition of aberrant DNA methylation in an azoxymethane and dextran sulfate sodium colitis model.
Hattori N, Niwa T, Ishida T, Kobayashi K, Imai T, Mori A, Kimura K, Mori T, Asami Y, Ushijima T. Hattori N, et al. Cancer Sci. 2019 Jan;110(1):147-156. doi: 10.1111/cas.13880. Epub 2018 Dec 13. Cancer Sci. 2019. PMID: 30443963 Free PMC article.
References
- Siegel RL, Miller KD, Jemal A. Cancer statistics, 2016. CA Cancer J Clin. 2016;66:7–30. - PubMed
- Borges-Canha M, Portela-Cidade JP, Dinis-Ribeiro M, Leite-Moreira AF, Pimentel-Nunes P. Role of colonic microbiota in colorectal carcinogenesis: a systematic review. Rev Esp Enferm Dig. 2015;107:659–71. - PubMed
- Lasry A, Zinger A, Ben-Neriah Y. Inflammatory networks underlying colorectal cancer. Nat Immunol. 2016;17:230–40. - PubMed
Publication types
MeSH terms
Substances
Grants and funding
- R01 AT008623/AT/NCCIH NIH HHS/United States
- R01 DK047700/DK/NIDDK NIH HHS/United States
- R01 DK073338/DK/NIDDK NIH HHS/United States
- R21 CA195226/CA/NCI NIH HHS/United States
LinkOut - more resources
Full Text Sources
Other Literature Sources
Medical
Molecular Biology Databases
Miscellaneous


