Removal of batch effects using distribution-matching residual networks - PubMed (original) (raw)
Removal of batch effects using distribution-matching residual networks
Uri Shaham et al. Bioinformatics. 2017.
Abstract
Motivation: Sources of variability in experimentally derived data include measurement error in addition to the physical phenomena of interest. This measurement error is a combination of systematic components, originating from the measuring instrument and random measurement errors. Several novel biological technologies, such as mass cytometry and single-cell RNA-seq (scRNA-seq), are plagued with systematic errors that may severely affect statistical analysis if the data are not properly calibrated.
Results: We propose a novel deep learning approach for removing systematic batch effects. Our method is based on a residual neural network, trained to minimize the Maximum Mean Discrepancy between the multivariate distributions of two replicates, measured in different batches. We apply our method to mass cytometry and scRNA-seq datasets, and demonstrate that it effectively attenuates batch effects.
Availability and implementation: our codes and data are publicly available at https://github.com/ushaham/BatchEffectRemoval.git.
Contact: yuval.kluger@yale.edu.
Supplementary information: Supplementary data are available at Bioinformatics online.
© The Author (2017). Published by Oxford University Press. All rights reserved. For Permissions, please email: journals.permissions@oup.com
Figures
Fig. 1
Calibration of CyTOF data. Projection of the source (red) and target (blue) samples on the first two principal components of the target data. Left: before calibration. Right: after calibration
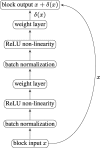
Fig. 2
A typical ResNet block
Fig. 3
Quality of calibration in terms of the marginal distribution of each marker. Empirical cumulative distribution functions of the first three markers in the CyTOF calibration experiment. In each plot the full, dashed and dotted curves corresponds to the target, source and calibrated source samples, respectively. In each marker the full and dotted curves are substantially closer than the full and dashed curves
Fig. 4
Calibration of CyTOF data: CD8 + T-cells cells (red) and target (blue) samples in the (CD28, GzB) plane. Left: before calibration. Center: calibration using MLP. Right, calibration using ResNet
Fig. 5
Histograms of the 25 _P_-values of Kolmogorov-Smirnov tests, comparing the distributions of the calibrated data with the target distribution of each of the 25 markers
Fig. 6
Calibration of scRNA-seq. Top: _t_-SNE plots before (left) and after (right) calibration using MMD-ResNet. Bottom: Calibration of cells with high expression of Prkca. _t_-SNE plots before calibration (left), after calibration using Combat (middle) and MMD-ResNet (right)
Similar articles
- Gating mass cytometry data by deep learning.
Li H, Shaham U, Stanton KP, Yao Y, Montgomery RR, Kluger Y. Li H, et al. Bioinformatics. 2017 Nov 1;33(21):3423-3430. doi: 10.1093/bioinformatics/btx448. Bioinformatics. 2017. PMID: 29036374 Free PMC article. - HDMC: a novel deep learning-based framework for removing batch effects in single-cell RNA-seq data.
Wang X, Wang J, Zhang H, Huang S, Yin Y. Wang X, et al. Bioinformatics. 2022 Feb 7;38(5):1295-1303. doi: 10.1093/bioinformatics/btab821. Bioinformatics. 2022. PMID: 34864918 - ResPAN: a powerful batch correction model for scRNA-seq data through residual adversarial networks.
Wang Y, Liu T, Zhao H. Wang Y, et al. Bioinformatics. 2022 Aug 10;38(16):3942-3949. doi: 10.1093/bioinformatics/btac427. Bioinformatics. 2022. PMID: 35771600 Free PMC article. - Machine learning and statistical methods for clustering single-cell RNA-sequencing data.
Petegrosso R, Li Z, Kuang R. Petegrosso R, et al. Brief Bioinform. 2020 Jul 15;21(4):1209-1223. doi: 10.1093/bib/bbz063. Brief Bioinform. 2020. PMID: 31243426 Review. - Design and computational analysis of single-cell RNA-sequencing experiments.
Bacher R, Kendziorski C. Bacher R, et al. Genome Biol. 2016 Apr 7;17:63. doi: 10.1186/s13059-016-0927-y. Genome Biol. 2016. PMID: 27052890 Free PMC article. Review.
Cited by
- Single Cell RNA Sequencing in Autoimmune Inflammatory Rheumatic Diseases: Current Applications, Challenges and a Step Toward Precision Medicine.
Kuret T, Sodin-Šemrl S, Leskošek B, Ferk P. Kuret T, et al. Front Med (Lausanne). 2022 Jan 18;8:822804. doi: 10.3389/fmed.2021.822804. eCollection 2021. Front Med (Lausanne). 2022. PMID: 35118101 Free PMC article. Review. - In-silico generation of high-dimensional immune response data in patients using a deep neural network.
Fallahzadeh R, Bidoki NH, Stelzer IA, Becker M, Marić I, Chang AL, Culos A, Phongpreecha T, Xenochristou M, De Francesco D, Espinosa C, Berson E, Verdonk F, Angst MS, Gaudilliere B, Aghaeepour N. Fallahzadeh R, et al. Cytometry A. 2023 May;103(5):392-404. doi: 10.1002/cyto.a.24709. Epub 2022 Dec 27. Cytometry A. 2023. PMID: 36507780 Free PMC article. - deepMNN: Deep Learning-Based Single-Cell RNA Sequencing Data Batch Correction Using Mutual Nearest Neighbors.
Zou B, Zhang T, Zhou R, Jiang X, Yang H, Jin X, Bai Y. Zou B, et al. Front Genet. 2021 Aug 10;12:708981. doi: 10.3389/fgene.2021.708981. eCollection 2021. Front Genet. 2021. PMID: 34447413 Free PMC article. - A novel batch-effect correction method for scRNA-seq data based on Adversarial Information Factorization.
Monnier L, Cournède PH. Monnier L, et al. PLoS Comput Biol. 2024 Feb 22;20(2):e1011880. doi: 10.1371/journal.pcbi.1011880. eCollection 2024 Feb. PLoS Comput Biol. 2024. PMID: 38386700 Free PMC article. - CytofIn enables integrated analysis of public mass cytometry datasets using generalized anchors.
Lo YC, Keyes TJ, Jager A, Sarno J, Domizi P, Majeti R, Sakamoto KM, Lacayo N, Mullighan CG, Waters J, Sahaf B, Bendall SC, Davis KL. Lo YC, et al. Nat Commun. 2022 Feb 17;13(1):934. doi: 10.1038/s41467-022-28484-5. Nat Commun. 2022. PMID: 35177627 Free PMC article.
References
- Dziugaite G.K. et al. (2015). Training generative neural networks via maximum mean discrepancy optimization. Uncertainty in Artificial Intelligence-Proceedings of the 31st Conference. UAI 2015, 258–267.
- Glorot X., Bengio Y. (2010) Understanding the difficulty of training deep feedforward neural networks. In Proceedings of AISTATS, Sardinia, Italy, vol 9, pp. 249–256.
- Gretton A. et al. (2006) A kernel method for the two-sample-problem. Advances in Neural Information Processing Systems, 19, 513–520.
- Gretton A. et al. (2012) A kernel two-sample test. J. Mach. Learn. Res., 13, 723–773.
MeSH terms
LinkOut - more resources
Full Text Sources
Other Literature Sources
Medical
Molecular Biology Databases


