Comparing and validating methods of reading instruction using behavioural and neural findings in an artificial orthography - PubMed (original) (raw)
Comparing and validating methods of reading instruction using behavioural and neural findings in an artificial orthography
J S H Taylor et al. J Exp Psychol Gen. 2017 Jun.
Abstract
There is strong scientific consensus that emphasizing print-to-sound relationships is critical when learning to read alphabetic languages. Nevertheless, reading instruction varies across English-speaking countries, from intensive phonic training to multicuing environments that teach sound- and meaning-based strategies. We sought to understand the behavioral and neural consequences of these differences in relative emphasis. We taught 24 English-speaking adults to read 2 sets of 24 novel words (e.g., /buv/, /sig/), written in 2 different unfamiliar orthographies. Following pretraining on oral vocabulary, participants learned to read the novel words over 8 days. Training in 1 language was biased toward print-to-sound mappings while training in the other language was biased toward print-to-meaning mappings. Results showed striking benefits of print-sound training on reading aloud, generalization, and comprehension of single words. Univariate analyses of fMRI data collected at the end of training showed that print-meaning relative to print-sound relative training increased neural effort in dorsal pathway regions involved in reading aloud. Conversely, activity in ventral pathway brain regions involved in reading comprehension was no different following print-meaning versus print-sound training. Multivariate analyses validated our artificial language approach, showing high similarity between the spatial distribution of fMRI activity during artificial and English word reading. Our results suggest that early literacy education should focus on the systematicities present in print-to-sound relationships in alphabetic languages, rather than teaching meaning-based strategies, in order to enhance both reading aloud and comprehension of written words. (PsycINFO Database Record
(c) 2017 APA, all rights reserved).
Figures
Figure 1
Examples of stimuli used and illustration of how the learning focus manipulation was implemented. Note that this represents the experience of one participant as the assignment of orthography to spoken word set, noun set, and learning focus was counterbalanced across participants, as detailed in Appendix B. See the online article for the color version of this figure.
Figure 2
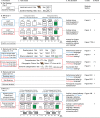
Overview of procedures, task details, key questions, data sets, and results for each part of the experiment. Column 1 gives an overview of each training procedure. Column 2 gives further details of the behavioral and MRI protocols. In rows B and E, which show the trial format and timing during MRI scans, dotted lines indicate correspondence between stimulus presentation and scan onset. Black outlined boxes show what participants were viewing, and what they were hearing, thinking, or saying is shown above each box. Column 3 delineates the key questions addressed by each part of the experiment, column 4 shows where the results can be found, and in column 5 ticks and crosses indicate whether each prediction was confirmed by the data. See the online article for the color version of this figure.
Figure 3
Accuracy and RTs in tasks that involved mapping between orthography and phonology for the O–P and O–S focus languages on each day and each session of training. All error bars in this and subsequent figures use standard error appropriate for within-participant designs (Loftus & Masson, 1994). Error bars are shown only for the first session on each day because only these data points were statistically compared. See the online article for the color version of this figure.
Figure 4
Accuracy and RTs in tasks that involved mapping between orthography and semantics for the O–P and O–S focus languages on each day and each session of training. Error bars are shown only for the first session on each day because only these data points were statistically compared. See the online article for the color version of this figure.
Figure 5
Replotting of data shown in the top left graphs of Figures 3 and 4 to illustrate how having completed relatively more O–P training sessions benefits saying the meanings (left panel), whereas having completed relatively more O–S training sessions does not benefit reading aloud (right panel). Graphs show the proportion of items correct in saying the meaning (left panel) and in reading aloud (right panel) the first eight times (after the initial scanning session) participants completed these tasks for the O–P and O–S focus languages. Joined up points indicate that sessions were completed on the same day, whereas separated points indicate that sessions were completed on different days. The information in the table that is connected to the graphs by gray lozenges shows how, when the number of times saying the meaning is equated, participants have received relatively more O–P training for the O–P than the O–S focus language (left panel). Conversely, when the number of times reading aloud is equated, participants have received relatively more O–S training for the O–S than the O–P focus language (right panel). See the online article for the color version of this figure.
Figure 6
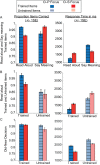
Accuracy and RTs in test tasks conducted at the end of behavioral training. (A) reading aloud and saying the meanings of trained items, (B) reading aloud trained and untrained items, (C) old-new decision. See the online article for the color version of this figure.
Figure 7
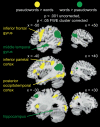
Brain regions that were more active during English pseudoword than word reading (yellow), or word than pseudoword reading (green). Left and right hemisphere slices show whole-brain activations at p < .001 voxelwise uncorrected and p < .05 FWE cluster-corrected for 20 participants.
Figure 8
Brain regions active when learning pronunciations (OP learning) and meanings (OS learning) of artificial orthographies in MRI Scan 1, prior to behavioral training. Left and right hemisphere slices show whole-brain activations at p < .001 voxelwise uncorrected and _p_ < .05 FWE cluster-corrected for 18 participants. Panel A shows the simple effect of see-hear > hear-only activity for OP (blue) and OS (red) learning, and the overlap between these (purple). Panel B shows the results of an ANOVA that included the factors learning type (OP vs. OS) and trial type (see-hear vs. hear-only). Slices show the main effect of learning type (pink: OS > OP, light blue: OP > OS) and the interaction between learning type and trial type that was driven by greater activation for see-hear relative to hear-only trials for OS than OP learning (red). Note that no brain regions showed more activation for OP than OS learning. Plots show activation for hear-only (HO) and see-hear (SH) trials for OP and OS learning at representative peak voxels that showed a main effect of learning type (pink boxes) or an interaction between learning and trial type (red box).
Figure 9
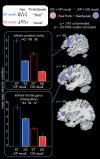
Brain regions showing differential activity when recalling pronunciations (OP recall) versus meanings (OS recall) of artificial orthographies, in MRI Scan 1, prior to behavioral training. Left hemisphere slices show the results of paired t tests between these two tasks (pink: OS > OP, light blue: OP > OS), collapsed across see-think (ST) and see-speak (SS) trials. Note that no brain regions showed greater activity when recalling meanings than pronunciations. Whole-brain activations are presented at p < .001 voxelwise uncorrected and p < .05 FWE cluster-corrected for 18 participants. Plots show activation for see-think and see-speak trials for OP and OS recall at representative peak voxels that showed greater activity for recalling pronunciations (OP) than meanings (OS).
Figure 10
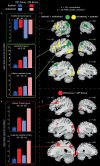
Brain activity during reading aloud in MRI Scan 2 at the end of training. Slices show main effects from an ANOVA that included the factors lexicality (trained vs. untrained) and training focus (OP vs. OS), which was conducted on activation during see-think trials, for items that were read aloud correctly. Whole-brain activations are presented at p < .001 voxelwise uncorrected and _p_ < .05 FWE cluster-corrected for 20 participants. (A) Slices show main effect of lexicality, green = trained > untrained, yellow = untrained > trained. (B) Slices show main effect of training focus, red = OS > OP focus. Note that no brain regions showed more activation for the OP than the OS focus language. Plots for A and B show see-think activation for trained (dark bars) and untrained items (light bars) for the OP (blue bars) and the OS (red bars) focus languages, at representative peak voxels that showed greater activity for trained than untrained items (green box), untrained than trained items (yellow box), or the OS relative to the OP focus language (red box).
Comment in
- The importance of correctly characterising the English spelling system when devising and evaluating methods of reading instruction: Comment on Taylor, Davis, and Rastle (2017).
Bowers JS, Bowers PN. Bowers JS, et al. Q J Exp Psychol (Hove). 2018 Jul;71(7):1497-1500. doi: 10.1177/1747021818759477. Epub 2018 May 9. Q J Exp Psychol (Hove). 2018. PMID: 29741459
Similar articles
- Print-sound regularities are more important than print-meaning regularities in the initial stages of learning to read: Response to Bowers & Bowers (2018).
Rastle K, Taylor JSH. Rastle K, et al. Q J Exp Psychol (Hove). 2018 Jul;71(7):1501-1505. doi: 10.1177/1747021818775053. Epub 2018 May 9. Q J Exp Psychol (Hove). 2018. PMID: 29741458 - Neural correlates of reading aloud on the autism spectrum.
McCabe C, Cahalan S, Pincus M, Rosenberg-Lee M, Graves WW. McCabe C, et al. Sci Rep. 2025 Mar 10;15(1):8240. doi: 10.1038/s41598-025-88903-7. Sci Rep. 2025. PMID: 40064934 Free PMC article. - Learning and retrieving holistic and componential visual-verbal associations in reading and object naming.
Quinn C, Taylor JSH, Davis MH. Quinn C, et al. Neuropsychologia. 2017 Apr;98:68-84. doi: 10.1016/j.neuropsychologia.2016.09.025. Epub 2016 Oct 6. Neuropsychologia. 2017. PMID: 27720949 Free PMC article. - Phonics training for English-speaking poor readers.
McArthur G, Sheehan Y, Badcock NA, Francis DA, Wang HC, Kohnen S, Banales E, Anandakumar T, Marinus E, Castles A. McArthur G, et al. Cochrane Database Syst Rev. 2018 Nov 14;11(11):CD009115. doi: 10.1002/14651858.CD009115.pub3. Cochrane Database Syst Rev. 2018. PMID: 30480759 Free PMC article. - The interface between spoken and written language: developmental disorders.
Hulme C, Snowling MJ. Hulme C, et al. Philos Trans R Soc Lond B Biol Sci. 2013 Dec 9;369(1634):20120395. doi: 10.1098/rstb.2012.0395. Print 2014. Philos Trans R Soc Lond B Biol Sci. 2013. PMID: 24324239 Free PMC article. Review.
Cited by
- Phonological and morphological literacy skills in English and Chinese: A cross-linguistic neuroimaging comparison of Chinese-English bilingual and monolingual English children.
Zhang K, Sun X, Yu CL, Eggleston RL, Marks RA, Nickerson N, Caruso VC, Hu XS, Tardif T, Chou TL, Booth JR, Kovelman I. Zhang K, et al. Hum Brain Mapp. 2023 Sep;44(13):4812-4829. doi: 10.1002/hbm.26419. Epub 2023 Jul 23. Hum Brain Mapp. 2023. PMID: 37483170 Free PMC article. - Evidence for cross-script abstract identities in learners of Japanese kana.
Schubert T, Gawthrop R, Kinoshita S. Schubert T, et al. Mem Cognit. 2018 Aug;46(6):1010-1021. doi: 10.3758/s13421-018-0818-4. Mem Cognit. 2018. PMID: 29736757 - The relationships between oral language and reading instruction: Evidence from a computational model of reading.
Chang YN, Taylor JSH, Rastle K, Monaghan P. Chang YN, et al. Cogn Psychol. 2020 Dec;123:101336. doi: 10.1016/j.cogpsych.2020.101336. Epub 2020 Aug 18. Cogn Psychol. 2020. PMID: 32823169 Free PMC article. - Neural Components of Reading Revealed by Distributed and Symbolic Computational Models.
Staples R, Graves WW. Staples R, et al. Neurobiol Lang (Camb). 2020;1(4):381-401. doi: 10.1162/nol_a_00018. Epub 2020 Oct 1. Neurobiol Lang (Camb). 2020. PMID: 36339637 Free PMC article. - Modelling individual differences in reading using an optimised MikeNet simulator: the impact of reading instruction.
Chang YN, Chang TJ, Lin WF, Kuo CE, Shi YT, Lee HW. Chang YN, et al. Front Hum Neurosci. 2024 Jun 21;18:1356483. doi: 10.3389/fnhum.2024.1356483. eCollection 2024. Front Hum Neurosci. 2024. PMID: 38974479 Free PMC article.
References
- Association of Teachers and Lecturers (2016). Phonics: Position statement. Retrieved from https://www.atl.org.uk/policy-and-campaigns/policy-posts/phonics
MeSH terms
LinkOut - more resources
Full Text Sources
Other Literature Sources

