Delay activity of specific prefrontal interneuron subtypes modulates memory-guided behavior - PubMed (original) (raw)
. 2017 Jun;20(6):854-863.
doi: 10.1038/nn.4554. Epub 2017 Apr 24.
Affiliations
- PMID: 28436982
- PMCID: PMC5554301
- DOI: 10.1038/nn.4554
Delay activity of specific prefrontal interneuron subtypes modulates memory-guided behavior
Tsukasa Kamigaki et al. Nat Neurosci. 2017 Jun.
Abstract
Memory-guided behavior requires maintenance of task-relevant information without sensory input, but the underlying circuit mechanism remains unclear. Calcium imaging in mice performing a delayed Go or No-Go task revealed robust delay activity in dorsomedial prefrontal cortex, with different pyramidal neurons signaling Go and No-Go action plans. Inhibiting pyramidal neurons by optogenetically activating somatostatin- or parvalbumin-positive interneurons, even transiently during the delay, impaired task performance, primarily by increasing inappropriate Go responses. In contrast, activating vasoactive intestinal peptide (VIP)-positive interneurons enhanced behavioral performance and neuronal action plan representation. Furthermore, while endogenous activity of somatostatin and parvalbumin neurons was strongly biased toward Go trials, VIP neurons were similarly active in Go and No-Go trials. Somatostatin or VIP neuron activation also impaired or enhanced performance, respectively, in a delayed two-alternative forced-choice task. Thus, dorsomedial prefrontal cortex is a crucial component of the short-term memory network, and activation of its VIP neurons improves memory retention.
Conflict of interest statement
Competing Financial Interests
The authors declare no competing financial interests.
Figures
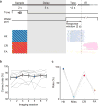
Figure 1. A delayed Go/No-Go auditory task and behavioral performance
(a) Top, schematic for task design. Bottom, licking behavior in an example session. Each tick indicates a lick (blue, Hit; magenta, CR; orange, FA). (b) Correct response rates (number of Hit and CR trials divided by the total number of trials) of all CaMKIIα-Cre mice (n = 9) across imaging sessions. Gray lines, individual mice; black, mean ± s.e.m. (c) Mean Hit, Miss, CR, and FA rates of all CaMKIIα-Cre mice. Hit + Miss = 100%; CR+FA = 100%.
Figure 2. Pyramidal neuron activity during the delayed Go/No-Go task
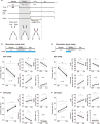
(a) Schematic of calcium imaging and field of view in an example session. Red outline indicates the example cell shown in (b). Dashed lines denote 300 and 600 μm from pia. Scale bar, 100 μm. (b) Raw fluorescence trace of the example ROI (outlined in (a)). For this cell, the delay activity was larger in Hit than CR trials (P = 1.5 × 10⁻²⁴, one-way ANOVA). Gray shading, delay period; blue/magenta stripes, sample periods with target/non-target tones. Dashed line, end of response window in CR trials. Black tick on top, lick response. Blue/orange arrowhead, delivery of reward/punishment. (c) Same as (b), but for a different cell from a different session, delay activity was larger in CR trials (P = 4.7 × 10⁻¹⁰). (d,e) Trial-averaged ΔF/F (z-scored) of the example ROIs shown in (b) and (c), respectively. Colored shading, ± s.e.m. (f,g) Other example significant Go-preferring (f) and NG-preferring cells (g). (h) Distribution of difference in z-scored ΔF/F during the delay period between Go and NG trials in all imaged pyramidal cells (n = 407). Blue/magenta, significant Go-preferring/NG-preferring cells. Red arrowhead, median. (i) Fraction of significant Go- and NG-preferring cells vs. distance from pia. Deep layers had higher fraction of significant NG-preferring cells (P = 3.7 × 10⁻¹⁴, one-way ANOVA). (j) Euclidean distance between Go and No-Go activities. Gray dashed trace, 95% confidence interval of shuffled data. (k) Behavioral performance (d′) was correlated with the Euclidean distance during the delay period across imaging sessions (R = 0.50, P = 0.0081, Pearson’s correlation coefficient, bootstrap). All colored shadings and error bars, ± s.e.m.
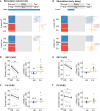
Figure 3. Optogenetic activation of dmPFC SST and PV neurons impaired behavioral performance
(a) Schematic of optogenetic stimulation during the whole trial (top) and an example session of SST neuron stimulation (bottom). Each tick indicates a lick (same as Fig. 1a). (b) SST neuron stimulation during the whole trial decreased behavioral performance (n = 8 mice; P = 0.0078, Wilcoxon signed-rank test), with a substantial increase in FA rate (P = 0.016) and a small decrease in Hit rate (P = 0.0078). Gray lines, individual mice; black, mean ± s.e.m. Circles, individual mice. (c) PV neuron stimulation also decreased the correct response rate (n = 7 mice, P = 0.031). (d) 2-s laser stimulation during the early delay period and an example session of SST neuron stimulation. (e,f) The early delay stimulation decreased the correct response rate (n = 7 SST-ChR2 mice, P = 0.016 (e), n = 10 PV-ChR2 mice, P = 0.027 (f)) with a substantial increase in FA rate. All error bars denote ± s.e.m.
Figure 4. VIP neuron activation improved behavioral performance
(a) Optogenetic activation of VIP neurons during the whole trial increased the correct response rate with a large reduction of FA rate and a small increase in Hit rate (n = 10 mice). (b) VIP neuron activation for 2 s during the early delay period also increased the correct response rate (n = 9 mice). All error bars denote ± s.e.m. **P = 0.0020; ***P = 0.00098; Wilcoxon signed-rank test.
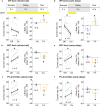
Figure 5. Behavioral effects of optogenetic silencing of VIP, SST, or PV neurons in the dmPFC
(a) Arch-mediated silencing of VIP neurons in the dmPFC during the whole trial decreased the correct response rate (P = 0.031, Wilcoxon signed-rank test) due primarily to an increase in the FA rate (P = 0.031) rather than the Hit rate (P = 0.16). (b) Arch-mediated inactivation of SST neurons (whole trial) increased the correct response rate (P = 0.031) due primarily to an increase in the FA rate (P = 0.031) rather than the Hit rate (P = 0.16). (c) Arch- or halorhodopsin (Halo)-mediated silencing of PV neurons increased the correct response rate (P = 0.031) due primarily to a decrease in FA rate (P = 0.031) but not in the Hit rate (P = 0.81). (d–f) same as (a–c), but silencing during the early delay period. Error bars denote ± s.e.m.
Figure 6. VIP neuron activation improved dmPFC coding of action plan
(a) Spiking activity of example significant Go-preferring (Cells 1 and 2) and NG-preferring cells (Cells 3 and 4) with or without VIP neuron activation. (b) Difference between Go and No-Go activity during the delay period in laser on vs. laser off trials, for significant Go-preferring (blue) and NG-preferring (magenta) neurons. The difference divided by their sum increased in Go-preferring cells (P = 1.1 × 10⁻⁹, paired t-test) and decreased in NG-preferring cells (P = 0.0030) with VIP neuron activation. (c) VIP neuron activation increased the Euclidean distance between Go and No-Go activities. The black horizontal bars on the top indicate the analysis periods including baseline (1 s before the beginning of sample), sample, delay, and post-delay (0.5 s after the end of delay) periods. The difference in the Euclidean distance was significant for all analysis periods except for the baseline period (P = 0.49; bootstrap). *P = 0.0060; **P = 0.0002; ***P = 0 (bootstrap); Shading and error bars, 95% confidence intervals (bootstrap).
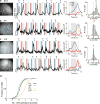
Figure 7. Calcium imaging from each interneuron subtype
(a) Left, Field of view in an example imaging session of SST cells. Brown outline indicates the example ROI shown in the middle panels; Middle, raw fluorescence trace and trial-averaged ΔF/F (z-scored) of the example ROI. The format is the same as Fig. 2b. Right, distribution of Go-NG preference during the delay period in all SST cells (n = 230). Scale bar, 100 μm. (b) Same as (a) but for PV cells (n = 387). (c) Same as (a) but for VIP cells (n = 406). The upper and lower panels show two example ROIs with significant Go- and NG-preferring activity, respectively. (d) Cumulative distribution of Go-NG preference in the three interneuron subtypes and pyramidal cells (Pyr).
Figure 8. Optogenetic activation of SST and VIP neurons during a delayed two-alternative forced choice (2-AFC) task
(a) Schematic for task design. (b) Schematic of optogenetic stimulation during the whole trial (top) and behavioral performance (bottom). Bilateral SST neuron stimulation during the whole trial decreased the correct rate (number of trials with correct responses divided by the total number of trials for each side) in both left and right trials, and increased the incorrect response rate but not the miss rate (n = 6 mice). (c) Bilateral VIP neuron stimulation during the whole trial increased the correct rate in both left and right trials, and decreased the incorrect response rate but not the miss rate (n = 6 mice). (d,e) Same as (b,c), but with 1-s laser stimulation during the early delay period. Gray lines, individual mice; black, mean ± s.e.m. *P = 0.031; Wilcoxon signed-rank test.
Comment in
- Working memory: The real VIP.
Dzirasa K. Dzirasa K. Sci Transl Med. 2017 May 10;9(389):eaan3779. doi: 10.1126/scitranslmed.aan3779. Sci Transl Med. 2017. PMID: 28490667 - Working memory: Keeping short-term memories alive.
Bray N. Bray N. Nat Rev Neurosci. 2017 Jun;18(6):324. doi: 10.1038/nrn.2017.60. Epub 2017 May 11. Nat Rev Neurosci. 2017. PMID: 28490777 No abstract available.
Similar articles
- Distinct Roles of Parvalbumin- and Somatostatin-Expressing Interneurons in Working Memory.
Kim D, Jeong H, Lee J, Ghim JW, Her ES, Lee SH, Jung MW. Kim D, et al. Neuron. 2016 Nov 23;92(4):902-915. doi: 10.1016/j.neuron.2016.09.023. Epub 2016 Oct 13. Neuron. 2016. PMID: 27746132 - Divisions of Identified Parvalbumin-Expressing Basket Cells during Working Memory-Guided Decision Making.
Lagler M, Ozdemir AT, Lagoun S, Malagon-Vina H, Borhegyi Z, Hauer R, Jelem A, Klausberger T. Lagler M, et al. Neuron. 2016 Sep 21;91(6):1390-1401. doi: 10.1016/j.neuron.2016.08.010. Epub 2016 Sep 1. Neuron. 2016. PMID: 27593181 - Cortical interneurons that specialize in disinhibitory control.
Pi HJ, Hangya B, Kvitsiani D, Sanders JI, Huang ZJ, Kepecs A. Pi HJ, et al. Nature. 2013 Nov 28;503(7477):521-4. doi: 10.1038/nature12676. Epub 2013 Oct 6. Nature. 2013. PMID: 24097352 Free PMC article. - Prefrontal GABAergic Interneurons Gate Long-Range Afferents to Regulate Prefrontal Cortex-Associated Complex Behaviors.
Yang SS, Mack NR, Shu Y, Gao WJ. Yang SS, et al. Front Neural Circuits. 2021 Jul 12;15:716408. doi: 10.3389/fncir.2021.716408. eCollection 2021. Front Neural Circuits. 2021. PMID: 34322002 Free PMC article. Review. - Dissecting executive control circuits with neuron types.
Kamigaki T. Kamigaki T. Neurosci Res. 2019 Apr;141:13-22. doi: 10.1016/j.neures.2018.07.004. Epub 2018 Aug 12. Neurosci Res. 2019. PMID: 30110598 Review.
Cited by
- Dorsomedial prefrontal cortex activation disrupts Pavlovian incentive motivation.
Halbout B, Hutson C, Wassum KM, Ostlund SB. Halbout B, et al. Front Behav Neurosci. 2022 Oct 13;16:999320. doi: 10.3389/fnbeh.2022.999320. eCollection 2022. Front Behav Neurosci. 2022. PMID: 36311857 Free PMC article. - The role of neuropeptide somatostatin in the brain and its application in treating neurological disorders.
Song YH, Yoon J, Lee SH. Song YH, et al. Exp Mol Med. 2021 Mar;53(3):328-338. doi: 10.1038/s12276-021-00580-4. Epub 2021 Mar 19. Exp Mol Med. 2021. PMID: 33742131 Free PMC article. Review. - Cortical VIP+ Interneurons in the Upper and Deeper Layers Are Transcriptionally Distinct.
Wu J, Zhao Z, Shi Y, He M. Wu J, et al. J Mol Neurosci. 2022 Aug;72(8):1779-1795. doi: 10.1007/s12031-022-02040-8. Epub 2022 Jun 16. J Mol Neurosci. 2022. PMID: 35708842 - VIP Interneurons Contribute to Avoidance Behavior by Regulating Information Flow across Hippocampal-Prefrontal Networks.
Lee AT, Cunniff MM, See JZ, Wilke SA, Luongo FJ, Ellwood IT, Ponnavolu S, Sohal VS. Lee AT, et al. Neuron. 2019 Jun 19;102(6):1223-1234.e4. doi: 10.1016/j.neuron.2019.04.001. Epub 2019 Apr 30. Neuron. 2019. PMID: 31053407 Free PMC article. - The Anterior Cingulate Cortex Promotes Long-Term Auditory Cortical Responses through an Indirect Pathway via the Rhinal Cortex in Mice.
Liang Y, Li J, Tian Y, Tang P, Liu C, Chen X. Liang Y, et al. J Neurosci. 2023 Jun 7;43(23):4262-4278. doi: 10.1523/JNEUROSCI.2252-22.2023. Epub 2023 May 9. J Neurosci. 2023. PMID: 37160368 Free PMC article.
References
- Baddeley AD. Working memory. Clarendon Press; Oxford University Press; 1986.
- Fuster JM. The prefrontal cortex. Academic Press/Elsevier; 2008.
- Miller EK, Cohen JD. An integrative theory of prefrontal cortex function. Annual review of neuroscience. 2001;24:167–202. - PubMed
- Bauer RH, Fuster JM. Delayed-matching and delayed-response deficit from cooling dorsolateral prefrontal cortex in monkeys. Journal of comparative and physiological psychology. 1976;90:293–302. - PubMed
- Buckley MJ, et al. Dissociable components of rule-guided behavior depend on distinct medial and prefrontal regions. Science. 2009;325:52–58. - PubMed
MeSH terms
Substances
LinkOut - more resources
Full Text Sources
Other Literature Sources
Molecular Biology Databases
