Bilirubin Decreases Macrophage Cholesterol Efflux and ATP-Binding Cassette Transporter A1 Protein Expression - PubMed (original) (raw)
Bilirubin Decreases Macrophage Cholesterol Efflux and ATP-Binding Cassette Transporter A1 Protein Expression
Dongdong Wang et al. J Am Heart Assoc. 2017.
Abstract
Background: Mild but chronically elevated circulating unconjugated bilirubin is associated with reduced total and low-density lipoprotein cholesterol concentration, which is associated with reduced cardiovascular disease risk. We aimed to investigate whether unconjugated bilirubin influences macrophage cholesterol efflux, as a potential mechanism for the altered circulating lipoprotein concentrations observed in hyperbilirubinemic individuals.
Methods and results: Cholesterol efflux from THP-1 macrophages was assessed using plasma obtained from normo- and hyperbilirubinemic (Gilbert syndrome) humans (n=60 per group) or (heterozygote/homozygote Gunn) rats (n=20 per group) as an acceptor. Hyperbilirubinemic plasma from patients with Gilbert syndrome and Gunn rats induced significantly reduced cholesterol efflux compared with normobilirubinemic plasma. Unconjugated bilirubin (3-17.1 μmol/L) exogenously added to plasma- or apolipoprotein A1-supplemented media also decreased macrophage cholesterol efflux in a concentration- and time-dependent manner. We also showed reduced protein expression of the ATP-binding cassette transporter A1 (ABCA1), a transmembrane cholesterol transporter involved in apolipoprotein A1-mediated cholesterol efflux, in THP-1 macrophages treated with unconjugated bilirubin and in peripheral blood mononuclear cells obtained from hyperbilirubinemic individuals. Furthermore, we demonstrated that bilirubin accelerates the degradation rate of the ABCA1 protein in THP-1 macrophages.
Conclusions: Cholesterol efflux from THP-1 macrophages is decreased in the presence of plasma obtained from humans and rats with mild hyperbilirubinemia. A direct effect of unconjugated bilirubin on cholesterol efflux was demonstrated and is associated with decreased ABCA1 protein expression. These data improve our knowledge concerning bilirubin's impact on cholesterol transport and represent an important advancement in our understanding of bilirubin's role in cardiovascular disease.
Keywords: ATP‐binding cassette transporter; bilirubin; cardiovascular disease; cholesterol; cholesterol homeostasis.
© 2017 The Authors. Published on behalf of the American Heart Association, Inc., by Wiley.
Figures
Figure 1
Plasma cholesterol efflux capacity is impaired in the presence of human (A) and rat (B) plasma with high unconjugated bilirubin.
THP
‐1 cells were differentiated for 72 hours with 200 nmol/L phorbol‐12‐myristate‐13‐acetate and then loaded with unlabeled cholesterol and radioactive cholesterol tracer ([3H]‐cholesterol) for another 24 hours. Cells were then incubated with fresh serum‐free medium containing (A) human plasma (3%, vol/vol) from Gilbert syndrome patients or control participants (n=60 per group), or (B) rat plasma (3%, vol/vol) from Gunn or Wistar rats (n=20 per group) for 4 hours, and cholesterol efflux was determined. Values are mean±SEM. All cholesterol efflux experiments were performed in triplicate for each sample. **P<, 0.01,***P<0.001 vs the control participants or Wistar rats group (determined by paired t test).
Figure 2
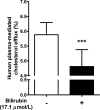
Bilirubin added to normobilirubinemic plasma inhibits cholesterol efflux (n=12).
THP
‐1 cells were differentiated and loaded as described in Figure 1. Cells were then incubated with fresh serum‐free medium containing human normobilirubinemic plasma (3%, vol/vol) in the absence or presence of bilirubin (17.1 μmol/L) for 4 hours, and cholesterol efflux was determined. Values are mean±SD. ***P<0.001 vs the nontreated group (determined by paired t test).
Figure 3
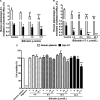
Bilirubin inhibits human plasma‐/apolipoprotein (apo) A1–mediated cholesterol efflux concentration‐ and time‐dependently. A,
THP
‐1 cells were differentiated and loaded as described in Figure 1. Cells were then incubated with fresh serum‐free medium containing human plasma (3%, vol/vol) or apo A1 (10 μg/mL) in the presence of different concentrations of bilirubin (3, 10, and 17.1 μmol/L) for 4 hours, and cholesterol efflux was determined. Control was treated with solvent vehicle (0.1% dimethyl sulfoxide [DMSO]). B,
THP
‐1 cells were differentiated and loaded as described in Figure 1. Differentiated cells were incubated with bilirubin (17.1 μmol/L) for 4, 8, 16, and 24 hours. Cells were then incubated with fresh serum‐free medium containing human plasma (3%, vol/vol) or apo A1 (10 μg/mL) for 4 hours, and cholesterol efflux was determined. Control was treated with solvent vehicle (0.1%
DMSO
). C, Cell viability was determined in the presence of different concentrations of bilirubin for different incubation times.
THP
‐1 cells were differentiated as described in Figure 1 and then loaded with unlabeled cholesterol for 24 hours. Cells were treated with increasing concentrations of bilirubin (1–17.1 μmol/L) for 4, 8, 16, and 24 hours. The viability was assessed by the resazurin reduction assay. Solvent vehicle treatment (0.1%
DMSO
) was used as a negative control. The cytotoxic natural product digitonin (50 μg/mL, 4 hours) was used as a positive control. The bar graphs present mean±
SD
from 3 independent experiments. *P<0.05, **P<0.01, and ***P<0.001 vs control (determined by
ANOVA
with Bonferroni post hoc test).
Figure 4
Cellular integrity determined in the presence of different concentrations of bilirubin at different incubation times.
THP
‐1 cells were differentiated for 72 hours with 200 nmol/L phorbol‐12‐myristate‐13‐acetate and then loaded with unlabeled cholesterol for further 24 hours. Cells were treated with increasing concentrations of bilirubin (1–17.1 μmol/L) for 4, 8, 16, and 24 hours. Cellular integrity was assessed by the Trypan blue exclusion test. Solvent vehicle treatment (0.1% dimethyl sulfoxide [DMSO]) was used as a negative control. The bar graphs present mean±
SD
from 3 independent experiments. *P<0.05, and **P<0.01 vs solvent vehicle control (determined by
ANOVA
with Bonferroni post hoc test).
Figure 5
Exposure of
THP
‐1 macrophages to bilirubin reduces cholesterol efflux, even after bilirubin removal. A, Human plasma as extracellular acceptor and (B) apo A1 as extracellular acceptor.
THP
‐1 cells were differentiated and loaded as described in Figure 1. For pretreatment, differentiated cells were treated with bilirubin (17.1 μmol/L) for 4 hours and then incubated with fresh serum‐free medium containing human plasma (3%, vol/vol) or apolipoprotein A1 (apo A1; 10 μg/mL) for an additional 4 hours, and cholesterol efflux was determined. For cotreatment, differentiated cells were incubated with fresh serum‐free medium for 4 hours and then incubated with fresh serum‐free medium containing human plasma (3%, vol/vol) or apo A1 (10 μg/mL) in the presence of bilirubin (17.1 μmol/L) for additional 4 hours and cholesterol efflux was determined. Control was treated with solvent vehicle (0.1% dimethyl sulfoxide). The bar graphs present mean±
SD
from 3 independent experiments. *P<0.05 and **P<0.01 vs control. ns indicates not significant (determined by
ANOVA
with Bonferroni post hoc test).
Figure 6
The effect of bilirubin on cholesterol efflux needs human plasma or apolipoprotein A1 (apo A1) as acceptor. A, Bilirubin did not decrease basal cholesterol efflux significantly.
THP
‐1 cells were differentiated and loaded as described in Figure 1. Differentiated cells were incubated with bilirubin (17.1 μmol/L) for 4 hours in the absence of extracellular acceptors, and cholesterol efflux was determined. Control was treated with solvent vehicle (0.1% dimethyl sulfoxide [
DMSO
]). B and C, The bilirubin‐induced decrease of cholesterol efflux mediated by (B) human plasma or (C) apo A1 is not different before and after correction for bilirubin's inhibition of basal cholesterol efflux.
THP
‐1 cells were differentiated and loaded as described in Figure 1. Cells were then incubated with fresh serum‐free medium containing human plasma (3%, vol/vol) or apo A1 (10 μg/mL) in the presence of bilirubin (17.1 μmol/L) for 4 hours, and cholesterol efflux was determined. Control was treated with solvent vehicle (0.1%
DMSO
). The bilirubin‐induced decrease of cholesterol efflux was corrected for bilirubin's inhibition of basal cholesterol efflux. The bar graphs present mean±
SD
from 3 independent experiments. *P<0.05 and **P<0.01 vs control. ns indicates not significant (determined by Student t test).
Figure 7
Expression of ATP‐binding cassette transporter A1 (
ABCA
- protein in
THP
‐1 macrophages treated with bilirubin and in peripheral blood mononuclear cells (
PBMC
s) from Gilbert syndrome (GS) patients. A, Bilirubin suppresses the expression of
ABCA
1 protein in
THP
‐1‐derived macrophages time‐dependently.
THP
‐1 cells were differentiated as described in Figure 1 and then loaded with unlabeled cholesterol for another 24 hours. Cells were treated with bilirubin (17.1 μmol/L) for 4, 8, 16, and 24 hours. The protein levels of
ABCA
1 were detected by western blotting. Control was treated with solvent vehicle (0.1% dimethyl sulfoxide). The bar graph presents mean±
SD
from 3 independent experiments. B, Expression of
ABCA
1 protein is decreased in
PBMC
s from participants with high bilirubin blood levels (
GS
) compared with healthy controls. The protein levels of
ABCA
1 were detected by western blotting. The bar graph presents mean±
SEM
(n=28 per group). *P<0.05, **P<0.01 and ***P<0.001 vs control. ns indicates not significant (determined by Student t test).
Figure 8
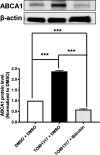
Bilirubin significantly decreases expression of ATP‐binding cassette transporter A1 (
ABCA
- protein in
THP
‐1 macrophages treated with
LXR
agonist (
TO
- to upregulate
ABCA
1 protein.
THP
‐1 cells were differentiated for 72 hours with 200 nmol/L phorbol‐12‐myristate‐13‐acetate and then loaded with unlabeled cholesterol for another 24 hours. Cells were treated with
TO
901317 (5 μmol/L) or solvent vehicle (0.1% dimethyl sulfoxide [DMSO]) for 24 hours. Afterward, cells were treated with bilirubin (17.1 μmol/L) or solvent vehicle (0.1%
DMSO
) for 16 hours. The protein levels of
ABCA
1 were detected by western blot analysis. The bar graphs present mean±
SD
from 3 independent experiments. ***P<0.001 vs control (determined by
ANOVA
with Bonferroni post hoc test).
Figure 9
Expression of ATP‐binding cassette transporter G1 (
ABCG
- protein in
THP
‐1 macrophages treated with bilirubin and in peripheral blood mononuclear cells (
PBMC
s) from Gilbert syndrome (
GS
) patients. A, Bilirubin suppresses the expression of
ABCG
1 protein in
THP
‐1‐derived macrophages.
THP
‐1 cells were differentiated for 72 hours with 200 nmol/L phorbol‐12‐myristate‐13‐acetate and then loaded with unlabeled cholesterol for another 24 hours. Cells were treated with bilirubin (17.1 μmol/L) for 4, 8, 16, and 24 hours. The protein levels of
ABCG
1 were detected by western blotting. Control was treated with solvent vehicle (0.1% dimethyl sulfoxide). The bar graphs present mean±
SD
from 3 independent experiments. B, Expression of
ABCG
1 protein was not changed significantly in
PBMC
s from participants with high bilirubin blood levels (
GS
) compared with healthy controls. The protein levels of
ABCG
1 were detected by western blotting. The bar graphs present mean±
SEM
(n=28 per group). *P<0.05 vs control. ns indicates not significant (determined by Student t test).
Figure 10
A, Bilirubin enhances the degradation rate of
ABCA
1 protein in
THP
‐1 macrophages.
THP
‐1 cells were differentiated as described in Figure 1 and then loaded with unlabeled cholesterol for another 24 hours. Cells were treated with bilirubin (17.1 μmol/L) for 8 hours. The control was treated with solvent vehicle (0.1% dimethyl sulfoxide) for 8 hours. Cells were lysed after treatment with the protein synthesis inhibitor cycloheximide (140 μmol/L) at different time points (0, 10, 20, 40, 60, and 80 minutes). The protein levels of ATP‐binding cassette transporter A1 (
ABCA
- were detected by western blot analysis. The data points present mean±
SD
from 3 independent experiments. *P<0.05 and **P<0.01 vs control at the same time points (determined by Student t test). B and C, Bilirubin does not have a significant effect on
mRNA
levels of
ABCA
1 and ATP‐binding cassette transporter G1 (
ABCG
- in
THP
‐1 macrophages.
THP
‐1 cells were differentiated as described in Figure 1 and then loaded with unlabeled cholesterol for another 24 hours. Cells were treated with bilirubin (3, 10, or 17.1 μmol/L) for 24 hours. The control was treated with solvent vehicle (0.1% dimethyl sulfoxide) for 24 hours. The
LXR
agonist
TO
901317 (5 μmol/L) was used as a positive control. The
mRNA
levels of
ABCA
1 and
ABCG
1 were detected by quantitative polymerase chain reaction. Bar graphs present mean±
SD
from 3 independent experiments. ***P<0.001 vs control (determined by
ANOVA
with Bonferroni post hoc test). ns indicates not significant.
Figure 11
There is no significant difference in expression of ATP‐binding cassette transporter A1 (
ABCA
- protein between liver tissues from Gunn rats and Wistar rats. The protein levels of
ABCA
1 were detected by western blotting. The bar graphs present mean±
SD
(n=20 per group). ns indicates not significant (determined by Mann–Whitney U test). ns indicates not significant.
Similar articles
- Vitamin D Protects Against Atherosclerosis via Regulation of Cholesterol Efflux and Macrophage Polarization in Hypercholesterolemic Swine.
Yin K, You Y, Swier V, Tang L, Radwan MM, Pandya AN, Agrawal DK. Yin K, et al. Arterioscler Thromb Vasc Biol. 2015 Nov;35(11):2432-42. doi: 10.1161/ATVBAHA.115.306132. Epub 2015 Sep 17. Arterioscler Thromb Vasc Biol. 2015. PMID: 26381871 Free PMC article. - Statin-induced decrease in ATP-binding cassette transporter A1 expression via microRNA33 induction may counteract cholesterol efflux to high-density lipoprotein.
Niesor EJ, Schwartz GG, Perez A, Stauffer A, Durrwell A, Bucklar-Suchankova G, Benghozi R, Abt M, Kallend D. Niesor EJ, et al. Cardiovasc Drugs Ther. 2015 Feb;29(1):7-14. doi: 10.1007/s10557-015-6570-0. Cardiovasc Drugs Ther. 2015. PMID: 25749868 - Oxidized LDL upregulated ATP binding cassette transporter-1 in THP-1 macrophages.
Tang CK, Yi GH, Yang JH, Liu LS, Wang Z, Ruan CG, Yang YZ. Tang CK, et al. Acta Pharmacol Sin. 2004 May;25(5):581-6. Acta Pharmacol Sin. 2004. PMID: 15132822 - The roles of ATP-binding cassette transporter A1 and its substrate cholesterol in head and neck cancers.
Sanli F, Karatas OF. Sanli F, et al. Cell Biol Int. 2023 Jul;47(7):1151-1160. doi: 10.1002/cbin.12016. Epub 2023 Mar 19. Cell Biol Int. 2023. PMID: 36934420 Review. - Bilirubin as a metabolic hormone: the physiological relevance of low levels.
Creeden JF, Gordon DM, Stec DE, Hinds TD Jr. Creeden JF, et al. Am J Physiol Endocrinol Metab. 2021 Feb 1;320(2):E191-E207. doi: 10.1152/ajpendo.00405.2020. Epub 2020 Dec 7. Am J Physiol Endocrinol Metab. 2021. PMID: 33284088 Free PMC article. Review.
Cited by
- The Forty-Sixth Euro Congress on Drug Synthesis and Analysis: Snapshot †.
Mucaji P, Atanasov AG, Bak A, Kozik V, Sieron K, Olsen M, Pan W, Liu Y, Hu S, Lan J, Haider N, Musiol R, Vanco J, Diederich M, Ji S, Zitko J, Wang D, Agbaba D, Nikolic K, Oljacic S, Vucicevic J, Jezova D, Tsantili-Kakoulidou A, Tsopelas F, Giaginis C, Kowalska T, Sajewicz M, Silberring J, Mielczarek P, Smoluch M, Jendrzejewska I, Polanski J, Jampilek J. Mucaji P, et al. Molecules. 2017 Oct 28;22(11):1848. doi: 10.3390/molecules22111848. Molecules. 2017. PMID: 29143778 Free PMC article. - Heme-oxygenase and lipid mediators in obesity and associated cardiometabolic diseases: Therapeutic implications.
McClung JA, Levy L, Garcia V, Stec DE, Peterson SJ, Abraham NG. McClung JA, et al. Pharmacol Ther. 2022 Mar;231:107975. doi: 10.1016/j.pharmthera.2021.107975. Epub 2021 Sep 6. Pharmacol Ther. 2022. PMID: 34499923 Free PMC article. Review. - Heme Oxygenase Dependent Bilirubin Generation in Vascular Cells: A Role in Preventing Endothelial Dysfunction in Local Tissue Microenvironment?
Nitti M, Furfaro AL, Mann GE. Nitti M, et al. Front Physiol. 2020 Jan 29;11:23. doi: 10.3389/fphys.2020.00023. eCollection 2020. Front Physiol. 2020. PMID: 32082188 Free PMC article. Review. - Establishment of a Predictive Model for Poor Prognosis of Incomplete Revascularization in Patients with Coronary Heart Disease and Multivessel Disease.
Lian H, Zhao Z, Ma K, Ding Z, Sun L, Zhang Y. Lian H, et al. Clin Appl Thromb Hemost. 2022 Jan-Dec;28:10760296221139258. doi: 10.1177/10760296221139258. Clin Appl Thromb Hemost. 2022. PMID: 36573034 Free PMC article. - Bilirubin Safeguards Cardiorenal and Metabolic Diseases: a Protective Role in Health.
Hinds TD Jr, Stec DE. Hinds TD Jr, et al. Curr Hypertens Rep. 2019 Oct 10;21(11):87. doi: 10.1007/s11906-019-0994-z. Curr Hypertens Rep. 2019. PMID: 31599366 Free PMC article. Review.
References
- Mayer M. Association of serum bilirubin concentration with risk of coronary artery disease. Clin Chem. 2000;46:1723–1727. - PubMed
- Bulmer AC, Verkade HJ, Wagner KH. Bilirubin and beyond: a review of lipid status in Gilbert's syndrome and its relevance to cardiovascular disease protection. Prog Lipid Res. 2013;52:193–205. - PubMed
- Schwertner HA, Jackson WG, Tolan G. Association of low serum concentration of bilirubin with increased risk of coronary artery disease. Clin Chem. 1994;40:18–23. - PubMed
- Akboga MK, Canpolat U, Sahinarslan A, Alsancak Y, Nurkoc S, Aras D, Aydogdu S, Abaci A. Association of serum total bilirubin level with severity of coronary atherosclerosis is linked to systemic inflammation. Atherosclerosis. 2015;240:110–114. - PubMed
- Djousse L, Levy D, Cupples LA, Evans JC, D'Agostino RB, Ellison RC. Total serum bilirubin and risk of cardiovascular disease in the Framingham Offspring Study. Am J Cardiol. 2001;87:1196–1200; A4, 7. - PubMed
MeSH terms
Substances
LinkOut - more resources
Full Text Sources
Other Literature Sources
Medical
Miscellaneous


