Clonal hematopoiesis, with and without candidate driver mutations, is common in the elderly - PubMed (original) (raw)
. 2017 Aug 10;130(6):742-752.
doi: 10.1182/blood-2017-02-769869. Epub 2017 May 8.
Simon N Stacey 1, Gudmundur L Norddahl 1, Michael L Frigge 1, Olafur T Magnusson 1, Ingileif Jonsdottir 1 2 3, Thorgeir E Thorgeirsson 1, Asgeir Sigurdsson 1, Sigurjon A Gudjonsson 1, Julius Gudmundsson 1, Jon G Jonasson 2 3 4, Laufey Tryggvadottir 4, Thorvaldur Jonsson 2 3, Agnar Helgason 1 5, Arnaldur Gylfason 1, Patrick Sulem 1, Thorunn Rafnar 1, Unnur Thorsteinsdottir 1 3, Daniel F Gudbjartsson 1 6, Gisli Masson 1, Augustine Kong 1, Kari Stefansson 1 3
Affiliations
- PMID: 28483762
- PMCID: PMC5553576
- DOI: 10.1182/blood-2017-02-769869
Clonal hematopoiesis, with and without candidate driver mutations, is common in the elderly
Florian Zink et al. Blood. 2017.
Abstract
Clonal hematopoiesis (CH) arises when a substantial proportion of mature blood cells is derived from a single dominant hematopoietic stem cell lineage. Somatic mutations in candidate driver (CD) genes are thought to be responsible for at least some cases of CH. Using whole-genome sequencing of 11 262 Icelanders, we found 1403 cases of CH by using barcodes of mosaic somatic mutations in peripheral blood, whether or not they have a mutation in a CD gene. We find that CH is very common in the elderly, trending toward inevitability. We show that somatic mutations in TET2, DNMT3A, ASXL1, and PPM1D are associated with CH at high significance. However, known CD mutations were evident in only a fraction of CH cases. Nevertheless, the highly prevalent CH we detect associates with increased mortality rates, risk for hematological malignancy, smoking behavior, telomere length, Y-chromosome loss, and other phenotypic characteristics. Modeling suggests some CH cases could arise in the absence of CD mutations as a result of neutral drift acting on a small population of active hematopoietic stem cells. Finally, we find a germline deletion in intron 3 of the telomerase reverse transcriptase (TERT) gene that predisposes to CH (rs34002450; P = 7.4 × 10⁻¹²; odds ratio, 1.37).
© 2017 by The American Society of Hematology.
Conflict of interest statement
Conflict-of-interest disclosure: All deCODE authors are employees of the biotechnology company deCODE genetics/AMGEN.
Figures
Figure 1.
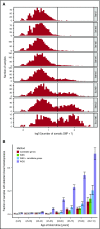
Age distribution of clonal hematopoiesis detected by WGS-outlier status. (A) Histograms showing the number of mosaic somatic mutations per person stratified by their age at blood sampling (adjusted as described in the supplemental Data). The vertical line shows the cutoff at 20 mosaic somatic mutations (corresponding to the 99.5% quantile of the distribution for ages younger than 35 years) that was used to classify individuals as WGS-outliers. (B) Prevalence of clonal hematopoiesis and CD mutations stratified by age class. Lavender bar, the fraction of samples classified as WGS-outliers; red bar, the fraction of samples with detected CD mutations from the 18-gene candidate list; green bar, the fraction of samples detected as outliers, using exon-restricted analysis; blue bar, combined fraction of samples detected with CD mutation or exon-restricted analysis. Error bars indicate 95% confidence intervals.
Figure 2.
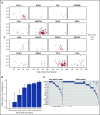
Presence of candidate driver (CD) mutations by age. (A) VAF vs age at blood draw for the 16 CD genes where mutations were detected. The 177 subjects who were classified as WGS-outliers are plotted as blue points, and the 69 subjects who were not outliers are plotted as red points. (B) Conditional probability of being identified as a WGS-outlier given that a CD mutation was detected, stratified by age bins. P = 1.9 × 10⁻¹²; β = 0.10, assessed by logistic regression. Error bars indicate 95% confidence intervals. (C) Co-mutation plot for WGS-outliers and nonoutliers in whom CD mutations were detected. Each column represents a subject, each row a candidate pre-leukemic driver gene. Cells are shaded if a mutation was detected, and the color of the shading indicates the number of mutations detected for the particular gene. The vertical black line separates non–WGS-outlier from WGS-outlier subjects.
Figure 3.
Survival analysis using Cox proportional hazard model. Baseline was defined as subjects who were neither WGS-outliers nor carriers of a mosaic somatic CD mutation. Plots show HRs with 95% confidence intervals. (A) HRs for all-cause mortality adjusted for age at blood draw, year of birth, sex, previous diagnoses of cancer, and smoking. (B) HRs for subsequent hematological malignancy adjusted for age at blood draw and year of birth. Details of the subjects who developed hematological malignancies are shown in supplemental Table 6.
Figure 4.
Computer simulation of clonal hematopoiesis arising under neutral drift. The graph shows the proportion of simulations producing more than 20 observable mosaic somatic mutations with a VAF less than 0.2 as a function of subject age, for different choices of N, the size of the active HSC compartment. The value of p, the probability that an HSC division will produce 2 daughter stem cells, was set at 0.25. Other parameters were fixed at λ = 1 division per 40 weeks, mutation rate µ = 6.4 × 10⁻¹⁰ per base pair per division.
Figure 5.
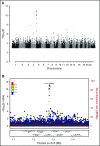
Genome-wide association for germline variants associated with clonal hematopoiesis detected by WGS-outlier status. (A) Manhattan plot of association [expressed as –log10(P)] with WGS-outlier status, determined using logistic regression. (B) Locus zoom of the signal in the TERT gene on chromosome 5. The location of the 8-bp indel rs34002450 (chr5:1280825) giving the strongest signal is indicated by a purple diamond. Other variants are plotted in colors corresponding to their _r_2 values relative to rs34002450, as indicated in the legend. Recombination rates, in cM/Mb and based on Icelandic data, are plotted as a red line. The lower panel shows the locations of RefSeq genes and the chromosomal position (GRCh38/hg38).
Comment in
- Prevalent premalignancy.
Sperling AS, Ebert BL. Sperling AS, et al. Blood. 2017 Aug 10;130(6):695-696. doi: 10.1182/blood-2017-05-786210. Blood. 2017. PMID: 28798057 No abstract available.
Similar articles
- Clonal Hematopoiesis and Therapy-Related Myeloid Neoplasms After Autologous Transplant for Hodgkin Lymphoma.
Yan C, Richard MA, Gibson CJ, He J, Bosworth A, Crossman DK, Singh P, Hageman L, Kalra R, Armenian SH, Vose J, Weisdorf DJ, Ebert BL, Yasui Y, Forman SJ, Bhatia R, Bhatia S. Yan C, et al. J Clin Oncol. 2024 Jul 10;42(20):2415-2424. doi: 10.1200/JCO.23.02547. Epub 2024 Apr 18. J Clin Oncol. 2024. PMID: 38635938 - CRISPR-Mediated Gene Editing to Assess the Roles of Tet2 and Dnmt3a in Clonal Hematopoiesis and Cardiovascular Disease.
Sano S, Oshima K, Wang Y, Katanasaka Y, Sano M, Walsh K. Sano S, et al. Circ Res. 2018 Jul 20;123(3):335-341. doi: 10.1161/CIRCRESAHA.118.313225. Epub 2018 May 4. Circ Res. 2018. PMID: 29728415 Free PMC article. - DNMT3A and TET2 dominate clonal hematopoiesis and demonstrate benign phenotypes and different genetic predispositions.
Buscarlet M, Provost S, Zada YF, Barhdadi A, Bourgoin V, Lépine G, Mollica L, Szuber N, Dubé MP, Busque L. Buscarlet M, et al. Blood. 2017 Aug 10;130(6):753-762. doi: 10.1182/blood-2017-04-777029. Epub 2017 Jun 27. Blood. 2017. PMID: 28655780 - [Clonal haematopoiesis: A concise review].
Danlos FX, Papo M, Micol JB. Danlos FX, et al. Rev Med Interne. 2019 Oct;40(10):684-692. doi: 10.1016/j.revmed.2019.05.005. Epub 2019 May 22. Rev Med Interne. 2019. PMID: 31126662 Review. French. - Clonal hematopoiesis: Genes and underlying mechanisms in cardiovascular disease development.
Haybar H, Shahrabi S, Ghanavat M, Khodadi E. Haybar H, et al. J Cell Physiol. 2019 Jun;234(6):8396-8401. doi: 10.1002/jcp.27752. Epub 2018 Nov 11. J Cell Physiol. 2019. PMID: 30417440 Review.
Cited by
- Hand in hand: intrinsic and extrinsic drivers of aging and clonal hematopoiesis.
SanMiguel JM, Young K, Trowbridge JJ. SanMiguel JM, et al. Exp Hematol. 2020 Nov;91:1-9. doi: 10.1016/j.exphem.2020.09.197. Epub 2020 Sep 28. Exp Hematol. 2020. PMID: 32991978 Free PMC article. Review. - High-risk and silent clonal hematopoietic genotypes in patients with nonhematologic cancer.
Stonestrom AJ, Menghrajani KN, Devlin SM, Franch-Expósito S, Ptashkin RN, Patel SY, Spitzer B, Wu X, Jee J, Sánchez Vela P, Milbank JH, Shah RH, Mohanty AS, Brannon AR, Xiao W, Berger MF, Mantha S, Levine RL. Stonestrom AJ, et al. Blood Adv. 2024 Feb 27;8(4):846-856. doi: 10.1182/bloodadvances.2023011262. Blood Adv. 2024. PMID: 38147626 Free PMC article. - Physical activity, a modulator of aging through effects on telomere biology.
Semeraro MD, Smith C, Kaiser M, Levinger I, Duque G, Gruber HJ, Herrmann M. Semeraro MD, et al. Aging (Albany NY). 2020 Jun 23;12(13):13803-13823. doi: 10.18632/aging.103504. Epub 2020 Jun 23. Aging (Albany NY). 2020. PMID: 32575077 Free PMC article. Review. - Factors associated with clonal hematopoiesis and interaction with marrow environment.
Nannya Y. Nannya Y. J Bone Miner Metab. 2023 May;41(3):380-387. doi: 10.1007/s00774-022-01380-0. Epub 2022 Nov 8. J Bone Miner Metab. 2023. PMID: 36346484 Review. - Immuno-cardio-oncology: Killing two birds with one stone?
Van Linthout S, Volk HD. Van Linthout S, et al. Front Immunol. 2022 Nov 17;13:1018772. doi: 10.3389/fimmu.2022.1018772. eCollection 2022. Front Immunol. 2022. PMID: 36466820 Free PMC article. Review.
References
- Busque L, Mio R, Mattioli J, et al. . Nonrandom X-inactivation patterns in normal females: lyonization ratios vary with age. Blood. 1996;88(1):59-65. - PubMed
- Fey MF, Liechti-Gallati S, von Rohr A, et al. . Clonality and X-inactivation patterns in hematopoietic cell populations detected by the highly informative M27 beta DNA probe. Blood. 1994;83(4):931-938. - PubMed
- Gale RE, Wheadon H, Linch DC. X-chromosome inactivation patterns using HPRT and PGK polymorphisms in haematologically normal and post-chemotherapy females. Br J Haematol. 1991;79(2):193-197. - PubMed
- Champion KM, Gilbert JG, Asimakopoulos FA, Hinshelwood S, Green AR. Clonal haemopoiesis in normal elderly women: implications for the myeloproliferative disorders and myelodysplastic syndromes. Br J Haematol. 1997;97(4):920-926. - PubMed


