Transcriptional response profiles of paired tumor-normal samples offer novel perspectives in pan-cancer analysis - PubMed (original) (raw)
Transcriptional response profiles of paired tumor-normal samples offer novel perspectives in pan-cancer analysis
Shuofeng Hu et al. Oncotarget. 2017.
Abstract
Both tumor and adjacent normal tissues are valuable in cancer research. Transcriptional response profiles represent the changes of gene expression levels between paired tumor and adjacent normal tissues. In this study, we performed a pan-cancer analysis based on the transcriptional response profiles from 633 samples across 13 cancer types. We obtained two interesting results. Using consensus clustering method, we characterized ten clusters with distinct transcriptional response patterns and enriched pathways. Notably, head and neck squamous cell carcinoma was divided in two subtypes, enriched in cell cycle-related pathways and cell adhesion-related pathways respectively. The other interesting result is that we identified 92 potential pan-cancer genes that were consistently upregulated across multiple cancer types. Knockdown of FAM64A or TROAP inhibited the growth of cancer cells, suggesting that these genes may promote tumor development and are worthy of further validations. Our results suggest that transcriptional response profiles of paired tumor-normal tissues can provide novel perspectives in pan-cancer analysis.
Keywords: biomarker; comparison; paired tumor-normal sample; pan-cancer; transcriptional response profiles.
Conflict of interest statement
CONFLICTS OF INTEREST
Competing financial interests: The authors declare no competing financial interest.
Figures
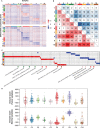
Figure 1. Consensus clustering result of 633 paired tumor-normal samples
Heatmap shows the pattern of transcriptional response profiles derived from consensus clustering algorithm. Rows indicate genes and columns indicate 633 samples from 13 cancer types. Red color indicates positive transcriptional responses while green color indicates negative transcriptional responses. The 10 clusters identified are shown by different colors in the top bar with 1 to 10 marked on it. Cancer types are shown by different colors in the second bar.
Figure 2. Differentially expressed genes and pathway analysis across 10 clusters
(A) Heatmaps show upregulated and downregulated genes of each cluster on the top and bottom, respectively. Rows indicate genes differentially expressed in corresponding clusters and columns indicate samples sorted by clusters. (B) Overlapping genes between each two clusters. Red color means overlaps derived from upregulated genes while blue color means overlaps derived from downregulated genes. (C) GSEA heatmap shows pathways with nominal p value < 0.01. Red color indicates upregulated pathways and blue color indicates downregulated pathways. Representative pathways were pointed out below. (D) Immune scores across 10 clusters in both tumor and normal samples.
Figure 3. Comparison of two HNSC subtypes
(A) The heatmap shows transcriptional response profiles of differentially expressed genes between two HNSC subtypes. Rows indicate genes and columns indicate HNSC samples. The numbers of differentially expressed genes are labeled on the left bar. (B) Kaplan-Meier analysis for overall survival between two HNSC subtypes. (C) DAVID gene functional annotation of differentially expressed genes in each HNSC subtypes. GO BP terms are ranked according to their negative log10-transformed p values. Top 10 GO biological process terms are shown in bar plots.
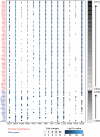
Figure 4. Pan-cancer genes in 13 cancer types
Expression levels of pan-cancer genes were compared between tumors and paired normal samples. The sizes of points represent log2(fold-change) and the colors of points represent negative log10-transformed p value. Only points with p value < 0.01 and log2(fold-change) ≥ 1.5 are drawn. The red color on the left shows cell cycle-related genes while the blue color shows other genes. The right bar shows the proportions of samples with log2(fold-change) ≥ 2 in all 633 samples for each gene. The 92 genes are ordered according to the proportions.
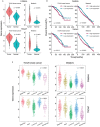
Figure 5. Analysis of pan-cancer genes FAM64A and TROAP
(A) The expression levels of FAM64A and TROAP were compared between tumor and normal tissues in TCGA breast cancer and METABRIC datasets, respectively. The Student's t statistic was used to evaluate statistical difference. (B) Kaplan-Meier curves of FAM64A and TROAP in TCGA breast cancer and METABRIC datasets. Samples were stratified according to gene expression levels. The cutoff values were derived from the Cutoff Finder. (C) The expression levels of FAM64A and TROAP in PAM50 subtypes in TCGA breast cancer cohort and METABRIC dataset. One-way ANOVA was performed to evaluate the statistical difference among the five PAM50 subtypes.
Figure 6. Validation of proliferation function of FAM64A and TROAP in MDA-MB-231 cell line
(A) FAM64A and TROAP were knocked down by transfecting lentivirus expressing both shRNA and green fluorescent protein. Cell cytometry was performed every day for five days using the Celigo system. (B) The proliferation curves showed the average and standard deviation of cell numbers in three wells for FAM64A knockdown group, TROAP knockdown group and control group for five days. (C) The cell number fold was calculated by dividing cell number of a given day by the previous day. The cell number fold of the first day was set to 1. The p values of paired one-tail t-test are 0.03798 and 0.04098 for FAM64A and TROAP, respectively.
Similar articles
- Tissue-specific gene expression of head and neck squamous cell carcinoma in vivo by complementary DNA microarray analysis.
Sok JC, Kuriakose MA, Mahajan VB, Pearlman AN, DeLacure MD, Chen FA. Sok JC, et al. Arch Otolaryngol Head Neck Surg. 2003 Jul;129(7):760-70. doi: 10.1001/archotol.129.7.760. Arch Otolaryngol Head Neck Surg. 2003. PMID: 12874079 - A novel splice variant of LOXL2 promotes progression of human papillomavirus-negative head and neck squamous cell carcinoma.
Liu C, Guo T, Sakai A, Ren S, Fukusumi T, Ando M, Sadat S, Saito Y, Califano JA. Liu C, et al. Cancer. 2020 Feb 15;126(4):737-748. doi: 10.1002/cncr.32610. Epub 2019 Nov 13. Cancer. 2020. PMID: 31721164 - The microRNA signatures: aberrantly expressed microRNAs in head and neck squamous cell carcinoma.
Koshizuka K, Hanazawa T, Fukumoto I, Kikkawa N, Okamoto Y, Seki N. Koshizuka K, et al. J Hum Genet. 2017 Jan;62(1):3-13. doi: 10.1038/jhg.2016.105. Epub 2016 Aug 25. J Hum Genet. 2017. PMID: 27557665 Review. - Molecular profiling of head and neck tumors.
Sotiriou C, Lothaire P, Dequanter D, Cardoso F, Awada A. Sotiriou C, et al. Curr Opin Oncol. 2004 May;16(3):211-4. doi: 10.1097/00001622-200405000-00003. Curr Opin Oncol. 2004. PMID: 15069314 Review.
Cited by
- The Upregulation of Trophinin-Associated Protein (TROAP) Predicts a Poor Prognosis in Hepatocellular Carcinoma.
Hu H, Xu L, Chen Y, Luo SJ, Wu YZ, Xu SH, Liu MT, Lin F, Mei Y, Yang Q, Qiang YY, Lin YW, Deng YJ, Lin T, Sha YQ, Huang BJ, Zhang SJ. Hu H, et al. J Cancer. 2019 Jan 29;10(4):957-967. doi: 10.7150/jca.26666. eCollection 2019. J Cancer. 2019. PMID: 30854102 Free PMC article. - Transcriptomic data in tumor-adjacent normal tissues harbor prognostic information on multiple cancer types.
Oh E, Lee H. Oh E, et al. Cancer Med. 2023 May;12(10):11960-11970. doi: 10.1002/cam4.5864. Epub 2023 Mar 31. Cancer Med. 2023. PMID: 36999961 Free PMC article. - Macrophages and the immune microenvironment in OPMDs: a systematic review of the literature.
Sutera S, Furchì OA, Pentenero M. Sutera S, et al. Front Oral Health. 2025 May 13;6:1605978. doi: 10.3389/froh.2025.1605978. eCollection 2025. Front Oral Health. 2025. PMID: 40432828 Free PMC article. - ALDH1A3 affects colon cancer in vitro proliferation and invasion depending on CXCR4 status.
Feng H, Liu Y, Bian X, Zhou F, Liu Y. Feng H, et al. Br J Cancer. 2018 Jan;118(2):224-232. doi: 10.1038/bjc.2017.363. Epub 2017 Dec 12. Br J Cancer. 2018. PMID: 29235568 Free PMC article. - High expression of PIMREG predicts poor survival outcomes and is correlated with immune infiltrates in lung adenocarcinoma.
Jiang F, Liang M, Huang X, Shi W, Wang Y. Jiang F, et al. PeerJ. 2021 Jul 6;9:e11697. doi: 10.7717/peerj.11697. eCollection 2021. PeerJ. 2021. PMID: 34268011 Free PMC article.
References
- de Bono JS, Bellmunt J, Attard G, Droz JP, Miller K, Flechon A, Sternberg C, Parker C, Zugmaier G, Hersberger-Gimenez V, Cockey L, Mason M, Graham J. Open-Label Phase II Study Evaluating the Efficacy and Safety of Two Doses of Pertuzumab in Castrate Chemotherapy-Naive Patients With Hormone-Refractory Prostate Cancer. J Clin Oncol. 2007;25:257–62. doi: 10.1200/JCO.2006.07.0888. - DOI - PubMed
MeSH terms
LinkOut - more resources
Full Text Sources
Other Literature Sources


