Demonstration of a potent RET transcriptional inhibitor for the treatment of medullary thyroid carcinoma based on an ellipticine derivative - PubMed (original) (raw)
Demonstration of a potent RET transcriptional inhibitor for the treatment of medullary thyroid carcinoma based on an ellipticine derivative
Vishnu Muthuraj Kumarasamy et al. Int J Oncol. 2017 Jul.
Abstract
Dominant-activating mutations in the RET (rearranged during transfection) proto-oncogene, which encodes a receptor tyrosine kinase, is often associated with the development of medullary thyroid carcinoma (MTC). The proximal promoter region of the RET gene consists of a guanine-rich sequence containing five runs of three consecutive guanine residues that serve as the binding site for transcriptional factors. As we have recently shown, this stretch of nucleotides in the promoter region is highly dynamic in nature and tend to form non-B DNA secondary structures called G-quadruplexes, which suppress the transcription of the RET gene. In the present study, ellipticine and its derivatives were identified as excellent RET G-quadruplex stabilizing agents. Circular dichroism (CD) spectroscopic studies revealed that the incorporation of a piperidine ring in an ellipticine derivative, NSC311153 improves its binding with the G-quadruplex structure and the stability induced by this compound is more potent than ellipticine. Furthermore, this compound also interfered with the transcriptional mechanism of the RET gene in an MTC derived cell line, TT cells and significantly decreased the endogenous RET protein expression. We demonstrated the specificity of NSC311153 by using papillary thyroid carcinoma (PTC) cells, the TPC1 cell line which lacks the G-quadruplex forming sequence in the promoter region due to chromosomal rearrangement. The RET downregulation selectively suppresses cell proliferation by inhibiting the intracellular Raf/MEK/ERK and PI3K/Akt/mTOR signaling pathways in the TT cells. In the present study, we also showed that the systemic administration of a water soluble NSC311153 analog in a mouse MTC xenograft model inhibited the tumor growth through RET downregulation.
Figures
Figure 1
Ellipticine analogs. Chemical structures of ellipticine and its derivatives.
Figure 2
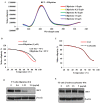
Evaluation of ellipticine as a potential RET G-quadruplex stabilizing agent. (A) CD titration spectra for the RET-WT (5 _µ_M) in the absence and presence of increasing concentrations of ellipticine. x-axes and y-axes represent the wavelength of the spectral scan and molar ellipticity of the G-quadruplex structure, respectively. (B) Melting curve of the RET-WT G-quadruplex in the absence and presence of ellipticine (1 equivalent). (C) Melting curve of the RET-WT G-quadruplex in the absence and in the presence of 2-hydroxycarbazole (5 equivalents). x-axes and y-axes represent the temperature and relative molar ellipticity of the G-quadruplex structure, respectively. (D) Western blot analysis to determine the effect of ellipticine on RET protein expression in TT cells after 48-h incubation. (E) Effect of 2-hydroxycarbazole on RET expression in TT cells at various concentrations.
Figure 3
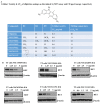
Effect of ellipticine and its structural derivatives on the RET expression in TT cells. (A) Ellipticine derivatives with different functional groups at positions C-9, N-2 and N-6. The IC50 values of the ellipticine derivatives in TT cells and the increase in G-quadruplex Tm in the presence of these compounds were determined by MTS assay and CD spectroscopic analysis, respectively. (B) Evaluation of the RET inhibitory effects of all the ellipticine analogs in TT cells after 48-h treatment.
Figure 4
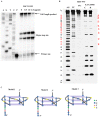
Taq DNA polymerase assay and DMS footprinting to validate the stabilization of RET G-quadruplex by NSC311153. (A) DNA polymerase stop assay at increasing concentrations of NSC311153. Lanes A, G, T and C represent the di-deoxy sequencing reactions with the same template, which serve as the marker to locate the exact stop site. Lane P represents the position of the free primer on the gel. (B) DMS footprinting on the RET-WT G-quadruplex forming sequence in the absence and presence of NSC311153 (5 equivalents) following 0.2% DMS treatment (lanes C and D, respectively). Purine and pyrimidine sequencing act as single base ladders to identify the protected and cleaved guanines after piperidine treatment (lanes AG and TC, respectively). (C) Schematic models for the parallel G-quadruplexes formed by RET-WT sequence in the absence and presence of NSC311153.
Figure 5
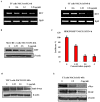
Inhibitory effect of NSC311153 on the promoter activity of RET gene. (A) Effect of NSC311153 on the RET mRNA expression in TT cells after 24- and 48-h treatments at various concentrations. (B) Effect of NSC311153 on the RET expression in MZ-CRC-1 cell line was determined by western blotting following 48-h incubation with this compound. (C) Luciferase expression in HEK293-RET cell line following the treatment with NSC311153 up to 24 h. Luciferase activity in cell lysates was measured as relative luminescence units (RLU) and normalized to the total protein content. x-axes and y-axes represent the concentration of NSC311153 and the relative luciferase activity in HEK293-RET cell line, respectively. Data are mean ± SEM of three different experiments. (D) Effect of NSC311153 on the RET/PTC1 expression in TPC1 cells was determined following 48-h exposure with various concentrations of this compound. (E) Western blot analyses for the expression of c-Myc and VEGF in TT cell line in the presence of different concentrations of NSC311153.
Figure 6
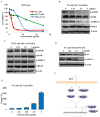
Cellular effects mediated by RET downregulation. (A) MTS assay for TT, TPC1 and Nthy-ori-3-1 cells treated with an increasing concentration of NSC311153 for 96 h to determine the cell viability. x-axes and y-axes represent the concentration of NSC311153 and the relative cell viability, respectively. Data are mean ± SEM of three separate experiments. (B) The phosphorylation status of mTOR and ERK1/2 were determined in TT and TPC1 cells following the exposure with different concentrations of NSC311153. (C) Western blot analysis to determine the effect of NSC311153 on the phosphorylation of ERK1/2 and mTOR in TPC1 cells. (D) The Bcl-2 and cyclin D1 protein expressions in TT cells were determined by western blotting. (E) Caspase-3 activity was determined in TT cells in the presence of NSC311153. x-axes and y-axes represent the concentration of NSC311153 and the relative caspase-3 activity respectively. Data are mean ± SEM of three separate experiments. (F) Schematic representation of the signaling pathways that are regulated by oncogenic activation of RET kinase (10).
Figure 7
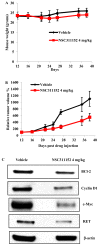
Effect of ellipticine derivative, NSC311152 on the MTC tumor growth in vivo. (A) Average weight of mice in vehicle treated group and NSC311152 (4 mg/kg) treated group. x- and y-axes represent the number of days after drug administration and the average mouse weight, respectively. (B) MTC tumor growth curves of the vehicle treated group and NSC311152 (4 mg/kg) treated group. x-axes and y-axes represent the number of days after drug administration and the average tumor volume, respectively. Data are mean ± SEM of 6 different mice. (C) Western blot analysis to determine the expression of RET, cMyc, Bcl-2 and cyclin D1 on the tumor tissues extracted from the drug treated and vehicle treated mice.
Similar articles
- Selective repression of RET proto-oncogene in medullary thyroid carcinoma by a natural alkaloid berberine.
Kumarasamy VM, Shin YJ, White J, Sun D. Kumarasamy VM, et al. BMC Cancer. 2015 Aug 26;15:599. doi: 10.1186/s12885-015-1610-5. BMC Cancer. 2015. PMID: 26307103 Free PMC article. - Involvement of G-quadruplex structures in regulation of human RET gene expression by small molecules in human medullary thyroid carcinoma TT cells.
Shin YJ, Kumarasamy V, Camacho D, Sun D. Shin YJ, et al. Oncogene. 2015 Mar 5;34(10):1292-9. doi: 10.1038/onc.2014.65. Epub 2014 Mar 24. Oncogene. 2015. PMID: 24662821 - Salinomycin and its derivatives as potent RET transcriptional inhibitors for the treatment of medullary thyroid carcinoma.
Alqahtani T, Kumarasamy VM, Huczyński A, Sun D. Alqahtani T, et al. Int J Oncol. 2020 Jan;56(1):348-358. doi: 10.3892/ijo.2019.4916. Epub 2019 Nov 20. Int J Oncol. 2020. PMID: 31746350 - Use of Tyrosine Kinase Inhibitors for Treatment of Medullary Thyroid Carcinoma.
Dadu R, Hu MN, Grubbs EG, Gagel RF. Dadu R, et al. Recent Results Cancer Res. 2015;204:227-49. doi: 10.1007/978-3-319-22542-5_11. Recent Results Cancer Res. 2015. PMID: 26494392 Review. - Diversity of mutations in the RET proto-oncogene and its oncogenic mechanism in medullary thyroid cancer.
Hedayati M, Zarif Yeganeh M, Sheikholeslami S, Afsari F. Hedayati M, et al. Crit Rev Clin Lab Sci. 2016 Aug;53(4):217-27. doi: 10.3109/10408363.2015.1129529. Epub 2016 Jan 27. Crit Rev Clin Lab Sci. 2016. PMID: 26678667 Review.
Cited by
- Developing Novel G-Quadruplex Ligands: from Interaction with Nucleic Acids to Interfering with Nucleic Acid⁻Protein Interaction.
Sun ZY, Wang XN, Cheng SQ, Su XX, Ou TM. Sun ZY, et al. Molecules. 2019 Jan 22;24(3):396. doi: 10.3390/molecules24030396. Molecules. 2019. PMID: 30678288 Free PMC article. Review. - Adefovir Dipivoxil as a Therapeutic Candidate for Medullary Thyroid Carcinoma: Targeting RET and STAT3 Proto-Oncogenes.
Alqahtani T, Kumarasamy V, Alghamdi SS, Suliman RS, Bin Saleh K, Alrashed MA, Aldhaeefi M, Sun D. Alqahtani T, et al. Cancers (Basel). 2023 Apr 5;15(7):2163. doi: 10.3390/cancers15072163. Cancers (Basel). 2023. PMID: 37046823 Free PMC article. - G-quadruplex DNA: a novel target for drug design.
Teng FY, Jiang ZZ, Guo M, Tan XZ, Chen F, Xi XG, Xu Y. Teng FY, et al. Cell Mol Life Sci. 2021 Oct;78(19-20):6557-6583. doi: 10.1007/s00018-021-03921-8. Epub 2021 Aug 30. Cell Mol Life Sci. 2021. PMID: 34459951 Free PMC article. Review. - Berberine as a Potential Anticancer Agent: A Comprehensive Review.
Rauf A, Abu-Izneid T, Khalil AA, Imran M, Shah ZA, Emran TB, Mitra S, Khan Z, Alhumaydhi FA, Aljohani ASM, Khan I, Rahman MM, Jeandet P, Gondal TA. Rauf A, et al. Molecules. 2021 Dec 4;26(23):7368. doi: 10.3390/molecules26237368. Molecules. 2021. PMID: 34885950 Free PMC article. Review. - Promising Role of Alkaloids in the Prevention and Treatment of Thyroid Cancer and Autoimmune Thyroid Disease: A Comprehensive Review of the Current Evidence.
Di Dalmazi G, Giuliani C, Bucci I, Mascitti M, Napolitano G. Di Dalmazi G, et al. Int J Mol Sci. 2024 May 15;25(10):5395. doi: 10.3390/ijms25105395. Int J Mol Sci. 2024. PMID: 38791433 Free PMC article. Review.
References
- Takahashi M, Buma Y, Iwamoto T, Inaguma Y, Ikeda H, Hiai H. Cloning and expression of the ret proto-oncogene encoding a tyrosine kinase with two potential transmembrane domains. Oncogene. 1988;3:571–578. - PubMed
- Takahashi M, Buma Y, Hiai H. Isolation of ret proto-oncogene cDNA with an amino-terminal signal sequence. Oncogene. 1989;4:805–806. - PubMed
MeSH terms
Substances
Supplementary concepts
LinkOut - more resources
Full Text Sources
Other Literature Sources
Medical
Research Materials
Miscellaneous

