Regionally compartmentalized resident memory T cells mediate naturally acquired protection against pneumococcal pneumonia - PubMed (original) (raw)
Regionally compartmentalized resident memory T cells mediate naturally acquired protection against pneumococcal pneumonia
N Ms Smith et al. Mucosal Immunol. 2018 Jan.
Abstract
As children age, they become less susceptible to the diverse microbes causing pneumonia. These microbes are pathobionts that infect the respiratory tract multiple times during childhood, generating immunological memory. To elucidate mechanisms of such naturally acquired immune protection against pneumonia, we modeled a relevant immunological history in mice by infecting their airways with mismatched serotypes of Streptococcus pneumoniae (pneumococcus). Previous pneumococcal infections provided protection against a heterotypic, highly virulent pneumococcus, as evidenced by reduced bacterial burdens and long-term sterilizing immunity. This protection was diminished by depletion of CD4+ cells prior to the final infection. The resolution of previous pneumococcal infections seeded the lungs with CD4+ resident memory T (TRM) cells, which responded to heterotypic pneumococcus stimulation by producing multiple effector cytokines, particularly interleukin (IL)-17A. Following lobar pneumonias, IL-17-producing CD4+ TRM cells were confined to the previously infected lobe, rather than dispersed throughout the lower respiratory tract. Importantly, pneumonia protection also was confined to that immunologically experienced lobe. Thus regionally localized memory cells provide superior local tissue protection to that mediated by systemic or central memory immune defenses. We conclude that respiratory bacterial infections elicit CD4+ TRM cells that fill a local niche to optimize heterotypic protection of the affected tissue, preventing pneumonia.
Conflict of interest statement
Disclosures: The authors declare no conflicts of interest
Figures
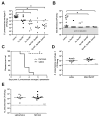
Figure 1. Repeated respiratory infections establish heterotypic protection against pneumococcal pneumonia
C57BL/6 mice were infected with the indicated pneumococcal serotypes (or saline) one, two, or three times intranasally (i.n.) with doses of 1–3×10⁶ CFU each that were seperated by 1 week. After a 4 week rest period mice were challenged with 1×10⁶ Sp3 CFU i.t. for 24h. Lung (A) and blood (B) bacterial burdens were determined. Significance was determined by one-way ANOVA followed by Dunn’s post hoc test. Dashed line indictaes Sp3 CFU infection input. (C) Mice previously exposed to Sp19F, Sp35B, and Sp23A (i.n.) or saline were infected 4 weeks later with 3×10⁵ Sp3 CFU i.t. and followed for 7 days (Kaplan-Meier curve, n=9–10 per group). Significance was determined by Mantel-Cox test. (D) C57BL/6 mice were given 2 doses of heat-killed Sp19F (1×10⁶ CFU) or saline i.n. and challeged 4 weeks later with 1×10⁶ Sp3 CFU i.t. After 24h lung bacterial burden was assessed. (E) Het Imm (i.n.) or saline controls were infected with 5 ×10⁴ Klebsiella pneumoniae CFU i.t. and lung bacterial burden was assessed after 24h. Significance was determined by Mann-Whitney test. Each individual dot represents a single mouse and horizontal lines in scatter plots represent medians. Two independent experiments were performed in every case. *P < 0.05.
Figure 2. Heterotypic anti-pneumococcal immunity accelerates lung neutrophil recruitment
(A) Representative H&E images of Het Imm and saline control lungs that were collected, fixed with 4% PFA, and paraffin embedded 0 and 24h after an infection with 1×10⁶ Sp3 CFU. Images represent 10X magnification. (B) BALF was collected from Het Imm (i.n.) and saline lungs 7 and 24h following infection with 1×10⁶ Sp3 CFU. Differential cell counts were obtained and data are expressed as total number of neutrophils and macrophages. Bars represent means with standard error of the mean (SEM) displayed. Data were log transformed (Y=Log(Y)) and significance was determined by two-way ANOVA followed by Sidak’s post hoc test (n=8–9 for each group). *P < 0.05 for saline vs Het Imm comparisons. Two independent experiments were performed in every case.
Figure 3. Increased lung-to-neutrophil signaling due to heterotypic immunity
(A–G) Het Imm (i.n.) and saline control mice were infected with 1×10⁶ Sp3 CFU and BALF was collected 7 hours later. Cytokine concentrations were measured in the BALF using a multi-plex Luminex assay. Data are expressed as pg/mL and bars represent means with SEM. Dashed lines indicate the limit of detection for the particular analyte. Significance was determined by Student’s t test (n= 14 per group), *P < 0.05. Three independent experiments were performed.
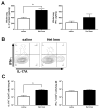
Figure 4. CD4+ Th17 cells in lungs with heterotypic immunity during pneumococcal pneumonia
Het Imm (i.n.) and saline control mice were infected with 1×10⁶ Sp3 CFU for 24h. (A) Whole lungs were collected, homogenized and protein was extracted. IFN-γ and IL-17A protein concentrations were measured by ELISA. Data are expressed as pg/lung and bars represent means with SEM. Significance was determined by Student’s t test (n= 10–12 per group). (B) Whole lungs were collected and digested with collagenase to generate single cell suspensions. Cells were stimulated with PMA/Ionomycin for 6h in the presence of a protein transport inhibitor. IL-17A+ and IFN-γ+ CD4+ cells were detected using intracellular cytokine staining (ICS). Representative flow cytometry plots from a Het Imm and saline mouse are displayed. (C) IL-17A+ and IFN-γ+ CD4+ cells were quantified and are displayed as number of cells per lung. Bars represent means with SEM. Significance was determined by Student’s t test (n= 6–7 per group). Two independent experiments were performed in every case. *P < 0.05,
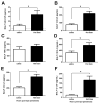
Figure 5. CD4+ cells are required for optimal heterotypic protection against pneumococal pneumonia
(A) Het Imm mice (i.t.) were administered either a CD4-depleting GK1.5 antibody 72 and 24h before a pneumonia challenge both intranasally (100ug) and intraperitoneally (500ug), or a control IgG antibody at the same concentrations. Mice were infected with 1×10⁶ Sp3 CFU and whole lungs were collected after 24h of pneumonia to determine lung bacterial burden. (B–C) IL-17A and IFN-γ protein levels were measured in the whole lung homogenates from (A). Data were expressed as pg/lung. Significance was determined by Student’s t test. (D) FTY720 or vehicle control was administered to Het Imm (i.t.) mice at a dose of 1mg/kg 2 days prior and the day of a pneumonia challenge with 1×10⁶ Sp3 CFU. Bacterial burden was assessed in whole lungs after 24h. Significance was determined using a Mann-Whitney test. (E) IL-17A protein levels were measured in the whole lung homogenates from (D). Significance was determined by Student’s t test. Individual dots represent a single mouse and horizontal lines represent medians. Dashed line indicates Sp3 CFU infection input. Bars represent means with SEM. Two independent experiments were performed. * P < 0.05.
Figure 6. Recovery from respiratory infection seeds the lungs with pneumococcus-specific Th17 and Th1 cells
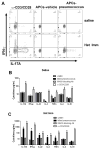
The left lobes of Het Imm (i.t.) and saline control mice were digested with collagenase and CD4+ cells were stimulated with killed Sp3-pulsed splenocytes. (A) After 12h of stimulation in the presence of a protein transport inhibitor cells were harvested and CD3+ cells were analyzed for the production of IL-17A and IFN-γ by intracellular cytokine staining. Flow cytometry plots show the percentage of IL-17A and IFN-γ production from CD3+ cells in 3 groups: pan T cell activator α-CD3/CD28 (left), vehicle-pulsed antigen presenting cells (APCs, middle), and killed pneumococcus-pulsed APCs (APCs-pneumococcus, right). Two independent experiments were performed. (B–C) CD4+ cells from Het Imm and saline lungs were stimulated with killed Sp3-pulsed splenocytes for 72h. Supernatants from saline (B) and Het Imm (C) stimulations were collected and cytokine concentrations were measured using a multi-plex luminex assay. In addition to killed pneumococcus three controls are displayed: vehicle-pulsed splenocytes (untim), pan T cell activator α-CD3/CD28, and α-MHC-II blocking antibody added to killed pneumococcus-stimulated samples. IL-22 protein was measured independently using an ELISA. Cytokine concentrations were measured in 3 separate stimulation experiments and are displayed as pg/mL. Bars represent means with SEM. The limit of detection for each assay is indicated (LOD). Data were log transformed (Y=Log(Y)) and significance was assessed by one-way ANOVA followed by Sidak’s post hoc test, *P < 0.05 vs APCs-vehicle (unstim) for each cytokine. Three independent experiments were performed.
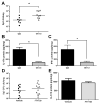
Figure 7. Lung CD4+ TRM cells and heterotypic pulmonary protection imprint locally
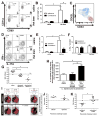
The left (L) and right (R) lobes of uninfected Het Imm (i.t.) and saline control mice were digested separately with collagenase. (A) Representative flow cytometry plots show lung TRM cells that were identified as CD3+/CD4+/CD11ahi/CD69+/CD62Llo/CD44hi. (B) TRM cells were quantified in the left (ipsilateral) and right (contralateral) lobes of Het Imm and saline mice. Data are displayed as % CD11ahiCD69+ of CD4+ cells. Bars represent means with SEM. Significance was determined by two-way ANOVA followed by Tukey’s post hoc test (n= 4–5 per group, experiment repeated three times). (C) Representative flow cytometry plot of CD44 and CD62L expression on CD11ahiCD69+ lung TRM cells (red) and lung CD4+CD11aloCD69- cells (blue). (D) Single cells from the left (ipsilateral) and right (contralateral) lobes of Het Imm (i.t.) and saline mice were stimulated with PMA/Ionomycin for 6h in the presence of a protein transport inhibitor. ICS and flow cytometry was performed to monitor cytokine production. Representative flow plots show IL-17A and IFN-γ-producing CD4+ cells from Het Imm and saline lungs. (E–F) IL-17A and IFN-γ-producing CD4+ cells were quantified in the left (ipsilateral) and right (contralateral) lobes of Het Imm and saline mice. Bars represent means with SEM. Significance was determined by two-way ANOVA followed by Tukey’s post hoc test (n= 5–6 per group). Three independent experiments were performed. (G) Mice on a mixed background were infected twice with saline, intranasal Sp19F (Het Imm i.n.), or intratracheal Sp19F (Het Imm i.t.). After 4 weeks mice from each group were challenged with 1 × 10⁶ Sp3 CFU. Lungs were harvested after 24h and bacterial burden was determined. Individual dots represent a single mouse and horizontal lines represent medians. Dashed line indicates Sp3 CFU infection input. Significance was determined by one-way ANOVA followed by Dunn’s post hoc test. (H) CD4+ lymphocytes from the lungs and spleens of uninfected Het Imm were isolated using FACS. Three minutes prior to euthanization intravital cells were fluorescently labeled with anti-CD45-APC antibody via i.v. injection. The cells for transfer were identified as live, i.v. label-negative CD45+CD4+ cells. Naïve recipient mice were administered saline, lung-derived or spleen-derived CD4+ cells (1–4×10⁶ per mouse) from Het Imm mice transferred via i.v. tail vein injection. Three days after the transfer, recipient mice were challenged with 1×10⁶ Sp3 CFU. After 24h, left lung lobes were harvested, mRNA was extracted, and qRT-PCR for IL-17A was performed. Data were displayed as fold induction for each group normalized to uninfected lungs. Significance was determined by one-way ANOVA followed by Tukey’s post hoc test (n=3–5 per group). Bars represent means with SEM. (I) Ipsilateral vs contralateral heterotypic protection model. Het Imm (i.t.) mice received two Sp19F infections in their left lobes. After 4 weeks, half of the mice were challenged with 1×10⁶ Sp3 CFU in their ipsilateral (left) lobe, and the other half challenged in their contralateral (right) lobes. Images represent the instillation (i.t.) of diluted colloidal carbon into C57BL/6 mouse lungs either in the left (L) or right (R) lobes. Lungs were immediately collected and the deposition of the dye was visualized. (J) Naïve C57BL/6 mice were infected with 1×10⁶ Sp3 CFU selectively in either the left or right lobes. Lung bacterial burden was assessed after 24h. (K) The mice described in (I) were challenged with 1×10⁶ Sp3 CFU in the specified location. After 24h whole lungs were collected and bacterial burden was assessed. Individual dots represent a single mouse and horizontal lines represent medians. Dashed line indicates Sp3 CFU infection input. Significance was determined using a Mann-Whitney test. Two independent experiments were performed. * P < 0.05.
Similar articles
- Inflammation and Pneumonia: Why Are Some More Susceptible than Others?
Mizgerd JP. Mizgerd JP. Clin Chest Med. 2018 Dec;39(4):669-676. doi: 10.1016/j.ccm.2018.07.002. Clin Chest Med. 2018. PMID: 30390740 Free PMC article. Review. - Lung CD4+ resident memory T cells remodel epithelial responses to accelerate neutrophil recruitment during pneumonia.
Shenoy AT, Wasserman GA, Arafa EI, Wooten AK, Smith NMS, Martin IMC, Jones MR, Quinton LJ, Mizgerd JP. Shenoy AT, et al. Mucosal Immunol. 2020 Mar;13(2):334-343. doi: 10.1038/s41385-019-0229-2. Epub 2019 Nov 20. Mucosal Immunol. 2020. PMID: 31748706 Free PMC article. - Generation of protective pneumococcal-specific nasal resident memory CD4+ T cells via parenteral immunization.
O'Hara JM, Redhu NS, Cheung E, Robertson NG, Patik I, Sayed SE, Thompson CM, Herd M, Lucas KB, Conaway E, Morton CC, Farber DL, Malley R, Horwitz BH. O'Hara JM, et al. Mucosal Immunol. 2020 Jan;13(1):172-182. doi: 10.1038/s41385-019-0218-5. Epub 2019 Oct 28. Mucosal Immunol. 2020. PMID: 31659300 Free PMC article. - Protection against Streptococcus pneumoniae lung infection after nasopharyngeal colonization requires both humoral and cellular immune responses.
Wilson R, Cohen JM, Jose RJ, de Vogel C, Baxendale H, Brown JS. Wilson R, et al. Mucosal Immunol. 2015 May;8(3):627-39. doi: 10.1038/mi.2014.95. Epub 2014 Oct 29. Mucosal Immunol. 2015. PMID: 25354319 Free PMC article. - The Role of CD4+ Resident Memory T Cells in Local Immunity in the Mucosal Tissue - Protection Versus Pathology.
Hirahara K, Kokubo K, Aoki A, Kiuchi M, Nakayama T. Hirahara K, et al. Front Immunol. 2021 Apr 21;12:616309. doi: 10.3389/fimmu.2021.616309. eCollection 2021. Front Immunol. 2021. PMID: 33968018 Free PMC article. Review.
Cited by
- PD-1 and ICOS counter-regulate tissue resident regulatory T cell development and IL-10 production during flu.
McGee MC, Zhang T, Magazine N, Islam R, Carossino M, Huang W. McGee MC, et al. Front Immunol. 2022 Sep 8;13:984476. doi: 10.3389/fimmu.2022.984476. eCollection 2022. Front Immunol. 2022. PMID: 36159872 Free PMC article. - Staphylococcus aureus specific lung resident memory CD4+ Th1 cells attenuate the severity of influenza virus induced secondary bacterial pneumonia.
Braverman J, Monk IR, Ge C, Westall GP, Stinear TP, Wakim LM. Braverman J, et al. Mucosal Immunol. 2022 Apr;15(4):783-796. doi: 10.1038/s41385-022-00529-4. Epub 2022 May 30. Mucosal Immunol. 2022. PMID: 35637249 Free PMC article. - Monocyte-Derived Dendritic Cells (moDCs) Differentiate into Bcl6+ Mature moDCs to Promote Cyclic di-GMP Vaccine Adjuvant-Induced Memory TH Cells in the Lung.
Mansouri S, Katikaneni DS, Gogoi H, Jin L. Mansouri S, et al. J Immunol. 2021 May 1;206(9):2233-2245. doi: 10.4049/jimmunol.2001347. Epub 2021 Apr 19. J Immunol. 2021. PMID: 33879579 Free PMC article. - Inflammation and Pneumonia: Why Are Some More Susceptible than Others?
Mizgerd JP. Mizgerd JP. Clin Chest Med. 2018 Dec;39(4):669-676. doi: 10.1016/j.ccm.2018.07.002. Clin Chest Med. 2018. PMID: 30390740 Free PMC article. Review. - Future Research Directions in Pneumonia. NHLBI Working Group Report.
Dela Cruz CS, Wunderink RG, Christiani DC, Cormier SA, Crothers K, Doerschuk CM, Evans SE, Goldstein DR, Khatri P, Kobzik L, Kolls JK, Levy BD, Metersky ML, Niederman MS, Nusrat R, Orihuela CJ, Peyrani P, Prince AS, Ramírez JA, Ridge KM, Sethi S, Suratt BT, Sznajder JI, Tsalik EL, Walkey AJ, Yende S, Aggarwal NR, Caler EV, Mizgerd JP. Dela Cruz CS, et al. Am J Respir Crit Care Med. 2018 Jul 15;198(2):256-263. doi: 10.1164/rccm.201801-0139WS. Am J Respir Crit Care Med. 2018. PMID: 29546996 Free PMC article.
References
- Bogaert D, De Groot R, Hermans PW. Streptococcus pneumoniae colonisation: the key to pneumococcal disease. Lancet Infect Dis. 2004;4(3):144–154. - PubMed
- Curns AT, Holman RC, Sejvar JJ, Owings MF, Schonberger LB. Infectious disease hospitalizations among older adults in the United States from 1990 through 2002. Arch Intern Med. 2005;165(21):2514–2520. - PubMed
Publication types
MeSH terms
Substances
Grants and funding
- R01 HL104053/HL/NHLBI NIH HHS/United States
- R01 GM120060/GM/NIGMS NIH HHS/United States
- R35 HL135756/HL/NHLBI NIH HHS/United States
- R01 AI115053/AI/NIAID NIH HHS/United States
- T32 HL007035/HL/NHLBI NIH HHS/United States
- R01 HL068153/HL/NHLBI NIH HHS/United States
- T32 AI007309/AI/NIAID NIH HHS/United States
- R01 HL111449/HL/NHLBI NIH HHS/United States
- R01 HL079392/HL/NHLBI NIH HHS/United States
LinkOut - more resources
Full Text Sources
Other Literature Sources
Research Materials
