Optimized fragmentation schemes and data analysis strategies for proteome-wide cross-link identification - PubMed (original) (raw)
Optimized fragmentation schemes and data analysis strategies for proteome-wide cross-link identification
Fan Liu et al. Nat Commun. 2017.
Abstract
We describe optimized fragmentation schemes and data analysis strategies substantially enhancing the depth and accuracy in identifying protein cross-links using non-restricted whole proteome databases. These include a novel hybrid data acquisition strategy to sequence cross-links at both MS2 and MS3 level and a new algorithmic design XlinkX v2.0 for data analysis. As proof-of-concept we investigated proteome-wide protein interactions in E. coli and HeLa cell lysates, respectively, identifying 1,158 and 3,301 unique cross-links at ∼1% false discovery rate. These protein interaction repositories provide meaningful structural information on many endogenous macromolecular assemblies, as we showcase on several protein complexes involved in translation, protein folding and carbohydrate metabolism.
Conflict of interest statement
R.V. is an employee of Thermo Fisher Scientific, developer and distributor of the Orbitrap Fusion/Lumos. The remaining authors declare no competing financial interests.
Figures
Figure 1. The multi-dimensional XL-MS data acquisition and analysis strategy.
Each MS1 precursor ion is subjected to sequential CID–MS2 and ETD–MS2 fragmentation. Data-dependent MS3 scans are performed if a unique mass difference (Δ_m_) is found in the CID–MS2 scans. In XlinkX v2.0 data analysis, CID–MS2 scans are used to calculate the potential precursor mass of each linked peptide, using Δ_m_-based, intensity-based or both strategies (see Methods). Both CID–MS2 and ETD–MS2 scans, as well as MS3 scans, are subjected to product ion matching to sequence the two peptide constituents of a cross-link. The four signature fragment ions with a unique mass difference (Δ_m_), resulting from CID-induced cross-linker cleavage are shown in colours.
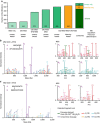
Figure 2. Benchmarking different MS acquisition and XlinkX v2.0 data analysis strategies using six E. coli SCX fractions.
(a) The total number of identified crosslinks using different MS acquisition strategies and/or different precursor mass determination strategies. (b) Example spectra of a crosslink identification from the hybrid CID–MS2–MS3–ETD–MS2 strategy. The identified cross-link is formed between Lys-89 and Lys-273 of E. coli 1,4-dihydroxy-2-naphthoyl-CoA synthase. (c) Example spectra of a cross-link identification from the intensity-based search mode. Only three (_A_s, _A_L and _B_s) out of four signature peaks are detected and, therefore, MS3 is only triggered for one of the linked peptides. The cross-link between α-ketoglutarate dehydrogenase ODO2 Lys-94 and Lys-177 can still be unambiguously identified, as ETD–MS2 and CID–MS2 data allow for confident sequencing of the B peptide.
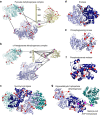
Figure 3. Cross-link mapping on representative protein complexes of E. coli.
Cross-links shown as red lines could be mapped within one high-resolution structure. These cross-link are within the expected distance range of the DSSO cross-linker (general Cα–Cα distance range: 7–25 Å, see Supplementary Discussion for additional information on the ribosomal cross-links). Lys residues that are cross-linked within a single high-resolution structure are shown as red spheres; Lys residues that are involved in cross-links between two high-resolution structures are shown as purple spheres; Lys residues that exhibit cross-links indicating polysome formation are shown as blue spheres. (a) Architecture of chaperone–ribosome co-assemblies (top-left: TF (PDB: 2VRH); middle-left: DnaK-GrpE complex (PDB: 1DKG); bottom-left: GroES-GroEL (PDB: 1PCQ); right: 70S ribosome (PDB: 3JCD)). (b) Cross-links mapped onto a homology model of prokaryotic translation initiation factor 3. (c) Cross-links confirm the crystal structure of the elongation factor Tu and elongation factor Ts complex (PDB entry 4PC1). (d) Cross-links within the bacterial DNA remodeler and transcriptional regulator H-NS (homology model) and its paralogue StpA (PDB entry 2LRX).
Figure 4. Structural insights into enzymes of the carbohydrate catabolism.
Cross-linked Cα atoms are shown as spheres. All cross-links within one crystal structure (shown as red lines) comply with the distance limit of the DSSO cross-linker (Cα- Cα distance range 8–27 Å). Crosslinks representing previously unknown interactions are depicted as gray lines connecting two magenta spheres. (a,b) Architecture of α-keto acid dehydrogenase multi-enzyme complexes. Each component is shown in its minimal oligomeric state, as suggested by X-ray crystallography. Structurally uncharacterized regions are shown as sequence bars. (a) Pyruvate dehydrogenase. The E1 component (OPD1) is depicted in shades of blue (PDB entry 2G25). The E2 component (ODP2) is shown in shades of yellow as a homo-trimer starting from residue 384 (PDB entry 4N72) and a single copy of the E1-binding E2 region (residues 327–372, PDB entry 4QOY). The E1/E2 interface was determined by structurally aligning the PDB entries 2G25 and 4QOY using Pymol v1.5. The E3 component (DLDH) is shown in shades of teal (PDB entry 4JDR). (b) α-Ketoglutarate dehydrogenase. Depicted are an E1 homo-dimer (shades of blue, PDB entry 2JGD), an E2 monomer (yellow, PDB entries 1BAL and 1SCZ) and an E3 homo-dimer (PDB entry 4JDR). To visualize cross-links originating from E2 Lys-156, the C-terminal loop region of PDB entry 1BAL was extended by three residues using the ‘rebuild' function of Pymol v1.5. In addition, cross-links were mapped onto structures of (c) succinyl-coenzyme A ligase α (light and dark teal)/β(light and dark blue)-hetero-tetramer (PDB entry 1JKJ), (d) enolase homo-dimer (PDB entry 1E9I), (e) phosphoglycerate kinase (PDB entry 1ZMR), (f) phosphoglycerate mutase (PDB entry 1E58) and (g) glyceraldehyde 3-phosphate dehydrogenase homo-dimer (light and dark blue, PDB entry 1DC3), which was additionally found to be cross-linked to malonyl-coenzyme A acyl carrier protein transacylase (dark teal, PDB entry 1MLA).
Similar articles
- Proteome-wide profiling of protein assemblies by cross-linking mass spectrometry.
Liu F, Rijkers DT, Post H, Heck AJ. Liu F, et al. Nat Methods. 2015 Dec;12(12):1179-84. doi: 10.1038/nmeth.3603. Epub 2015 Sep 28. Nat Methods. 2015. PMID: 26414014 - MaXLinker: Proteome-wide Cross-link Identifications with High Specificity and Sensitivity.
Yugandhar K, Wang TY, Leung AK, Lanz MC, Motorykin I, Liang J, Shayhidin EE, Smolka MB, Zhang S, Yu H. Yugandhar K, et al. Mol Cell Proteomics. 2020 Mar;19(3):554-568. doi: 10.1074/mcp.TIR119.001847. Epub 2019 Dec 15. Mol Cell Proteomics. 2020. PMID: 31839598 Free PMC article. - Protein identification false discovery rates for very large proteomics data sets generated by tandem mass spectrometry.
Reiter L, Claassen M, Schrimpf SP, Jovanovic M, Schmidt A, Buhmann JM, Hengartner MO, Aebersold R. Reiter L, et al. Mol Cell Proteomics. 2009 Nov;8(11):2405-17. doi: 10.1074/mcp.M900317-MCP200. Epub 2009 Jul 16. Mol Cell Proteomics. 2009. PMID: 19608599 Free PMC article. - Protein-Protein Interaction Detection Via Mass Spectrometry-Based Proteomics.
Turriziani B, von Kriegsheim A, Pennington SR. Turriziani B, et al. Adv Exp Med Biol. 2016;919:383-396. doi: 10.1007/978-3-319-41448-5_18. Adv Exp Med Biol. 2016. PMID: 27975227 Review. - Protein Inference.
He Z, Huang T, Zhao C, Teng B. He Z, et al. Adv Exp Med Biol. 2016;919:237-242. doi: 10.1007/978-3-319-41448-5_12. Adv Exp Med Biol. 2016. PMID: 27975221 Review.
Cited by
- Avidity-Based Selection of Tissue-Specific CAR-T Cells from a Combinatorial Cellular Library of CARs.
Ma P, Ren P, Zhang C, Tang J, Yu Z, Zhu X, Fan K, Li G, Zhu W, Sang W, Min C, Chen W, Huang X, Yang G, Lerner RA. Ma P, et al. Adv Sci (Weinh). 2021 Jan 29;8(6):2003091. doi: 10.1002/advs.202003091. eCollection 2021 Mar. Adv Sci (Weinh). 2021. PMID: 33747727 Free PMC article. - Cross-ID: Analysis and Visualization of Complex XL-MS-Driven Protein Interaction Networks.
de Graaf SC, Klykov O, van den Toorn H, Scheltema RA. de Graaf SC, et al. J Proteome Res. 2019 Feb 1;18(2):642-651. doi: 10.1021/acs.jproteome.8b00725. Epub 2019 Jan 17. J Proteome Res. 2019. PMID: 30575379 Free PMC article. - All-in-One Pseudo-MS3 Method for the Analysis of Gas-Phase Cleavable Protein Crosslinking Reactions.
Brodie NI, Sarpe V, Crowder DA, Schriemer D. Brodie NI, et al. J Am Soc Mass Spectrom. 2023 Oct 4;34(10):2146-2155. doi: 10.1021/jasms.3c00134. Epub 2023 Aug 17. J Am Soc Mass Spectrom. 2023. PMID: 37590165 Free PMC article. - Systematic identification of structure-specific protein-protein interactions.
Holfeld A, Schuster D, Sesterhenn F, Gillingham AK, Stalder P, Haenseler W, Barrio-Hernandez I, Ghosh D, Vowles J, Cowley SA, Nagel L, Khanppnavar B, Serdiuk T, Beltrao P, Korkhov VM, Munro S, Riek R, de Souza N, Picotti P. Holfeld A, et al. Mol Syst Biol. 2024 Jun;20(6):651-675. doi: 10.1038/s44320-024-00037-6. Epub 2024 May 3. Mol Syst Biol. 2024. PMID: 38702390 Free PMC article. - Structural proteomics defines a sequential priming mechanism for the progesterone receptor.
Mann MD, Wang M, Ferreon JC, Suess MP, Jain A, Malovannaya A, Alvarez RV, Pascal BD, Kumar R, Edwards DP, Griffin PR. Mann MD, et al. bioRxiv [Preprint]. 2024 Oct 3:2024.09.06.611729. doi: 10.1101/2024.09.06.611729. bioRxiv. 2024. PMID: 39282295 Free PMC article. Preprint.
References
- Leitner A., Faini M., Stengel F. & Aebersold R. Crosslinking and mass spectrometry: an integrated technology to understand the structure and function of molecular machines. Trends Biochem. Sci. 41, 20–32 (2016). - PubMed
- Sinz A. The advancement of chemical cross-linking and mass spectrometry for structural proteomics: from single proteins to protein interaction networks. Expert Rev. Proteomics 11, 733–743 (2014). - PubMed
- Liu F. & Heck A. J. R. Interrogating the architecture of protein assemblies and protein interaction networks by cross-linking mass spectrometry. Curr. Opin. Struct. Biol. 35, 100–108 (2015). - PubMed
Publication types
MeSH terms
Substances
LinkOut - more resources
Full Text Sources
Other Literature Sources
Research Materials


