The mouse thermoregulatory system: Its impact on translating biomedical data to humans - PubMed (original) (raw)
Review
The mouse thermoregulatory system: Its impact on translating biomedical data to humans
Christopher J Gordon. Physiol Behav. 2017.
Abstract
The laboratory mouse has become the predominant test species in biomedical research. The number of papers that translate or extrapolate data from mouse to human has grown exponentially since the year 2000. There are many physiological and anatomical factors to consider in the process of extrapolating data from one species to another. Body temperature is, of course, a critical determinant in extrapolation because it has a direct impact on metabolism, cardiovascular function, drug efficacy, pharmacokinetics of toxins and drugs, and many other effects. While most would consider the thermoregulatory system of mice to be sufficiently stable and predictable as to not be a cause for concern, the thermal physiology of mice does in fact present unique challenges to the biomedical researcher. A variable and unstable core temperature, high metabolic rate, preference for warm temperatures, large surface area: body mass ratio, and high rate of thermal conductance, are some of the key factors of mice that can affect the interpretation and translation of data to humans. It is the intent of this brief review to enlighten researchers studying interspecies translation of biomedical data on the salient facets of the mouse thermal physiology and show how extrapolation in fields such as physiology, psychology, nutrition, pharmacology, toxicology, and pathology.
Keywords: Behavior; Core temperature; Extrapolation; Hypothermia; Metabolic rate; Preferred temperature; Thermal conductance.
Published by Elsevier Inc.
Figures
Fig. 1.
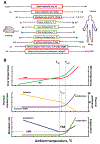
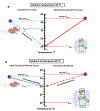
A. Simplified view of the numerical similarities and dissimilarities of basic thermoregulatory, metabolic, and morphometric parameters of a mouse compared to a nude and clothed adult human. Numerical values for mouse and human represent approximate values from the literature. Data with asterisk determined or a clothed adult human with 1.0 clo of insulation. Note that thermal conductance or whole-body thermal conductance was estimated for humans but it is term used primarily in rodent thermal physiological studies and rarely in human thermoregulatory studies. See B for explanation of thermoeffectors. Data and calculations taken from several sources: Hill et al. [30], Gordon [17,25], Schmidt-Nielsen [50], Speakman and Keijer [49]; and Aschoff [2]; BAT weights from [6,8]). B. Diagram illustrating the general trends of core and skin temperature and select thermoeffectors as a function of ambient temperature. Abbreviations: WBTC-whole-body thermal conductance, BMR-basal metabolic rate, Tpref-preferred ambient temperature, TNZ-thermoneutral zone, Tlct-lower critical ambient temperature, Tuct-upper critical ambient temperature. Thermal preference is a qualitative estimate of preference for a warmer (> 0) or cooler (< 0) ambient temperature. Diagram modified from Ingram and Mount [31] and Gordon [17].
Fig. 2.
Effects of ambient temperature on stability of core temperature of pairs of female CD-1 mice housed in standard cages with betta chip bedding and provided with two cotton nestlets for nest building (see Fig. 4). Mean core temperatures are compared between ambient temperatures of 22 vs. 30 °C (A), 30 vs. 32 °C (B), and 30 vs. 34 °C (C). D. Plot of ambient temperature versus mean day and night time core temperature. Telemetry data was collected from one of the two mice in each cage. Each line is the mean ± SE of 8 cages of mice with an average of 7 consecutive days of data. Gordon (unpublished).
Fig. 3.
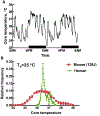
A. Time-course of core temperature of a C57BL/c female mouse maintained at an ambient temperature of 25 °C. Core temperature measured every minute with radio-telemetry. Modified from [25]. B. Frequency distribution of core temperature measured by telemetry for humans and a strain of mice. Data were collected at 60 s intervals for 48 h. Mouse data modified from Gordon [25]. Human data (unpublished, courtesy of Dr. Nigel A. Taylor).
Fig. 4.
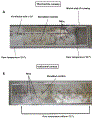
Examples of how the ambient temperature of the vivarium affects the quality of a nest built from cotton nestlets. Nests at 22 and 30 °C are relatively well constructed and mice are essentially protected beneath the cotton. At 32 °C the nest is not as intricate and there is a larger opening. At 34 °C, the nestlets are shredded but not nest is built, suggesting a marked effect of heat stress. Core temperatures of these mice presented in Fig. 2A,B. Gordon (unpublished).
Fig. 5.
The 24-hour pattern of selected ambient temperature of individual and groups of five female C57Bl/6 mice that were housed in a temperature gradient. Modified from [19].
Fig. 6.
Pictures of groups of three female BALB/c mice housed in a specialized temperature gradient constructed from an aluminum runway with a floor temperature of 22–38 °C (A) or in an identical aluminum runway maintained at an isothermal temperature of 22 °C (B). Pictures were taken during the daytime when mice were sleeping. Note well-built nest of mice in the 22 °C isothermal runway versus poorly constructed nest of mice in the temperature gradient and preference to sleep on the bare aluminum floor. Modified from [26,27]
Fig. 7.
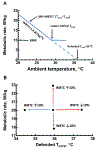
A. A theoretical ambient temperature-metabolism plot for a single mouse with a minimal, resting (or basal) metabolic rate (MR) of 10 W/kg and WBTC of 1.4 W/Kg/°C (I.e., slope of line) and defended core temperature of 36 °C. Dashed line is extrapolation of to an MR = 0 as predicted by the model of [47]. B. Predictive changes in MR from A with a 10% change in WBTC while the defended core temperature is either fixed or allowed to change. When defended core temperature is held at 36 °C, an increase in WBTC (dashed red line) leads to increase in MR and decrease in WBTC (dashed blue line) leads to a reduction in MR. However, if core temperature decreases when WBTC increases (solid blue line), MR is unchanged; or when core temperature increases with decrease in WBTC (solid red line), MR is unchanged. (For interpretation of the references to colour in this figure legend, the reader is referred to the web version of this article.)
Fig. 8.
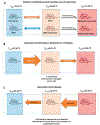
A. A pictorial of the relationships between core and preferred ambient temperature for a mouse and human wearing personal protective equipment (PPE) commonly used in an animal vivarium at a ambient temperature of 20 °C. Under these conditions, the gradient between core and ambient temperature is ideal for the human but a cold stress for the mouse. B. Raising ambient temperature to 30 °C reduces the gradient for both mouse and human creating a situation of ideal thermal comfort for the mouse but relatively uncomfortable heat stress for the human wearing PPE.
Fig. 9.
A–E. Depictions of core temperature and behavioral thermoregulatory responses of mice when subjected to various scenarios and treatments. Width of the orange and blue arrows represent relative intensity of behavioral thermoregulatory response to seek a warm or cool temperature, respectively. Black arrows represent forcing mouse from a comfortable to a hot environment. Temperatures on mice indicate the approximate core temperatures. See text for details. See Gordon [14,22]. (For interpretation of the references to colour in this figure legend, the reader is referred to the web version of this article.)
Similar articles
- Thermal biology of the laboratory rat.
Gordon CJ. Gordon CJ. Physiol Behav. 1990 May;47(5):963-91. doi: 10.1016/0031-9384(90)90025-y. Physiol Behav. 1990. PMID: 2201986 Review. - Thermoregulatory responses of two mouse Mus musculus strains selectively bred for high and low food intake.
Selman C, Korhonen TK, Bünger L, Hill WG, Speakman JR. Selman C, et al. J Comp Physiol B. 2001 Nov;171(8):661-8. doi: 10.1007/s003600100217. J Comp Physiol B. 2001. PMID: 11765975 - Effects of thermal stress during rest and exercise in the paediatric population.
Falk B. Falk B. Sports Med. 1998 Apr;25(4):221-40. doi: 10.2165/00007256-199825040-00002. Sports Med. 1998. PMID: 9587181 Review. - Temperature matters: the potential impact of thermoregulatory mechanisms in brain-body physiology.
Repasky EA, Hylander BL, Mohammadpour H. Repasky EA, et al. Genes Dev. 2024 Oct 16;38(17-20):817-819. doi: 10.1101/gad.352294.124. Genes Dev. 2024. PMID: 39362777 Free PMC article. Review. - Thyroid hormone fluctuations indicate a thermoregulatory function in both a tropical (Alouatta palliata) and seasonally cold-habitat (Macaca fuscata) primate.
Thompson CL, Powell BL, Williams SH, Hanya G, Glander KE, Vinyard CJ. Thompson CL, et al. Am J Primatol. 2017 Nov;79(11). doi: 10.1002/ajp.22714. Epub 2017 Oct 19. Am J Primatol. 2017. PMID: 29048740
Cited by
- Lethal versus surviving sepsis phenotypes displayed a partly differential regional expression of neurotransmitters and inflammation and did not modify the blood-brain barrier permeability in female CLP mice.
Azizian-Farsani F, Weixelbaumer K, Mascher D, Klang A, Högler S, Dinhopl N, Bauder B, Weissenböck H, Tichy A, Schmidt P, Mascher H, Osuchowski MF. Azizian-Farsani F, et al. Intensive Care Med Exp. 2024 Nov 4;12(1):96. doi: 10.1186/s40635-024-00688-7. Intensive Care Med Exp. 2024. PMID: 39497013 Free PMC article. - Intrinsic temperature increase drives lipid metabolism towards ferroptosis evasion and chemotherapy resistance in pancreatic cancer.
de Laat V, Topal H, Spotbeen X, Talebi A, Dehairs J, Idkowiak J, Vanderhoydonc F, Ostyn T, Zhao P, Jacquemyn M, Wölk M, Sablina A, Augustyns K, Vanden Berghe T, Roskams T, Daelemans D, Fedorova M, Topal B, Swinnen JV. de Laat V, et al. Nat Commun. 2024 Oct 2;15(1):8540. doi: 10.1038/s41467-024-52978-z. Nat Commun. 2024. PMID: 39358362 Free PMC article. - Postnatal hypoxic preconditioning attenuates lung damage from hyperoxia in newborn mice.
Millan I, Pérez S, Rius-Pérez S, Asensi MÁ, Vento M, García-Verdugo JM, Torres-Cuevas I. Millan I, et al. Pediatr Res. 2024 Sep 24. doi: 10.1038/s41390-024-03457-0. Online ahead of print. Pediatr Res. 2024. PMID: 39317699 - The Impact of DAZZEON αSleep® Far-Infrared Blanket on Sleep, Blood Pressure, Vascular Health, Muscle Function, Inflammation, and Fatigue.
Lee MC, Ho CS, Hsu YJ, Kan NW, Fei CY, Yang HJ, Huang CC. Lee MC, et al. Clocks Sleep. 2024 Sep 4;6(3):499-516. doi: 10.3390/clockssleep6030033. Clocks Sleep. 2024. PMID: 39311228 Free PMC article. - Huddling substates in mice facilitate dynamic changes in body temperature and are modulated by Shank3b and Trpm8 mutation.
Landen JG, Vandendoren M, Killmer S, Bedford NL, Nelson AC. Landen JG, et al. Commun Biol. 2024 Sep 20;7(1):1186. doi: 10.1038/s42003-024-06781-7. Commun Biol. 2024. PMID: 39304735 Free PMC article.
References
- Aschoff J, Thermal conductance in mammals and birds: its dependence on body size and circadian phase, Comp. Biochem. Physiol 69A (1981) 611–619.
- Blessing W, Mohammed M, Ootsuka Y, Brown adipose tissue thermogenesis, the basic rest-activity cycle, meal initiation, and bodily homeostasis in rats, Physiol. Behav 121 (2013) 61–69. - PubMed
Publication types
MeSH terms
LinkOut - more resources
Full Text Sources
Other Literature Sources
