Specification and Diversification of Pericytes and Smooth Muscle Cells from Mesenchymoangioblasts - PubMed (original) (raw)
Specification and Diversification of Pericytes and Smooth Muscle Cells from Mesenchymoangioblasts
Akhilesh Kumar et al. Cell Rep. 2017.
Abstract
Elucidating the pathways that lead to vasculogenic cells, and being able to identify their progenitors and lineage-restricted cells, is critical to the establishment of human pluripotent stem cell (hPSC) models for vascular diseases and development of vascular therapies. Here, we find that mesoderm-derived pericytes (PCs) and smooth muscle cells (SMCs) originate from a clonal mesenchymal progenitor mesenchymoangioblast (MB). In clonogenic cultures, MBs differentiate into primitive PDGFRβ+CD271+CD73- mesenchymal progenitors, which give rise to proliferative PCs, SMCs, and mesenchymal stem/stromal cells. MB-derived PCs can be further specified to CD274+ capillary and DLK1+ arteriolar PCs with a proinflammatory and contractile phenotype, respectively. SMC maturation was induced using a MEK inhibitor. Establishing the vasculogenic lineage tree, along with identification of stage- and lineage-specific markers, provides a platform for interrogating the molecular mechanisms that regulate vasculogenic cell specification and diversification and manufacturing well-defined mural cell populations for vascular engineering and cellular therapies from hPSCs.
Keywords: development; mesenchymoangioblast; pericytes; pluripotent stem cells; smooth muscles.
Copyright © 2017 The Author(s). Published by Elsevier Inc. All rights reserved.
Figures
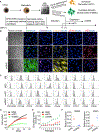
Figure 1.. Characterization of imPCs and imSMCs Generated from hPSCs through the MB Pathway
(A) Schematic diagram of the differentiation protocol used to generate imPCs and imSMCs from hPSCs. Following mesoderm induction, hPSCs were transferred into semisolid medium with FGF2 to induce formation of MB colonies. MB colonies were collected on day 12 of clonogenic culture and plated on fibronectin and collagen-coated plastic in the presence of the indicated factors to induce imSMCs and imPCs. After reaching a monolayer, imPC and imSMCs were passaged in Pericyte and EGM-2 medium, respectively. Photograph shows MB colony (scale bar, 50 μm). (B) Immunohistochemistry analysis of SMC and PC markers in MSCs, imPCs, and imSMCs derived from H1 hESCs. Nuclei (blue) were co-stained with DAPI. Scale bar, 50 μm. MSCs were generated from MB colonies by culture in serum-free medium with FGF2 (Vodyanik et al., 2010). (C) Flow cytometry analysis of MB-derived mesenchymal colonies (MB), MSCs, imPCs, and SMCs. (D) Expansion potential of MB-derived MSCs, imPCs, and imSMCs; representative experiment is shown. (E) Doubling time of MB-derived mesenchymal cells. Results are mean ± SE of three independent experiments. (F) qRT-PCR analysis of RGS5 and CNN1 expression in imPCs and imSMCs obtained from individual MB colonies. Each dot on the graph represents values by imPCs or imSMCs obtained from an individual MB colony. Horizontal lines show average expression levels for all tested colonies (n = 10). Images in (B) and histograms in (C) are representative of ten experiments. See also Figures S1–S3.
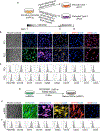
Figure 2.. Generation and Characterization of PC1, PC2, and mSMCs
(A) Schematic illustration of the strategy used for induction of PC1 and PC2 from imPCs. (B) Immunohistochemistry analysis of SMC and PC markers in PC1 and PC2. Nuclei (blue) were co-stained with DAPI. Scale bar, 50 μm. (C) Flow cytometry analysis of PC1 and PC2. (D) Schematic illustration of the strategy used for the induction of SMC maturation. (E) Immunohistochemistry analysis of SMC and PC markers in mSMCs. Nuclei (blue) were co-stained with DAPI. Scale bar, 50 μm. (F) Flow cytometry analysis of mSMCs. Images in (B) and (E) and histograms in (C) and (F) are representative of three experiments.
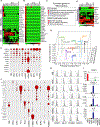
Figure 3.. Gene Expression Profiling Reveals a Unique Molecular Signature of MB-Derived Mural Cells
(A) Heatmap of a selected set of genes associated with the development of germ layers and their derivatives. MS, Mesenchyme; MSD, mesoderm; NEC, neuroectoderm; NC, neural crest. Gene expression is estimated in transcripts per million (tpm) values. (B) Heatmaps for the 24 representative genes uniquely overexpressed in MB colonies (MB) as compared to MB-derived mesenchymal cells (MSCs, PCs, and SMCs). A pool of 18 libraries representing triplicates of PC1, PC2, imPC, imSMC, mSMC, and MSC was used as a reference to detect MB-specific expression markers. (C) The classification of genes uniquely overexpressed in MB colonies as compared with downstream progeny. Enrichment scores (expressed as −log10(FDR)) for Gene Ontology (GO) and KEGG pathways are shown. (D) Heatmaps show the expression of genes associated with the most primitive mesenchymal cells (MS). (E) Balloon graph shows relative expression of typical PC and SMC genes in hPSC-derived mesenchymal cells. The largest area corresponds to 610.75 units. ACTA2 was downscaled four times for more representative visualization of other markers. (F) Balloon graph shows relative expression of selected genes differentially expressed in MB-derived MSCs and mural cells. The largest area corresponds to 2, 275 units. (G) PCA of transcriptome data for the 11 cell types (points are colored according to individual sample label). (H) Flow-cytometric analysis confirms the differences in the expression of the indicated molecules found by RNA-seq analysis. (I) qRT-PCR confirmed the differences in gene expression found by RNA-seq. Results shown are mean ± SE of three independent experiments (**p < 0.001, *p < 0.01). plPC, placental PC; brPC, brain PC; rPC, retinal PC; aoSMC, aortic SMC. Heatmaps in (A), (B), (C), and balloon graphs in (E) and (F) depict mean of three independent experiments with hPSC-derived mural cells, two independent experiments with aortic SMCs, and RNA-seq data of somatic PCs from a single experiment. See also Figures S4–S6.
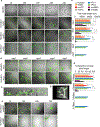
Figure 4.. Vascular Tube-Stabilizing Potential of MB-Derived Mural Cells
(A) HUVECs were cultured alone or cocultured with H9-EGFP hESC-derived MSCs, imPCs, or PKH67-labeled brain PCs (brPC) in pre-solidified Matrigel in EGM2 media. The cells were then photographed at the indicated time points using fluorescent microscope. Scale bar, 100 μm. (B) HUVECs were cocultured with H9-EGFP hESC-derived PC1 and PC2 photographed using fluorescent microscope at the indicated time points. Scale bar,100 μm. (C) Close-up view depicting tubular structures formed by HUVECs that are closely associated with PC1. Arrows point to PCs co-aligned with endothelial tubes. Scale bar, 10 μm. (D) 3D volumetric image of tubules formed by HUVECs in presence of PC1 (see also Movie S2). (E) HUVECs were cocultured with H9-EGFP hESC-derived imSMCs and mSMCs photographed using fluorescent microscope at the indicated time points. Scale bar, 100 μm. (F and G) Quantification of cumulative tube length (F) and retention of cumulative tube length (G) at indicated time intervals. Results are mean ± SE of three independent studies (*p < 0.01).
Figure 5.. Contractile Properties of MB-Derived Mural Cells and Aortic SMCs
(A) Representative images of MB-derived mesenchymal cells and aortic SMCs (aoSMC) (Lonza) before and 15 min after treatment with carbachol (1 μM). Cell cultures were photographed using a Nikon Eclipse Ti-E configured with an A1R confocal system and motorized stage. Scale bar, 50 μm. (B) Changes in individual cell area following treatment with carbachol. Horizontal lines show average changes in the area for all tested 16 cells. (C) Representative images of gel lattices seeded with MSCs, PCs, or SMCs after 48 hr of culture. (D) Assessment of basal contractile tone using collagen gel lattice contraction assay. The changes in lattice area were calculated by dividing the area at 48 hr of culture by the initial area of the lattice. Results are mean ± SE of three independent experiments (*p < 0.01).
Figure 6.. Matrigel Plug Assay Shows the Capacity of MB-Derived Mural Cells to Support the Vasculature Formation In Vivo
(A) Representative images of the Matrigel plug stained with anti-human CD31 antibodies (brown) and anti-GFP antibodies (green) following embedding HUVECs with EGFP+ mural cells. (B) The scatterplot with mean of lumen diameters. (C) Quantitative analysis of the total number of blood vessels per microscopic field. (D) Quantitative analysis of blood vessel coverage by vasculogenic cells. Results are mean ± SE of three independent experiments (*p < 0.01, **p < 0.001). The ampersand (&) denotes that SMCs support the formation of very small slit-like structures lacking blood cells. In contrast, PCs support the formation of neo-vessels containing blood cells.
Figure 7.. Proposed Model of Mesoderm-Derived Mural Cell Development from hPSCs
Distinctive phenotypic and gene (in italics) expression features are shown. Primitive posterior mesoderm (PPM) induced from hPSCs possess a potential to form FGF2-dependent compact spheroid colonies in semisolid medium with mesenchymal and endothelial cell potentials that define MBs. Development of MB colonies proceeds through a core stage at which highly motile PPM cells form clusters of tightly packed endothelial cells (day 3 of clonogenic culture), which subsequently undergo endothelial to mesenchymal transition giving rise to mesenchymal cells. These mesenchymal cells eventually form a shell around the core, resulting in development of spheroid MB colony (day 12 of clonogenic culture) composed of the primitive PDGFRβ+CD271+CD73− multipotential mesenchymal progenitors. When MB colonies are collected, and cultured in adherent conditions in the presence of the listed factors, they give rise to MSCs, imPCs, and imSMCs. The emerging imPCs could be further specified into CD274+ capillary PC1 and DLK1+ arteriolar PC2 with pro-inflammatory and contractile phenotype, respectively. Treatment of imSMCs with MEK inhibitor induces their maturation.
Similar articles
- The mesenchymoangioblast, mesodermal precursor for mesenchymal and endothelial cells.
Slukvin II, Kumar A. Slukvin II, et al. Cell Mol Life Sci. 2018 Oct;75(19):3507-3520. doi: 10.1007/s00018-018-2871-3. Epub 2018 Jul 10. Cell Mol Life Sci. 2018. PMID: 29992471 Free PMC article. Review. - Mesenchymal stromal cells: inhibiting PDGF receptors or depleting fibronectin induces mesodermal progenitors with endothelial potential.
Ball SG, Worthington JJ, Canfield AE, Merry CL, Kielty CM. Ball SG, et al. Stem Cells. 2014 Mar;32(3):694-705. doi: 10.1002/stem.1538. Stem Cells. 2014. PMID: 24022915 Free PMC article. - Vascular progenitor cells isolated from human embryonic stem cells give rise to endothelial and smooth muscle like cells and form vascular networks in vivo.
Ferreira LS, Gerecht S, Shieh HF, Watson N, Rupnick MA, Dallabrida SM, Vunjak-Novakovic G, Langer R. Ferreira LS, et al. Circ Res. 2007 Aug 3;101(3):286-94. doi: 10.1161/CIRCRESAHA.107.150201. Epub 2007 Jun 14. Circ Res. 2007. PMID: 17569886 - Vascular wall-resident CD44+ multipotent stem cells give rise to pericytes and smooth muscle cells and contribute to new vessel maturation.
Klein D, Weisshardt P, Kleff V, Jastrow H, Jakob HG, Ergün S. Klein D, et al. PLoS One. 2011;6(5):e20540. doi: 10.1371/journal.pone.0020540. Epub 2011 May 26. PLoS One. 2011. PMID: 21637782 Free PMC article. - Engineering Brain-Specific Pericytes from Human Pluripotent Stem Cells.
Jeske R, Albo J, Marzano M, Bejoy J, Li Y. Jeske R, et al. Tissue Eng Part B Rev. 2020 Aug;26(4):367-382. doi: 10.1089/ten.TEB.2020.0091. Tissue Eng Part B Rev. 2020. PMID: 32571167 Free PMC article. Review.
Cited by
- Absence of Cold-Inducible RNA-Binding Protein (CIRP) Promotes Angiogenesis and Regeneration of Ischemic Tissue by Inducing M2-Like Macrophage Polarization.
Kübler M, Beck S, Fischer S, Götz P, Kumaraswami K, Ishikawa-Ankerhold H, Lasch M, Deindl E. Kübler M, et al. Biomedicines. 2021 Apr 7;9(4):395. doi: 10.3390/biomedicines9040395. Biomedicines. 2021. PMID: 33916904 Free PMC article. - Lymphotoxin beta receptor signaling directly controls airway smooth muscle deregulation and asthmatic lung dysfunction.
Miki H, Kiosses WB, Manresa MC, Gupta RK, Sethi GS, Herro R, Da Silva Antunes R, Dutta P, Miller M, Fung K, Chawla A, Dobaczewska K, Ay F, Broide DH, Tumanov AV, Croft M. Miki H, et al. J Allergy Clin Immunol. 2023 Apr;151(4):976-990.e5. doi: 10.1016/j.jaci.2022.11.016. Epub 2022 Dec 5. J Allergy Clin Immunol. 2023. PMID: 36473503 Free PMC article. - Mutated LRRK2 induces a reactive phenotype and alters migration in human iPSC-derived pericyte-like cells.
Peltonen S, Sonninen TM, Niskanen J, Koistinaho J, Ruponen M, Lehtonen Š. Peltonen S, et al. Fluids Barriers CNS. 2024 Nov 18;21(1):92. doi: 10.1186/s12987-024-00592-y. Fluids Barriers CNS. 2024. PMID: 39551752 Free PMC article. - Transplantation of hPSC-derived pericyte-like cells promotes functional recovery in ischemic stroke mice.
Sun J, Huang Y, Gong J, Wang J, Fan Y, Cai J, Wang Y, Qiu Y, Wei Y, Xiong C, Chen J, Wang B, Ma Y, Huang L, Chen X, Zheng S, Huang W, Ke Q, Wang T, Li X, Zhang W, Xiang AP, Li W. Sun J, et al. Nat Commun. 2020 Oct 15;11(1):5196. doi: 10.1038/s41467-020-19042-y. Nat Commun. 2020. PMID: 33060592 Free PMC article. - Methods to label, image, and analyze the complex structural architectures of microvascular networks.
Corliss BA, Mathews C, Doty R, Rohde G, Peirce SM. Corliss BA, et al. Microcirculation. 2019 Jul;26(5):e12520. doi: 10.1111/micc.12520. Epub 2019 Jan 17. Microcirculation. 2019. PMID: 30548558 Free PMC article. Review.
References
- Armulik A, Abramsson A, and Betsholtz C (2005). Endothelial/pericyte interactions. Circ. Res 97, 512–523. - PubMed
- Armulik A, Genové G, and Betsholtz C (2011). Pericytes: developmental, physiological, and pathological perspectives, problems, and promises. Dev. Cell 21, 193–215. - PubMed
MeSH terms
Substances
LinkOut - more resources
Full Text Sources
Other Literature Sources
Molecular Biology Databases
Research Materials
Miscellaneous


