Lokiarchaea are close relatives of Euryarchaeota, not bridging the gap between prokaryotes and eukaryotes - PubMed (original) (raw)
Lokiarchaea are close relatives of Euryarchaeota, not bridging the gap between prokaryotes and eukaryotes
Violette Da Cunha et al. PLoS Genet. 2017.
Abstract
The eocyte hypothesis, in which Eukarya emerged from within Archaea, has been boosted by the description of a new candidate archaeal phylum, "Lokiarchaeota", from metagenomic data. Eukarya branch within Lokiarchaeota in a tree reconstructed from the concatenation of 36 universal proteins. However, individual phylogenies revealed that lokiarchaeal proteins sequences have different evolutionary histories. The individual markers phylogenies revealed at least two subsets of proteins, either supporting the Woese or the Eocyte tree of life. Strikingly, removal of a single protein, the elongation factor EF2, is sufficient to break the Eukaryotes-Lokiarchaea affiliation. Our analysis suggests that the three lokiarchaeal EF2 proteins have a chimeric organization that could be due to contamination and/or homologous recombination with patches of eukaryotic sequences. A robust phylogenetic analysis of RNA polymerases with a new dataset indicates that Lokiarchaeota and related phyla of the Asgard superphylum are sister group to Euryarchaeota, not to Eukarya, and supports the monophyly of Archaea with their rooting in the branch leading to Thaumarchaeota.
Conflict of interest statement
The authors have declared that no competing interests exist.
Figures
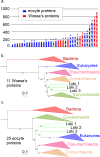
Fig 1. Comparison and concatenation of different subsets of the 36 universal proteins.
a. Diagram of the amino-acid lengths of the 36 universal proteins, obtained after alignment and trimming from the curated dataset (details in S1 Table). Ribosomal and non-ribosomal proteins are indicated in solid and hashed-bars, respectively. The markers for which the monophyly of Archaea was obtained in their phylogenetic tree are indicated in red, whereas those related to the paraphyly of Archaea are indicated in blue. * indicates alignments that statistically support in AU test the Woese’s or eocyte topology (in red and blue, respectively) b. Maximum Likelihood (ML) phylogenetic tree of the concatenation of the 11 Woese’s proteins (3,499 positions). c. ML phylogenetic tree of the concatenation of the 25 eocyte proteins (4,868 positions). Detailed trees in S3 and S4 Figs. The scale-bars represent the average number of substitutions per site. Values at nodes represent support calculated by nonparametric bootstrap (out of 100).
Fig 2. Eukaryotic-like insertions in the lokiarchaeal EF2 proteins.
a. ML phylogenetic tree of EF2 with the initial dataset (626 positions). The scale-bar represents the average number of substitutions per site. Values at nodes represent support calculated by nonparametric bootstrap (out of 100). b. Schematic representations of the three lokiarchaeal EF2 proteins with the five different domains indicated by colored lines and the positions of the specific eukaryotic insertions indicated blue triangles. c. Alignments of the 6 observed insertions of the EF2 protein (arCOG01559) are showed. Organisms’ names corresponding to Archaea and Eukarya are respectively indicated in black and blue, and lokiarchaeal sequences are surrounded in yellow. The A1, 2, 3 and C3 insertions are aligned with eukaryotic Ria sequences (EF2 paralog), whereas B3 and D3 are aligned with eukaryotic EF2 and Snu5 sequences (EF2 paralog), respectively. Detailed alignments in S13–S16 Figs.
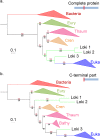
Fig 3. EF2 phylogenetic trees, based on the curated dataset after inclusion of bathyarchaeal sequences.
a. ML phylogenetic tree of the complete sequence (626 positions). b. ML phylogenetic tree of the C-terminal part only (394 positions). Eury, Thaum, Cren and Euka stand for Euryarchaeota, Thaumarchaeota, Crenarchaeota and Eukaryotes. Detailed trees in S17 and S18 Figs. The scale-bars represent the average number of substitutions per site. Values at nodes represent support calculated by nonparametric bootstrap (out of 100) and ultrafast bootstrap approximation (1,000 replicates), in black and red, respectively.
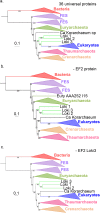
Fig 4. Impact of the EF2 protein on the original concatenated alignment.
a. ML phylogenetic tree of the original concatenated alignment of the 36 markers (10,547 positions). b. ML phylogenetic tree of the original concatenated alignment after removal of the EF2 protein (9,831 positions). c. ML phylogenetic tree of the original concatenated alignment after removal of the Loki 3 EF2 sequence (10,547 positions). Detailed trees in S19, S21 and S23 Figs. The scale-bars represent the average number of substitutions per site. Values at nodes represent support calculated by nonparametric bootstrap (out of 100).
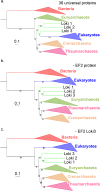
Fig 5. Impact of the EF2 protein on the concatenation of the curated datasets.
a. ML phylogenetic tree of the concatenated curated datasets (8,367 positions). b. ML phylogenetic tree of the concatenated curated datasets after removal of the EF2 protein (7,724 positions). c. ML phylogenetic tree of the concatenated curated datasets after removal of the Loki 3 EF2 sequence (8,425 positions). Detailed trees in S20, S22 and S25 Figs. The scale-bars represent the average number of substitutions per site. Values at nodes represent support calculated by nonparametric bootstrap (out of 100).
Fig 6. Position of Candidatus Thorarchaeota archaea in the Tree of Life.
ML phylogenetic tree of the concatenated alignments of the 34 markers present in the two most complete thorarchaeal genomes. Detailed tree in S28 Fig. The scale-bar represents the average number of substitutions per site. Values at nodes represent support calculated by nonparametric bootstrap (out of 100).
Fig 7. RNA polymerase phylogeny.
Bayesian phylogeny (LG model + Γ4) of the concatenated alignments of the two largest RNA polymerase subunits (1,463 positions) from an equal number (39) of Archaea, Eukaryotes (blue) and Bacteria (red). Among the Archaea, Thaumarchaeota, Crenarchaeota, group I Euryarchaeota and group II Euryarchaeota are indicated in pink, orange, light-green and dark-green, respectively. Values at nodes represent the Bayesian posterior probabilities. Detailed tree in S30 Fig. See S31 Fig for CAT-GTR model tree, and S32 Fig for ML tree. The scale-bar represents the average number of substitutions per site. A red arrow indicates the Lokiarchaea position in the tree. The A subunit status (split or fused) is indicated by adjacency of colored squares. The green arrow indicates the position of the split event among the archaeal phylogeny.
Fig 8. RNA polymerase phylogeny with the Asgards archaea.
Tree representing the combined phylogenies obtained in ML (LG model + Γ4) and Bayesian inference (CAT-GTR model) analyses of the two largest RNA polymerase subunits after inclusion of the Asgards archaea in the dataset (detailed trees in S36 and S37 Figs). Bacterial and eukaryotic sequences are indicated in red and blue, respectively. Among the Archaea, Thaumarchaeota, Crenarchaeota, and Euryarchaeota are indicated in pink, orange, and olive-green respectively. Values over the branches (in black) correspond to the posterior probabilities (PP) of the corresponding nodes obtained from Bayesian inferences, while the values below the branches (in grey) represent supports calculated by non parametric bootstrap (BS) from the ML analysis. Branch lengths in this tree are derived from the tree obtained from the Bayesian inference (S37 Fig), and the scale-bar represents the average number of substitutions per site. From base to tips, the three * correspond to 0.95/53, 0.92/61, and 1/100, respectively (PP/BS).
Comment in
- Asgard archaea are the closest prokaryotic relatives of eukaryotes.
Spang A, Eme L, Saw JH, Caceres EF, Zaremba-Niedzwiedzka K, Lombard J, Guy L, Ettema TJG. Spang A, et al. PLoS Genet. 2018 Mar 29;14(3):e1007080. doi: 10.1371/journal.pgen.1007080. eCollection 2018 Mar. PLoS Genet. 2018. PMID: 29596421 Free PMC article. No abstract available. - Asgard archaea do not close the debate about the universal tree of life topology.
Da Cunha V, Gaia M, Nasir A, Forterre P. Da Cunha V, et al. PLoS Genet. 2018 Mar 29;14(3):e1007215. doi: 10.1371/journal.pgen.1007215. eCollection 2018 Mar. PLoS Genet. 2018. PMID: 29596428 Free PMC article. No abstract available. - The trickster microbes that are shaking up the tree of life.
Watson T. Watson T. Nature. 2019 May;569(7756):322-324. doi: 10.1038/d41586-019-01496-w. Nature. 2019. PMID: 31089235 No abstract available.
Similar articles
- The two-domain tree of life is linked to a new root for the Archaea.
Raymann K, Brochier-Armanet C, Gribaldo S. Raymann K, et al. Proc Natl Acad Sci U S A. 2015 May 26;112(21):6670-5. doi: 10.1073/pnas.1420858112. Epub 2015 May 11. Proc Natl Acad Sci U S A. 2015. PMID: 25964353 Free PMC article. - [Progress in elucidating the origin of eukaryotes].
Gao ZW, Wang L. Gao ZW, et al. Yi Chuan. 2020 Oct 20;42(10):929-948. doi: 10.16288/j.yczz.20-107. Yi Chuan. 2020. PMID: 33229320 Review. Chinese. - The effects of model choice and mitigating bias on the ribosomal tree of life.
Lasek-Nesselquist E, Gogarten JP. Lasek-Nesselquist E, et al. Mol Phylogenet Evol. 2013 Oct;69(1):17-38. doi: 10.1016/j.ympev.2013.05.006. Epub 2013 May 22. Mol Phylogenet Evol. 2013. PMID: 23707703 - Asgard archaea illuminate the origin of eukaryotic cellular complexity.
Zaremba-Niedzwiedzka K, Caceres EF, Saw JH, Bäckström D, Juzokaite L, Vancaester E, Seitz KW, Anantharaman K, Starnawski P, Kjeldsen KU, Stott MB, Nunoura T, Banfield JF, Schramm A, Baker BJ, Spang A, Ettema TJ. Zaremba-Niedzwiedzka K, et al. Nature. 2017 Jan 19;541(7637):353-358. doi: 10.1038/nature21031. Epub 2017 Jan 11. Nature. 2017. PMID: 28077874 - Two or three domains: a new view of tree of life in the genomics era.
Zhou Z, Liu Y, Li M, Gu JD. Zhou Z, et al. Appl Microbiol Biotechnol. 2018 Apr;102(7):3049-3058. doi: 10.1007/s00253-018-8831-x. Epub 2018 Feb 27. Appl Microbiol Biotechnol. 2018. PMID: 29484479 Review.
Cited by
- The emerging view on the origin and early evolution of eukaryotic cells.
Vosseberg J, van Hooff JJE, Köstlbacher S, Panagiotou K, Tamarit D, Ettema TJG. Vosseberg J, et al. Nature. 2024 Sep;633(8029):295-305. doi: 10.1038/s41586-024-07677-6. Epub 2024 Sep 11. Nature. 2024. PMID: 39261613 Review. - The dynamic history of prokaryotic phyla: discovery, diversity and division.
Pallen MJ. Pallen MJ. Int J Syst Evol Microbiol. 2024 Sep;74(9):006508. doi: 10.1099/ijsem.0.006508. Int J Syst Evol Microbiol. 2024. PMID: 39250184 Review. - The Last Universal Common Ancestor of Ribosome-Encoding Organisms: Portrait of LUCA.
Forterre P. Forterre P. J Mol Evol. 2024 Oct;92(5):550-583. doi: 10.1007/s00239-024-10186-9. Epub 2024 Aug 19. J Mol Evol. 2024. PMID: 39158619 Review. - Carl Woese: Still ahead of our time.
Forterre P. Forterre P. mLife. 2022 Dec 14;1(4):359-367. doi: 10.1002/mlf2.12049. eCollection 2022 Dec. mLife. 2022. PMID: 38818481 Free PMC article. No abstract available. - The expanding Asgard archaea and their elusive relationships with Eukarya.
Da Cunha V, Gaïa M, Forterre P. Da Cunha V, et al. mLife. 2022 Mar 24;1(1):3-12. doi: 10.1002/mlf2.12012. eCollection 2022 Mar. mLife. 2022. PMID: 38818326 Free PMC article.
References
- Embley TM, Martin W. Eukaryotic evolution, changes and challenges. Nature. 2006;440: 623–630. doi: 10.1038/nature04546 - DOI - PubMed
- Criscuolo A, Gribaldo S. BMGE (Block Mapping and Gathering with Entropy): a new software for selection of phylogenetic informative regions from multiple sequence alignments. BMC Evol Biol. 2010;10: 210 doi: 10.1186/1471-2148-10-210 - DOI - PMC - PubMed
- Martijn J, Ettema TJG. From archaeon to eukaryote: the evolutionary dark ages of the eukaryotic cell. Biochem Soc Trans. 2013;41: 451–7. doi: 10.1042/BST20120292 - DOI - PubMed
- Forterre P. The common ancestor of archaea and eukarya was not an archaeon. Archaea. 2013;2013 doi: 10.1155/2013/372396 - DOI - PMC - PubMed
- Forterre P. The universal tree of life: An update. Front Microbiol. 2015;6: 1–18. doi: 10.3389/fmicb.2015.00717 - DOI - PMC - PubMed
MeSH terms
Substances
LinkOut - more resources
Full Text Sources
Other Literature Sources
Miscellaneous


