Chromosome Mis-segregation Generates Cell-Cycle-Arrested Cells with Complex Karyotypes that Are Eliminated by the Immune System - PubMed (original) (raw)
Chromosome Mis-segregation Generates Cell-Cycle-Arrested Cells with Complex Karyotypes that Are Eliminated by the Immune System
Stefano Santaguida et al. Dev Cell. 2017.
Abstract
Aneuploidy, a state of karyotype imbalance, is a hallmark of cancer. Changes in chromosome copy number have been proposed to drive disease by modulating the dosage of cancer driver genes and by promoting cancer genome evolution. Given the potential of cells with abnormal karyotypes to become cancerous, do pathways that limit the prevalence of such cells exist? By investigating the immediate consequences of aneuploidy on cell physiology, we identified mechanisms that eliminate aneuploid cells. We find that chromosome mis-segregation leads to further genomic instability that ultimately causes cell-cycle arrest. We further show that cells with complex karyotypes exhibit features of senescence and produce pro-inflammatory signals that promote their clearance by the immune system. We propose that cells with abnormal karyotypes generate a signal for their own elimination that may serve as a means for cancer cell immunosurveillance.
Keywords: aneuploidy; cancer; genome instability; immune system; senescence.
Copyright © 2017 Elsevier Inc. All rights reserved.
Figures
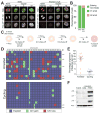
Figure 1. p53 activation is not an obligatory consequence of chromosome mis-segregation
(A) Representative images of hTERT RPE1 cells co-expressing PCNA::GFP and RFP::H2B. Unsynchronized cells were treated with DMSO or 0.5 μM reversine and then immediately filmed for 48h. Cells were filmed every 5 min for 6 hrs to capture mitotic mis-segregation events and then every 20 min for 42 hrs to capture daughter cell S phase timing. Scale bar 5 μm. (B) Daughter cell fate in NMS-P715-treated hTERT RPE1 cells co-expressing PCNA::GFP and RFP::H2B. Unsynchronized cells were treated with DMSO or 1μM NMS-P715 and immediately filmed as described in (A). Bars represent percentage of daughter cells with the indicated cell fate. (C–E) Schematic representation of experimental method used to separate cells that arrest in G1 following chromosome mis-segregation from cells that continue to divide (C). RPE-1 cells were synchronized at the G1/S transition by thymidine treatment. Six hours after Thymidine release, cells were treated with 0.5 μM reversine for 12 hours. Six hours later cells were treated with nocodazole. 12 hours later, mitotic cells were removed by shake-off and single cells that detached from the plate were sequenced to determine the karyotype of cells that continue to proliferate after chromosome mis-segregation (cycling). The cells that were not removed by shake-off were placed into fresh medium containing nocodazole. This procedure was repeated three times in order to remove all dividing cells. The cells that remained attached to the plate represented arrested cells (arrested) and their karyotype was determined by single cell sequencing. Heat map in (D) shows chromosome gains and losses in the indicated cell populations. Partially colored boxes represent segmental aneuploidies and are marked as “yes” in the column SA (for segmental aneuploidies). The graph in (E) shows the degree of genome imbalance, defined as the total number of genes that are either gained or lost as a consequence of whole chromosome and segmental aneuploidies (mean ± SEM). (F) RPE-1 cells were synchronized at the G1/S transition by thymidine treatment. Six hours after Thymidine wash-out, cells were treated with 0.5μM reversine or DMSO (vehicle control) for 12 hours. After drug wash-out, cells were grown for 66 hours (for a total of 72 hours after mitosis) to generate populations of aneuploid dividing cells (aneuploid cycling). Arrested aneuploid cells were generated as described in Figure 1C. The levels of p53, p21 and p16 were determined by Western blot analysis. Actin served as a loading control. See also Figure S1, S2
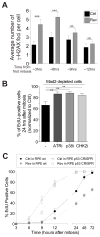
Figure 2. DNA damage incurred during chromosome mis-segregation causes p53 activation
(A) RPE-1 cells were synchronized at the G1/S transition by thymidine treatment. After Thymidine wash-out, cells were treated with 0.5μM reversine or DMSO (vehicle control). The average number of γ-H2AX foci per cell was determined at the indicated times (mean ± SEM). ***: p value < 0.0001; **; NS: not significant, analysis of variance plus Bonferroni’s test. F test of variance: 3 hour time point: 7.54718E-05; 6 hour time point: 0.002922704 (B) RPE-1 cells were exposed to a single round of siRNA-mediated depletion of Mad2 or control (Ctrl) oligo followed by thymidine arrest. 14h after thymidine wash-out (which corresponds roughly to 2 hours after mitosis), control- and Mad2-depleted cells were exposed to the indicated kinase inhibitors and EdU. The percentage of EdU-positive cells was determined 36 hours after thymidine release (~24 hours after mitosis). The graph shows the percentage of EdU-positive cells normalized to control-depleted cells. The following small molecule inhibitors were used: VE821 (ATR inhibitor, working concentration 1 μM), SB203580 (p38 inhibitor, working concentration 10 μM), Chk2 inhibitor II (Chk2 inhibitor, working concentration 10 μM). Graph shows mean ± SEM. ***: p value < 0.0001, analysis of variance plus Bonferroni’s test. (C) RPE-1 cells, either wild type for p53 or lacking the tumorsuppressor (p53 CRISPR), were synchronized at the G1/S transition by thymidine treatment. After thymidine wash-out, cells were treated with 0.5 μM reversine or DMSO (vehicle control). 14 hours later, the drug was washed-out and cells were exposed to EdU. Percentage of EdU-positive cells was determined at the indicated times. Graph shows mean ± SEM. See also Figure S3
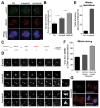
Figure 3. Chromosome mis-segregation causes replication stress
(A, B) RPE-1 cells were treated with reversine (0.5μM; aneuploid) or vehicle control (euploid) for 24 hours. The inhibitor was then washed out and cells were arrested in G1 by treatment with Mimosine for 24 hours. After Mimosine wash-out, cells were placed into fresh medium and three hours later pulse labeled with IdU (green) for 60 min and chased with CldU (red) for 60 min. Sample fiber images from euploid and aneuploid cells are shown in (A). Fork rate, fork density and fork stall rate are shown in (B). (C, D) Unsynchronized RPE-1 cells co-expressing PCNA::GFP and RFP::H2B were treated with DMSO or reversine (2 μM), imaged every 5 min for 5 hrs to capture mitotic mis-segregation events, and then imaged every 20 min for 48h to capture daughter cell S phase timing. Representative images of mother cell anaphase and one daughter cell S phase after treatment with DMSO or reversine are shown in (C). Quantification of the time interval from PCNA focus appearance to dissolution, a measure for S phase duration in living cells, is shown in (D). The analysis was performed on daughter cells whose mother cells divided prior to addition of reversine (reversine exposure occurred during G1) and on daughter cells whose mothers mis-segregated chromosomes in the presence of reversine (reversine exposure occurred during G2; mean ± SD). Scale bar 5 μm. (E, F) RPE-1 cells were treated with 0.5μM reversine or vehicle control for 24 hours. The drug was then washed out and cells were synchronized in G1 using Mimosine for 24 hours. After Mimosine wash-out, cells were placed into fresh medium and 53BP1 foci were analyzed 4 hours later. Representative images (E) and quantification (F) are shown. Scale bar 5 μm. See also Movie S1
Figure 4. Chromosome mis-segregation results in genomic instability
(A, B) RPE-1 cells were synchronized at the G1/S transition by thymidine treatment. Six hours after Thymidine release, cells were treated with control vehicle (euploid) or 0.5 μM reversine (aneuploid) for 12 hours. 12 hours after drug wash-out, cells were treated with the CDK1 inhibitor RO-3306 for 12 hours to enrich for G2 cells. Cells were then released in fresh medium containing nocodazole and γ-H2AX foci were analyzed 2 hours later. CREST is used to mark centromeres. As a positive control, cells were treated with aphidicolin 18 hours after thymidine release. Representative images are shown in (A). Quantification of γ-H2AX foci is shown in (B). γ-H2AX is in green, CREST in red, DNA in blue (mean ± SEM). Scale bar 10 μm. **: p value < 0.01, analysis of variance plus Bonferroni’s test. (C–F) RPE-1 cells stably expressing H2B-GFP were synchronized at the G1/S transition by thymidine treatment. Six hours after thymidine wash-out, cells were treated with control vehicle (euploid) or 0.5 μM reversine (aneuploid) for 12 hours. After drug wash-out, cells were filmed every 5′. Quantification of mitotic aberrations (lagging chromosomes and micronuclei) is shown in (E). Length of mitosis (nuclear envelope breakdown (NEBD) to DNA decondensation) is shown in (F; mean ± SEM). (G) Cells were grown as described in Figure 4A. After RO-3306 wash-out, cells were released into fresh medium and fixed 90′ later to analyze DNA bridges in anaphase. Representative images of DNA bridges are shown. PICH is in green, BLM in red, CREST in magenta, DNA in blue. Scale bar 10 μm. See also Figure S4 and Movie S2
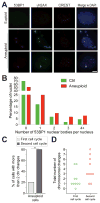
Figure 5. Chromosome mis-segregation triggers the evolution of complex abnormal karyotypes
(A, B) Cells were grown as described in Figure 4A. After RO-3306 wash-out, cells were released into fresh medium and fixed 6 hours later to analyze 53BP1 foci in the following G1. Representative images are shown. 53BP1 is in red, γ-H2AX in green, CREST in magenta, DNA in blue. Quantification of 53BP1 foci in G1 is shown in (B). Scale bar 5 μm. (C, D) Karyotype analysis after the first and second cell cycle following chromosome mis-segregation (see Figure S5 for experimental details). The percentage of cells with more than 2 chromosome changes (C) and the total number of chromosomal changes per cell (D) are shown for aneuploid cells after the first and second cell cycle following chromosome mis-segregation. *: p value < 0.05, Student’s t test. See also Figure S5
Figure 6. Chromosome mis-segregation causes the generation of cells with complex karyotypes that undergo senescence
(A) RPE-1 cells were treated with reversine or control vehicle for 24 hours. Cells were exposed for 12 hours to nocodazole either after wash-out or 24 hours later, to determine the ability of cells to enter mitosis during the first or second cell cycle following chromosome mis-segregation (mean ± SEM). (B) Schematic representation of the experimental method used to isolate arrested cells with complex karyotypes (see STAR methods for details). Shown below the cartoon is the percentage of cells that detached from the plate after each shake-off. (C) Aneuploid arrested cells were isolated as described in STAR methods. Cells were exposed to EdU after reversine wash-out, plated on coverslips after the fourth nocodazole shake-off and fixed 12 hours later to determine the percentage of EdU-positive cells. Graph shows mean ± SEM. (D, E) Aneuploid arrested cells were isolated as described in STAR methods and their karyotype determined by single cell sequencing. The heat map of chromosome gains and losses of arrested cells with complex karyotypes is shown in (D). Partially colored boxes represent segmental aneuploidies and are marked as “yes” in the column SA (for segmental aneuploidies). The graph in (E) shows the degree of genome imbalance, defined as the total number of genes that are either gained or lost as a consequence of whole chromosome and segmental aneuploidies (mean ± SEM). The “Cycling” sample is the same as presented in Figure 1E and is comprised of aneuploid cells able to divide. (F) RPE-1 cells were synchronized at the G1/S transition by thymidine treatment. Six hours after thymidine release, cells were treated with DMSO (euploid) or 0.5 μM reversine (aneuploid) for 12 hours. After wash-out, cells were placed into fresh medium and harvested 18 or 66 hours later, which corresponds to 24 and 72 hours after mitosis, respectively. Arrested cells were obtained as described in Figure 6B. The levels of p53, p21, p16 and γ-H2AX were determined by Western blot analysis. Actin served as a loading control. Euploid cells treated with doxorubicin for 6 or 12 hours were used as positive controls. Euploid and aneuploid samples represent cells that were initially treated with DMSO or 0.5 μM reversine, respectively. (G) Euploid, aneuploid cycling and aneuploid arrested cells were generated as described in STAR methods. The graph shows the quantification of γ-H2AX foci per cell. Euploid cells treated with doxorubicin for 12 hours were used as a positive control. Graph shows mean ± SEM. (H) Senescence-associated β-galactosidase (β-gal) activity was determined in euploid cells and arrested cells with complex karyotypes obtained as described in Figure 6B. (I) The percentage of cycling and arrested euploid or aneuploid RPE-1 cells, either wild type or lacking p53, was determined following the scheme shown in Figure 6B. Graph shows the percentage of arrested cells or cells recovered after the indicated mitotic shake-offs. See also Table S2, S3
Figure 7. Aneuploidy triggers an immune response
(A) Canonical pathway gene set (c2cp of msigdb) enrichment for up-regulated genes in arrested cells with complex karyotypes. Normalized enrichment scores (NES) for the top 7 up-regulated gene sets are shown. The columns on the right show the normalized enrichment score for these gene categories in gene expression data sets obtained from cells in which senescence was induced by DNA damage (Iannello et al., 2013; Krizhanovsky et al., 2008). (B) Cytokine levels were determined in supernatants of euploid and arrested cells with complex karyotypes (obtained as described in Figure 6B). Graph shows the cytokine fold change in arrested cells with complex karyotypes normalized to euploid cells (mean ± SEM). (C) Early passage wild-type and BUB1BH/H mouse embryonic fibroblasts were cultured and CCL2 levels were determined in culture supernatants. (D–G) MICA/B (D), CD155/PVR (E) and ULBP2 (F) cell surface levels in euploid cells and aneuploid arrested cells (obtained as described in Figure 6B). Euploid cells treated with doxorubicin (100 ng/ml, 48 hours) were used as a positive control for CD155/PVR and ULBP2 expression. Graphs show fluorescence intensity of cells of similar size (gating see Figure S7). IgG2A isotype control was used for MICA/B, ULBP2 and ULBP1 staining in euploid cells (Figure S7B). IgG1 isotype control was used for CD155/PVR and Nectin-2/CD112 in euploid cells (Figure S7A). Mean fluorescence intensities are listed in (G). (H) Euploid and arrested cells with complex karyotypes were generated as described in Figure 6B and levels of the indicated protein determined by enzyme-linked immunosorbent assay (mean ± SEM). (I) Euploid and arrested cells with complex karyotypes were generated as described in Figure 6B. Cells were co-cultured with NK92 cells at a target:effector ratio of 1:10 and filmed every 10′ for 36 hours. Representative images from live imaging datasets are shown. (J) Euploid and aneuploid arrested cells were generated as described in Figure 6B. Cells were seeded and allowed to attach to the plate for 12 hours, after which NK92 cells were introduced. At the indicated times, dead and NK92 cells were removed by gentle shake-off and the remaining cells were counted and are shown as a percentage of cells grown for the same time in the absence of NK92 cells (mean ± SD). ***: p value < 0.0001; *: p value < 0.05; NS: not significant, analysis of variance plus Bonferroni’s test. (K) Euploid and arrested cells with complex karyotypes and NK92 cells were cultured as in Figure 7J for 24 hours. For experiments with antibodies blocking NKG2D, NK92 cells were pre-incubated with 20 μg/ml anti-NKG2D antibody for three hours before co-culturing them with RPE-1 cells. Dead and NK92 cells were removed and the remaining cells were counted and normalized to cells grown under the same condition but without co-culture (mean ± SEM). ***: p value < 0.0001; NS: not significant, analysis of variance plus Bonferroni’s test. See also Figure S6, S7 and Movie S3
Comment in
- Aneuploidy Police Detect Chromosomal Imbalance Triggering Immune Crackdown!
Watson EV, Elledge SJ. Watson EV, et al. Trends Genet. 2017 Oct;33(10):662-664. doi: 10.1016/j.tig.2017.07.007. Epub 2017 Aug 8. Trends Genet. 2017. PMID: 28800914
Similar articles
- Generation and Isolation of Cell Cycle-arrested Cells with Complex Karyotypes.
Wang RW, MacDuffie E, Santaguida S. Wang RW, et al. J Vis Exp. 2018 Apr 13;(134):57215. doi: 10.3791/57215. J Vis Exp. 2018. PMID: 29708530 Free PMC article. - Short-term molecular consequences of chromosome mis-segregation for genome stability.
Garribba L, De Feudis G, Martis V, Galli M, Dumont M, Eliezer Y, Wardenaar R, Ippolito MR, Iyer DR, Tijhuis AE, Spierings DCJ, Schubert M, Taglietti S, Soriani C, Gemble S, Basto R, Rhind N, Foijer F, Ben-David U, Fachinetti D, Doksani Y, Santaguida S. Garribba L, et al. Nat Commun. 2023 Mar 11;14(1):1353. doi: 10.1038/s41467-023-37095-7. Nat Commun. 2023. PMID: 36906648 Free PMC article. - Recent insights into the causes and consequences of chromosome mis-segregation.
Devillers R, Dos Santos A, Destombes Q, Laplante M, Elowe S. Devillers R, et al. Oncogene. 2024 Oct;43(43):3139-3150. doi: 10.1038/s41388-024-03163-5. Epub 2024 Sep 15. Oncogene. 2024. PMID: 39278989 Review. - Quantifying chromosomal instability from intratumoral karyotype diversity using agent-based modeling and Bayesian inference.
Lynch AR, Arp NL, Zhou AS, Weaver BA, Burkard ME. Lynch AR, et al. Elife. 2022 Apr 5;11:e69799. doi: 10.7554/eLife.69799. Elife. 2022. PMID: 35380536 Free PMC article. - Aneuploidy and chromosomal instability: a vicious cycle driving cellular evolution and cancer genome chaos.
Potapova TA, Zhu J, Li R. Potapova TA, et al. Cancer Metastasis Rev. 2013 Dec;32(3-4):377-89. doi: 10.1007/s10555-013-9436-6. Cancer Metastasis Rev. 2013. PMID: 23709119 Free PMC article. Review.
Cited by
- Multinucleation associated DNA damage blocks proliferation in p53-compromised cells.
Hart M, Adams SD, Draviam VM. Hart M, et al. Commun Biol. 2021 Apr 9;4(1):451. doi: 10.1038/s42003-021-01979-5. Commun Biol. 2021. PMID: 33837239 Free PMC article. - Aneuploid senescent cells activate NF-κB to promote their immune clearance by NK cells.
Wang RW, Viganò S, Ben-David U, Amon A, Santaguida S. Wang RW, et al. EMBO Rep. 2021 Aug 4;22(8):e52032. doi: 10.15252/embr.202052032. Epub 2021 Jun 8. EMBO Rep. 2021. PMID: 34105235 Free PMC article. - Human aneuploid cells depend on the RAF/MEK/ERK pathway for overcoming increased DNA damage.
Zerbib J, Ippolito MR, Eliezer Y, De Feudis G, Reuveni E, Savir Kadmon A, Martin S, Viganò S, Leor G, Berstler J, Muenzner J, Mülleder M, Campagnolo EM, Shulman ED, Chang T, Rubolino C, Laue K, Cohen-Sharir Y, Scorzoni S, Taglietti S, Ratti A, Stossel C, Golan T, Nicassio F, Ruppin E, Ralser M, Vazquez F, Ben-David U, Santaguida S. Zerbib J, et al. Nat Commun. 2024 Sep 9;15(1):7772. doi: 10.1038/s41467-024-52176-x. Nat Commun. 2024. PMID: 39251587 Free PMC article. - Chromosomal Instability, Selection and Competition: Factors That Shape the Level of Karyotype Intra-Tumor Heterogeneity.
van den Bosch T, Derks S, Miedema DM. van den Bosch T, et al. Cancers (Basel). 2022 Oct 12;14(20):4986. doi: 10.3390/cancers14204986. Cancers (Basel). 2022. PMID: 36291770 Free PMC article. Review. - The Mitotic Apparatus and Kinetochores in Microcephaly and Neurodevelopmental Diseases.
Degrassi F, Damizia M, Lavia P. Degrassi F, et al. Cells. 2019 Dec 24;9(1):49. doi: 10.3390/cells9010049. Cells. 2019. PMID: 31878213 Free PMC article. Review.
References
Publication types
MeSH terms
Grants and funding
- R01 GM098815/GM/NIGMS NIH HHS/United States
- R01 HD085866/HD/NICHD NIH HHS/United States
- R01 GM074215/GM/NIGMS NIH HHS/United States
- HHMI/Howard Hughes Medical Institute/United States
- P30 CA014051/CA/NCI NIH HHS/United States
- T32 GM007753/GM/NIGMS NIH HHS/United States
- R01 GM056800/GM/NIGMS NIH HHS/United States
- R01 GM062207/GM/NIGMS NIH HHS/United States
- T32 CA067754/CA/NCI NIH HHS/United States
- R01 CA206157/CA/NCI NIH HHS/United States
- R35 GM118066/GM/NIGMS NIH HHS/United States
LinkOut - more resources
Full Text Sources
Other Literature Sources
Molecular Biology Databases
Miscellaneous


