De Novo Epigenetic Programs Inhibit PD-1 Blockade-Mediated T Cell Rejuvenation - PubMed (original) (raw)
De Novo Epigenetic Programs Inhibit PD-1 Blockade-Mediated T Cell Rejuvenation
Hazem E Ghoneim et al. Cell. 2017.
Abstract
Immune-checkpoint-blockade (ICB)-mediated rejuvenation of exhausted T cells has emerged as a promising approach for treating various cancers and chronic infections. However, T cells that become fully exhausted during prolonged antigen exposure remain refractory to ICB-mediated rejuvenation. We report that blocking de novo DNA methylation in activated CD8 T cells allows them to retain their effector functions despite chronic stimulation during a persistent viral infection. Whole-genome bisulfite sequencing of antigen-specific murine CD8 T cells at the effector and exhaustion stages of an immune response identified progressively acquired heritable de novo methylation programs that restrict T cell expansion and clonal diversity during PD-1 blockade treatment. Moreover, these exhaustion-associated DNA-methylation programs were acquired in tumor-infiltrating PD-1hi CD8 T cells, and approaches to reverse these programs improved T cell responses and tumor control during ICB. These data establish de novo DNA-methylation programming as a regulator of T cell exhaustion and barrier of ICB-mediated T cell rejuvenation.
Keywords: CD8 T cells; DNA methylation; DNA-demethylating agents; epigenetic modifications; exhaustion; immune-checkpoint blockade; tumor.
Copyright © 2017 Elsevier Inc. All rights reserved.
Figures
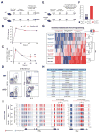
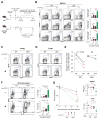
Figure 1. Whole-Genome methylation profiling of LCMV-specific WT and Dnmt3a-Deficient CD8 T Cells
(A) Experimental setup; CD4 T cells were depleted in WT and _Dnmt3a_-cKO mice prior to infection with LCMV clone 13. (B) Longitudinal summary graph of WT and Dnmt3a cKO mice serum viral titers during chronic LCMV infection. (C) Summary graph of gp33-specific CD8 T cell quantity in the peripheral blood of WT and cKO mice during chronic LCMV infection. (D) Representative FACS analysis of PD-1 expression on gp33-specific CD8 T cells from the spleens of WT and cKO mice after 2 months of chronic infection, gated on CD8+ T cells. Representative intracellular FACS analysis of IFNγ and IL-2 expression from gp33 peptide-stimulated CD44hi CD8 T cell splenocytes of chronically infected WT and cKO mice. (E) Experimental setup for performing whole-genome bisulfite sequencing (WGBS) methylation analysis of virus-specific CD8 T cells. (F) The number of newly methylated regions in gp33-specific effector or exhausted WT CD8 T cells. (G) Heat map showing cluster analysis of the top 3000 differentially methylated regions (DMRs) among naïve and LCMV-specific WT and cKO CD8 T cells at the effector and chronic stages of the immune response. Color intensity scales from red (methylated region) to blue (non-methylated region). (H) Summary table of ingenuity pathway analysis showing putative upstream regulators for Dnmt3a-targeted genes. (I) Nucleotide-resolution methylation profiling of the IFNγ and Myc loci in naïve and LCMV-specific CD8 T cells. Vertical blue and red lines indicate CpG positions in the loci. The ratio of blue to red indicates the percentage of unmethylated versus methylated reads, respectively, in the WGBS. N= 3–5 mice per group of two or more independent experiments. Error bars indicate SEM.
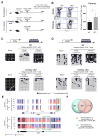
Figure 2. Exhaustion-Associated De Novo DNA Methylation Programs Are not Acquired during a Primary Acute Viral Infection
(A) Experimental setup for loci-specific methylation analysis of exhaustion-associated DMRs in functional versus exhausted virus-specific CD8 T cells. (B) Representative intracellular FACS analysis and summary graph of mean fluorescence intensity (MFI) for IFNγ and IL-2 expression among ex vivo stimulated (gp33-peptide) WT and cKO CD44hi CD8 T cells isolated 2 months post-acute (Armstrong strain) or chronic (Clone 13 strain) LCMV infection. (C) Schematic of CpG sites in the IFNγ and (D) Ccr7 loci. Loci-specific bisulfite sequencing analysis of the IFNγ and Ccr7 DMRs in naïve and tetramer+ CD8 T cells isolated from acutely and chronically infected WT and cKO mice. Horizontal lines represent individual sequenced clones from the pool of FACS-purified tetramer+ CD8 T cells. Filled circles, methylated cytosine; open circles, nonmethylated cytosine. (E) Nucleotide-resolution view of DNA methylation programs at IFNγ and Ccr7 loci from WGBS analyses of exhausted and functional memory WT CD8 T cells. (F) Venn diagram of WGBS data showing overlap between exhaustion-specific Dnmt3a- targeted loci and functional memory-specific demethylated loci among WT CD8 T cells. Error bars indicate SEM.
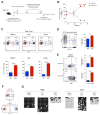
Figure 3. CD8 T cell-Intrinsic De Novo Programming Regulates Exhaustion
(A) Experimental setup for tracking congenically distinct WT and cKO P14 CD8 T cells in LCMV infected Rag1 KO mice. (B) Longitudinal measurement of WT and cKO P14 cell frequencies in the peripheral blood of chimeric Rag1 KO mice during chronic LCMV infection. (C) Representative FACS analysis and summary graphs of cKO (red) and WT (blue) P14 cell frequency in tissues of chronically infected chimeric Rag1 KO mice at 35 dpi. (D) Representative FACS analysis and summary graph of IFNγ expression frequency among cKO and WT P14 cells from spleens of chronically infected chimeric Rag1 KO mice. (E) Representative FACS analysis and summary graphs of intracellular TCF1 and Ki67 levels among cKO and WT P14 cells in spleens from chronically infected chimeric Rag1 KO mice. (F) Representative post-sort purity FACS analysis of cKO and WT P14 cells from spleens of chronically infected chimeric Rag1 KO mice. (G) Locus-specific DNA methylation analysis of the IFNγ and Tcf7 DMRs in naïve P14 cells from uninfected mice, and WT and cKO P14 splenocytes from chronically infected chimeric Rag1 KO mice. N = 3 mice per group of two independent experiments. Error bars indicate SEM.
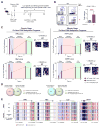
Figure 4. Exhaustion-Associated De Novo DNA-Methylation Programs are Preserved during PD-L1 Blockade Therapy
(A) Experimental setup for loci-specific bisulfite sequencing analysis of exhaustion-associated DMRs in virus-specific effector (isolated at 8 dpi with the chronic strain of LCMV), exhausted, and rejuvenated CD8 T cells. (B) Representative FACS analysis of CD44 expression and gp33 tetramer staining in CD8 T cells from the spleens of chronically infected WT after mock treatment or PD-1 blockade treatment. Summary graph of polyclonal (CD44hi PD-1+) virus-specific CD8 T cell fold expansion in the spleens of chronically infected WT mice after mock treatment (gray bar) or PD-1 blockade (red bar) treatment. Fold expansion was calculated relative to change in mock-treated WT mice. Error bars indicate SD. (C) Longitudinal loci-specific bisulfite sequencing analysis of de novo DNA methylation programs in antigen-specific WT CD8 T cells. Red bars represent the average percentage of DNA methylation of all CpG sites in the specified DMR at different time points during chronic virus infection. Representative methylation profiles are adjacent to the corresponding bar graphs. Error bars indicate SEM. (D) Venn diagrams of WGBS data showing overlap between Dnmt3a-mediated exhaustion- specific DMRs and PD-1 blockade–generated DMRs among WT CD8 T cells (top panel), and overlap between functional memory-related DMRs and PD-1 blockade–generated DMRs among WT CD8 T cells (bottom panel). (E) Nucleotide-resolution view of DNA methylation programs at IFNγ, Myc, Tcf7 and Tbx21 loci from WGBS analyses of exhausted WT CD8 T cells before and after PD-1 blockade. N= 3–5 mice per group of two independent experiments.
Figure 5. Inhibiting De Novo DNA Methylation Synergizes with PD-L1 Blockade
(A) Experimental setup of anti-PD-L1 treatment in chronically infected WT and Dnmt3a cKO mice. (B) Representative FACS analysis and summary graphs of gp33-, gp276-, and np396-specific CD8 T cell frequencies in the spleens of treated and untreated chronically infected WT and cKO mice; WT mock-treated = gray bars, WT anti–PD-L1–treated = red bars, cKO mock-treated = black bars, and cKO PD-1 blockade–treated = green bars. (C) Representative FACS analysis showing the frequencies of gp33-specific CD8 T cells in the lungs and (D) liver of chronically infected WT and cKO mice after mock or PD-1 blockade treatment. (E) Longitudinal analysis of the gp33-specific TCR repertoire Simpson’s diversity index among WT and cKO CD8 T cells isolated from the peripheral blood before and after PD-1 blockade treatment. (F) Representative intracellular FACS analysis of IFNγ and IL-2 expression from gp33-stimulated CD44hi CD8 T cell splenocytes of mock or PD-1 blockade-treated chronically infected WT and cKO mice. Summary graphs of fold change in quantity of total IFNγ-expressing or IFNγ and IL-2 co-expressing CD8 T cells from spleens of mock or PD-1 blockade–treated chronically infected WT and cKO mice. (G) Longitudinal measurement of viral titers in the serum and summary graphs of the viral titers in the spleen or liver of chronically infected WT and cKO mice after mock or PD-1 blockade treatment. Fold change was calculated relative to mock-treated WT mice. N= 3–5 mice per group of two independent experiments. Error bars indicate SEM.
Figure 6. DNA Demethylating Agent Treatment Prior to PD-L1 Blockade Enhances WT CD8 T-Cell Rejuvenation
(A) Experimental setup for sequential decitabine and anti-PD-L1 treatment during chronic LCMV infection. (B) Summary graph showing longitudinal tracking of gp33-specific CD8 T cell quantity in the peripheral blood of chronically LCMV-infected WT mice during mono- or sequentially combined decitabine and anti-PD-L1 treatments. (C) Summary graph of gp33-specific CD8 T cell fold expansion in the PBMC after mono PD-1 blockade therapy (red bar) or sequential decitabine and PD-1 blockade (blue bar) therapy. Fold change was calculated relative to corresponding cell numbers before anti-PD-L1 treatment. (D) Representative FACS analysis showing the frequencies of gp33-specific CD8 T cells in the spleen, lung, and liver tissues of chronically infected WT mice after indicated treatments. (E) Representative FACS analysis showing Ki67 levels in gp33-specific CD8 T cells in the spleens of chronically infected WT mice after indicated treatments. (F) Summary graph of the quantity of gp33-specific CD8 T cells in spleens of chronically LCMV-infected WT mice after indicated treatments. (G) Summary graphs of the frequencies of gp33-specific CD8 T cells in the lung and liver tissues of chronically infected WT mice after indicated treatments. (H) Summary graph of the frequencies of Ki67-expressing gp33-specific CD8 T cells in the spleens of chronically infected WT mice after indicated treatments. N= 3–5 mice per group of two independent experiments. Error bars indicate SEM.
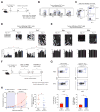
Figure 7. Tumor-Infiltrating CD8 T Cells Acquire Exhaustion-Associated DNA Methylation Programs
(A) Experimental setup for generating TRAMP-C2 tumor-bearing mice and loci-specific DNA methylation analysis of tumor-infiltrating CD8 T cells (TILs). (B) Representative FACS analysis of CD44, PD-1, CD62L, and Tim-3 expression on Tumor-specific Spas1+ TILs harvested after ≥ 45 days post-tumor inoculation. (C) Representative FACS analysis of PD-1 and Tim-3 expression on total TILs and post-sort purity check of FACS-purified PD-1hi and PD-1low TILs populations. (D) Loci-specific bisulfite sequencing methylation analysis and summary graphs of individual CpG sites in the Tcf7, Ccr7, (E) Myc and IFNγ loci among PD-1low and PD-1hi populations of TILs. Horizontal lines represent individual sequenced clones from the pool of FACS-purified TILs. Filled circles = methylated cytosine; open circles = nonmethylated cytosine. (F) Experimental setup of sequential decitabine and anti-PD-L1 treatment of TRAMP-C2 tumor-bearing mice starting at ≥ 1 month post-inoculation. (G) Representative FACS analysis and summary graphs of Ki67 levels among PD-1hi CD8+ TILs and tumor antigen-specific (Spas1+) TILs after mono PD-1 blockade or sequentially combined decitabine and anti-PD-L1 treatments. (H) Longitudinal measurement of tumor growth in WT mice receiving mono anti-PD-L1 (red), or sequentially combined decitabine and anti-PD-L1 (blue) treatments. Summary graph of normalized tumor volume after mono anti-PD-L1 (red) or combined decitabine and anti-PD-L1 (blue) treatments. N= 3–5 mice per group of two independent experiments. Error bars indicate SEM.
Comment in
- T Cell Exhaustion: An Epigenetically Imprinted Phenotypic and Functional Makeover.
Alfei F, Zehn D. Alfei F, et al. Trends Mol Med. 2017 Sep;23(9):769-771. doi: 10.1016/j.molmed.2017.07.006. Epub 2017 Aug 7. Trends Mol Med. 2017. PMID: 28797787
Similar articles
- Subsets of exhausted CD8+ T cells differentially mediate tumor control and respond to checkpoint blockade.
Miller BC, Sen DR, Al Abosy R, Bi K, Virkud YV, LaFleur MW, Yates KB, Lako A, Felt K, Naik GS, Manos M, Gjini E, Kuchroo JR, Ishizuka JJ, Collier JL, Griffin GK, Maleri S, Comstock DE, Weiss SA, Brown FD, Panda A, Zimmer MD, Manguso RT, Hodi FS, Rodig SJ, Sharpe AH, Haining WN. Miller BC, et al. Nat Immunol. 2019 Mar;20(3):326-336. doi: 10.1038/s41590-019-0312-6. Epub 2019 Feb 18. Nat Immunol. 2019. PMID: 30778252 Free PMC article. - Demethylation of the PD-1 Promoter Is Imprinted during the Effector Phase of CD8 T Cell Exhaustion.
Ahn E, Youngblood B, Lee J, Lee J, Sarkar S, Ahmed R. Ahn E, et al. J Virol. 2016 Sep 12;90(19):8934-46. doi: 10.1128/JVI.00798-16. Print 2016 Oct 1. J Virol. 2016. PMID: 27466420 Free PMC article. - Dual Relief of T-lymphocyte Proliferation and Effector Function Underlies Response to PD-1 Blockade in Epithelial Malignancies.
Balança CC, Scarlata CM, Michelas M, Devaud C, Sarradin V, Franchet C, Martinez Gomez C, Gomez-Roca C, Tosolini M, Heaugwane D, Lauzéral-Vizcaino F, Mir-Mesnier L, Féliu V, Valle C, Pont F, Ferron G, Gladieff L, Motton S, Tanguy Le Gac Y, Dupret-Bories A, Sarini J, Vairel B, Illac C, Siegfried-Vergnon A, Mery E, Fournié JJ, Vergez S, Delord JP, Rochaix P, Martinez A, Ayyoub M. Balança CC, et al. Cancer Immunol Res. 2020 Jul;8(7):869-882. doi: 10.1158/2326-6066.CIR-19-0855. Epub 2020 Apr 15. Cancer Immunol Res. 2020. PMID: 32295784 - CD8 T Cell Exhaustion in Chronic Infection and Cancer: Opportunities for Interventions.
Hashimoto M, Kamphorst AO, Im SJ, Kissick HT, Pillai RN, Ramalingam SS, Araki K, Ahmed R. Hashimoto M, et al. Annu Rev Med. 2018 Jan 29;69:301-318. doi: 10.1146/annurev-med-012017-043208. Annu Rev Med. 2018. PMID: 29414259 Review. - Therapeutic intervention in cancer and chronic viral infections: antibody mediated manipulation of PD-1/PD-L1 interaction.
Sakthivel P, Gereke M, Bruder D. Sakthivel P, et al. Rev Recent Clin Trials. 2012 Feb;7(1):10-23. doi: 10.2174/157488712799363262. Rev Recent Clin Trials. 2012. PMID: 22023178 Review.
Cited by
- Evolving therapeutic landscape of advanced hepatocellular carcinoma.
Yang C, Zhang H, Zhang L, Zhu AX, Bernards R, Qin W, Wang C. Yang C, et al. Nat Rev Gastroenterol Hepatol. 2023 Apr;20(4):203-222. doi: 10.1038/s41575-022-00704-9. Epub 2022 Nov 11. Nat Rev Gastroenterol Hepatol. 2023. PMID: 36369487 Review. - Immunotherapy for Hepatocellular Carcinoma: Current Limits and Prospects.
Zhong C, Li Y, Yang J, Jin S, Chen G, Li D, Fan X, Lin H. Zhong C, et al. Front Oncol. 2021 Mar 29;11:589680. doi: 10.3389/fonc.2021.589680. eCollection 2021. Front Oncol. 2021. PMID: 33854960 Free PMC article. Review. - CD8+ T cell self-tolerance permits responsiveness but limits tissue damage.
Truckenbrod EN, Burrack KS, Knutson TP, Borges da Silva H, Block KE, O'Flanagan SD, Stagliano KR, Hurwitz AA, Fulton RB, Renkema KR, Jameson SC. Truckenbrod EN, et al. Elife. 2021 Apr 30;10:e65615. doi: 10.7554/eLife.65615. Elife. 2021. PMID: 33929324 Free PMC article. - DNA Methylation in T-Cell Development and Differentiation.
Correa LO, Jordan MS, Carty SA. Correa LO, et al. Crit Rev Immunol. 2020;40(2):135-156. doi: 10.1615/CritRevImmunol.2020033728. Crit Rev Immunol. 2020. PMID: 32749092 Free PMC article. Review. - PD-1+CD8+ T cells are clonally expanding effectors in human chronic inflammation.
Petrelli A, Mijnheer G, Hoytema van Konijnenburg DP, van der Wal MM, Giovannone B, Mocholi E, Vazirpanah N, Broen JC, Hijnen D, Oldenburg B, Coffer PJ, Vastert SJ, Prakken BJ, Spierings E, Pandit A, Mokry M, van Wijk F. Petrelli A, et al. J Clin Invest. 2018 Oct 1;128(10):4669-4681. doi: 10.1172/JCI96107. Epub 2018 Aug 2. J Clin Invest. 2018. PMID: 30198907 Free PMC article. Clinical Trial.
References
- Bird A. DNA methylation patterns and epigenetic memory. Genes & development. 2002;16:6–21. - PubMed
- Cedar H, Bergman Y. Linking DNA methylation and histone modification: patterns and paradigms. Nature reviews Genetics. 2009;10:295–304. - PubMed
- Chiappinelli KB, Strissel PL, Desrichard A, Li H, Henke C, Akman B, Hein A, Rote NS, Cope LM, Snyder A, et al. Inhibiting DNA Methylation Causes an Interferon Response in Cancer via dsRNA Including Endogenous Retroviruses. Cell. 2016;164:1073. - PubMed
MeSH terms
Substances
LinkOut - more resources
Full Text Sources
Other Literature Sources
Molecular Biology Databases
Research Materials
