Prevalence of sexual dimorphism in mammalian phenotypic traits - PubMed (original) (raw)
doi: 10.1038/ncomms15475.
Jeremy Mason 3, Arthur L Beaudet 4, Yoav Benjamini 5, Lynette Bower 6, Robert E Braun 7, Steve D M Brown 8, Elissa J Chesler 7, Mary E Dickinson 9, Ann M Flenniken 10, Helmut Fuchs 11, Martin Hrabe de Angelis 11 12 13, Xiang Gao 14, Shiying Guo 14, Simon Greenaway 8, Ruth Heller 5, Yann Herault 15 16 17 18 19, Monica J Justice 20, Natalja Kurbatova 5, Christopher J Lelliott 21, K C Kent Lloyd 6, Ann-Marie Mallon 8, Judith E Mank 22, Hiroshi Masuya 23, Colin McKerlie 10 24, Terrence F Meehan 3, Richard F Mott 25, Stephen A Murray 7, Helen Parkinson 3, Ramiro Ramirez-Solis 21, Luis Santos 8, John R Seavitt 4, Damian Smedley 26, Tania Sorg 15 16 17 18 19, Anneliese O Speak 21, Karen P Steel 21 27, Karen L Svenson 7; International Mouse Phenotyping Consortium; Shigeharu Wakana 23, David West 28, Sara Wells 8, Henrik Westerberg 8, Shay Yaacoby 5, Jacqueline K White 7 21
Collaborators, Affiliations
- PMID: 28650954
- PMCID: PMC5490203
- DOI: 10.1038/ncomms15475
Prevalence of sexual dimorphism in mammalian phenotypic traits
Natasha A Karp et al. Nat Commun. 2017.
Abstract
The role of sex in biomedical studies has often been overlooked, despite evidence of sexually dimorphic effects in some biological studies. Here, we used high-throughput phenotype data from 14,250 wildtype and 40,192 mutant mice (representing 2,186 knockout lines), analysed for up to 234 traits, and found a large proportion of mammalian traits both in wildtype and mutants are influenced by sex. This result has implications for interpreting disease phenotypes in animal models and humans.
Conflict of interest statement
Natasha A. Karp is now an employee of AstraZeneca; however, there are no products in development or marketed products related to this work to declare. The remaining authors declare no competing financial interests.
Figures
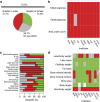
Figure 1. Sex as a biological variable in control data.
The role of sex in explaining variation in phenotypes of wildtype mice as assessed using data from the IMPC. (a,b) The proportion of experiments where sex had a significant role in wildtype phenotype. (a) Categorical data sets (_n_=545). (b) Continuous data sets (_n_=903). (c,d) The distribution of classifications when analysed by institute (c: categorical data sets, d: continuous data sets). BCM: Baylor College of Medicine, HMGU: Helmholtz Zentrum Munich, ICS: Institut Clinique de la Souris, JAX: The Jackson Laboratory, Harwell: Medical Research Council Harwell, NING: Nanjing University, RBRC: RIKEN BioResource Centre, TCP: The Centre for Phenogenomics, UC Davis: University of California, Davis, and WTSI: Wellcome Trust Sanger Institute.
Figure 2. Sex as a biological variable in wildtype phenotypic continuous data when exploring absolute difference in phenotypes.
Exploration of how often sex was significant at explaining variation at a 5% FDR in an individual experiment using IMPC wildtype data for continuous traits. The analysis assessed the role of sex in the trait of interest, at a centre level, as an absolute phenotype since weight was not included as a covariate. For all sections, green indicates the phenotype was greater in the female, magenta indicates the trait was greater in the males, white indicates missing data, and grey indicates there was no significant sex effect. (a) Pie chart showing the proportion of data sets where sex was a significant source of variation (_n_=903). (b) Comparison of the reproducibility of the sex differences in the traits monitored within the intra-peritoneal glucose tolerance test across ten phenotyping centres. (c) Bar graph showing the proportion of data sets where sex was a significant source of variation by procedure. CSD indicates combined SHIRPA and dysmorphology screen, DEXA: dual-energy X-ray absorptiometry, and PPI: acoustic startle and pre-pulse inhibition. (d) Comparison of the consistency of the role of sex in the traits monitored within the DEXA procedure across ten phenotyping centres. BCM: Baylor College of Medicine, HMGU: Helmholtz Zentrum Munich, ICS: Institut Clinique de la Souris, JAX: The Jackson Laboratory, Harwell: Medical Research Council Harwell, NING: Nanjing University, RBRC: RIKEN BioResource Centre, TCP: The Centre for Phenogenomics, UC Davis: University of California, Davis and WTSI: Wellcome Trust Sanger Institute.
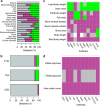
Figure 3. Sex as a biological variable after accounting for the potential confounding effect of body weight.
Assessment of the role of sex within an experiment using IMPC wildtype data at a 5% FDR. The analysis assessed the role of sex in the trait of interest, at a centre level. For continuous traits, this was computed as a relative phenotype since weight was included as a covariate. For all sections, green indicates the phenotype was greater in the females, magenta indicates the trait was greater in the males, white indicates missing data and grey indicates there was no significant sex effect. (a) Bar graph showing the proportion of data sets where sex was a significant source of variation by procedure for continuous traits. CSD indicates combined SHIRPA and dysmorphology screen, DEXA: dual-energy X-ray absorptiometry and PPI: acoustic startle and pre-pulse inhibition. (b) Bar graph showing the role of sex by procedure for categorical traits where CSD indicates combined SHIRPA and dysmorphology screen. (c) Comparison of the reproducibility of the sex differences in the traits monitored within the DEXA procedure across ten phenotyping centres. (d) Comparison of the consistency of the role of sex in the traits monitored within the intra-peritoneal glucose tolerance test across ten phenotyping centres. BCM: Baylor College of Medicine, HMGU: Helmholtz Zentrum Munich, ICS: Institut Clinique de la Souris, JAX: The Jackson Laboratory, Harwell: Medical Research Council Harwell, NING: Nanjing University, RBRC: RIKEN BioResource Centre, TCP: The Centre for Phenogenomics, UC Davis: University of California, Davis and WTSI: Wellcome Trust Sanger Institute.
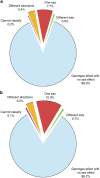
Figure 4. Role of sex as a modifier of the genotype effect.
The role of sex in explaining variation in phenotypes of knockout mice as assessed using data from the IMPC. (a) Classification for categorical data sets (_n_=1,220) with a genotype effect at 20% FDR. (b) Classification for continuous data sets (_n_=7,929) with a genotype effect at 5% FDR. The ‘Cannot classify’ effect arises when statistically an interaction is detected between sex and genotype but the model output is insufficient to specify where the interaction arises. The ‘Genotype effect with no sex effect’ effect is the classification when the null hypothesis of no genotype*sex interaction was not rejected; this may be because the effect is the same across sexes, or due to a lack of power to detect the differential effect across sexes. (c,d) Comparison of SD hit rate for each screen with more than 35 genotype significant hits (c) Categorical traits. (d) Continuous traits. IPGTT: intra-peritoneal glucose tolerance test; ECG: electrocardiogram; DEXA: dual-energy X-ray absorptiometry; CSD: combined SHIRPA and dysmorphology; PPI: acoustic startle and pre-pulse inhibition.
Figure 5. Role of sex as a modifier of the genotype effect with more stringent criteria.
Exploration of the role of sex in modifying the genotype effect in studies of continuous traits of knockout mice data from the IMPC. (a) Distribution of sex effect in the genotype significant data sets when using a 1% FDR. Overall, 110,586 data sets were tested and 3.4% (3,719) were significant for the stage 1 genotype effect. Of these, 12% (_n_=466) were classed as SD. (b) Distribution of sex effect in the genotype significant data sets when processing only multi-batch data sets at a 5% FDR. A total of 46,925 data sets were tested and 8.9% (3,719) were significant for the stage 1 genotype effect. Of these, 13.8% (_n_=575) were classed as SD.
Figure 6. Control of type-one errors for continuous traits in the stage 1 assessment of genotype and stage 2 assessment of genotype*sex interaction.
Resampling studies of wildtype data, to build data sets with ‘mock’ knockout animals under various phenotyping workflows, were used to assess the control of type-one errors for the statistical pipeline. (a) The stage 1 type-one error rate at a trait level at the 0.05 significance threshold as a function of workflow. (b) The stage 1 average type-one error rate for various significance thresholds and workflows. (c) The stage 2 type-one error rate at a trait level at the 0.05 significance threshold as a function of workflow. (d) The stage 2 average type-one error rate at a trait level for various significance thresholds and workflows. For a–d the one-batch workflow is represented by either B1 or a black line, a two batch workflow is represented by B2 or a red line, a three batch workflow is represented by B3 or a green line, a multiple batch workflow is represented by MB or an orange line, a dashed line represents the ideal rate, and finally a random workflow is represented by R or a blue line.
Figure 7. Control of type-one errors for assessing a genotype by sex interaction in the presence of a genotype effect for continuous traits.
A simulation study, to assess the stage 2 type-one error rate, where a genotype effect affecting both sexes has been added to the knockout mice as signal (as a function of standard deviation for four levels: 0.5, 1, 1.5, 2). (a) The average stage 2 type-one error rate as a function of the significance threshold. Only one level can be seen as the lines overlay each over. (b) The stage 2 type-one error rate at the trait level for the 0.05 significance threshold as a function of the signal added. Shown is a boxplot giving a five point summary (minimum, first quantile, mean, third quantile and maximum).
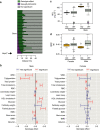
Figure 8. Role of sex as a modifier of a genotype–phenotype relationship.
(a) Looking across IMPC knockout lines identified as having 10% or more traits with a significant genotype effect, the proportion of traits classed as SD varied. Data sets are classified as SD (purple) or genotype effect with no sex effect (green) where a genotype effect in a mutant line is observed. (b) For all traits identified as having a significant genotype effect for the Usp47 tm1b(EUCOMM)Wtsi line (MGI:5605792), a comparison is presented of the standardized genotype effect with 95% confidence interval for each sex with no multiple comparisons correction. Standardization, to allow comparison across variables, was achieved by dividing the genotype estimate by the signal seen in the wildtype population. Shown in red are statistically significant estimates. RBC: red blood cells; BMC: bone mineral content; BMD: bone mineral density; WBC: white blood cells. (c,d) Raw data visualization for two traits in Usp47 tm1b(EUCOMM)Wtsi mice identified as having a significant SD genotype effect as the effect was specific to male mice. HDL: high-density lipoprotein–cholesterol; KO: knockout, WT: wildtype. While the Usp47 tm1b(EUCOMM)Wtsi line had a high proportion of SD traits, the standardized effect size (ES) change leading to a SD call observed for each trait was typically ±1 s.d. unit from the average ES. Globally for all SD calls, the ES was 0.28 (s.d.=0.38) while for Usp47 tm1b(EUCOMM)Wtsi the ES was 0.18 (s.d.=0.14).
Similar articles
- Sexual dimorphism in the quantitative-genetic architecture of floral, leaf, and allocation traits in Silene latifolia.
Steven JC, Delph LF, Brodie ED 3rd. Steven JC, et al. Evolution. 2007 Jan;61(1):42-57. doi: 10.1111/j.1558-5646.2007.00004.x. Evolution. 2007. PMID: 17300426 - Sex-linked inheritance, genetic correlations and sexual dimorphism in three melanin-based colour traits in the barn owl.
Roulin A, Jensen H. Roulin A, et al. J Evol Biol. 2015 Mar;28(3):655-66. doi: 10.1111/jeb.12596. Epub 2015 Feb 26. J Evol Biol. 2015. PMID: 25656218 - Does gestational temperature or prenatal sex ratio influence development of sexual dimorphism in a viviparous skink?
Hare KM, Yeong C, Cree A. Hare KM, et al. J Exp Zool A Ecol Genet Physiol. 2011 Apr 1;315(4):215-21. doi: 10.1002/jez.667. Epub 2011 Feb 11. J Exp Zool A Ecol Genet Physiol. 2011. PMID: 21319306 - The neurogenetics of sexually dimorphic behaviors from a postdevelopmental perspective.
Leitner N, Ben-Shahar Y. Leitner N, et al. Genes Brain Behav. 2020 Feb;19(2):e12623. doi: 10.1111/gbb.12623. Epub 2019 Nov 13. Genes Brain Behav. 2020. PMID: 31674725 Review. - Sexual dimorphism in flowering plants.
Barrett SC, Hough J. Barrett SC, et al. J Exp Bot. 2013 Jan;64(1):67-82. doi: 10.1093/jxb/ers308. Epub 2012 Nov 25. J Exp Bot. 2013. PMID: 23183260 Review.
Cited by
- Abnormal Brain Development in Huntington' Disease Is Recapitulated in the zQ175 Knock-In Mouse Model.
Zhang C, Wu Q, Liu H, Cheng L, Hou Z, Mori S, Hua J, Ross CA, Zhang J, Nopoulos PC, Duan W. Zhang C, et al. Cereb Cortex Commun. 2020;1(1):tgaa044. doi: 10.1093/texcom/tgaa044. Epub 2020 Aug 5. Cereb Cortex Commun. 2020. PMID: 32984817 Free PMC article. - Commercial human pulmonary artery endothelial cells have in-vitro behavior that varies by sex.
Cox-Flaherty K, Baird GL, Braza J, Guarino BD, Princiotto A, Ventetuolo CE, Harrington EO. Cox-Flaherty K, et al. Pulm Circ. 2022 Oct 1;12(4):e12165. doi: 10.1002/pul2.12165. eCollection 2022 Oct. Pulm Circ. 2022. PMID: 36484057 Free PMC article. - Sexually dimorphic leanness and hypermobility in p16Ink4a/CDKN2A-deficient mice coincides with phenotypic changes in the cerebellum.
Kim KH, Cho Y, Lee J, Jeong H, Lee Y, Kim SI, Kim CH, Lee HW, Nam KT. Kim KH, et al. Sci Rep. 2019 Aug 1;9(1):11167. doi: 10.1038/s41598-019-47676-6. Sci Rep. 2019. PMID: 31371816 Free PMC article. - Bex1 is essential for ciliogenesis and harbours biomolecular condensate-forming capacity.
Hibino E, Ichiyama Y, Tsukamura A, Senju Y, Morimune T, Ohji M, Maruo Y, Nishimura M, Mori M. Hibino E, et al. BMC Biol. 2022 Feb 10;20(1):42. doi: 10.1186/s12915-022-01246-x. BMC Biol. 2022. PMID: 35144600 Free PMC article. - Differences in acidosis-stimulated renal ammonia metabolism in the male and female kidney.
Harris AN, Lee HW, Fang L, Verlander JW, Weiner ID. Harris AN, et al. Am J Physiol Renal Physiol. 2019 Oct 1;317(4):F890-F905. doi: 10.1152/ajprenal.00244.2019. Epub 2019 Aug 7. Am J Physiol Renal Physiol. 2019. PMID: 31390234 Free PMC article.
References
- Yoon D. Y. et al.. Sex bias exists in basic science and translational surgical research. Surgery 156, 508–516 (2014). - PubMed
- Flanagan K. L. Sexual dimorphism in biomedical research: a call to analyse by sex. Trans. R. Soc. Trop. Med. Hyg. 108, 385–387 (2014). - PubMed
MeSH terms
Grants and funding
- UM1 OD023222/OD/NIH HHS/United States
- G0300212/MRC_/Medical Research Council/United Kingdom
- P30 CA034196/CA/NCI NIH HHS/United States
- UM1 OD023221/OD/NIH HHS/United States
- UM1 HG006348/HG/NHGRI NIH HHS/United States
- U42 OD012210/OD/NIH HHS/United States
- MC_U142684172/MRC_/Medical Research Council/United Kingdom
- MC_QA137918/MRC_/Medical Research Council/United Kingdom
- U42 OD011185/OD/NIH HHS/United States
- MR/N012119/1/MRC_/Medical Research Council/United Kingdom
- MC_UP_1502/3/MRC_/Medical Research Council/United Kingdom
- MC_U142684171/MRC_/Medical Research Council/United Kingdom
LinkOut - more resources
Full Text Sources
Other Literature Sources
Molecular Biology Databases


