A single-cell transcriptomic analysis reveals precise pathways and regulatory mechanisms underlying hepatoblast differentiation - PubMed (original) (raw)
. 2017 Nov;66(5):1387-1401.
doi: 10.1002/hep.29353. Epub 2017 Sep 29.
Affiliations
- PMID: 28681484
- PMCID: PMC5650503
- DOI: 10.1002/hep.29353
A single-cell transcriptomic analysis reveals precise pathways and regulatory mechanisms underlying hepatoblast differentiation
Li Yang et al. Hepatology. 2017 Nov.
Abstract
How bipotential hepatoblasts differentiate into hepatocytes and cholangiocytes remains unclear. Here, using single-cell transcriptomic analysis of hepatoblasts, hepatocytes, and cholangiocytes sorted from embryonic day 10.5 (E10.5) to E17.5 mouse embryos, we found that hepatoblast-to-hepatocyte differentiation occurred gradually and followed a linear default pathway. As more cells became fully differentiated hepatocytes, the number of proliferating cells decreased. Surprisingly, proliferating and quiescent hepatoblasts exhibited homogeneous differentiation states at a given developmental stage. This unique feature enabled us to combine single-cell and bulk-cell analyses to define the precise timing of the hepatoblast-to-hepatocyte transition, which occurs between E13.5 and E15.5. In contrast to hepatocyte development at almost all levels, hepatoblast-to-cholangiocyte differentiation underwent a sharp detour from the default pathway. New cholangiocyte generation occurred continuously between E11.5 and E14.5, but their maturation states at a given developmental stage were heterogeneous. Even more surprising, the number of proliferating cells increased as more progenitor cells differentiated into mature cholangiocytes. Based on an observation from the single-cell analysis, we also discovered that the protein kinase C/mitogen-activated protein kinase signaling pathway promoted cholangiocyte maturation.
Conclusion: Our studies have defined distinct pathways for hepatocyte and cholangiocyte development in vivo, which are critically important for understanding basic liver biology and developing effective strategies to induce stem cells to differentiate toward specific hepatic cell fates in vitro. (Hepatology 2017;66:1387-1401).
© 2017 by the American Association for the Study of Liver Diseases.
Figures
Fig. 1. Single-cell RNA-seq uncovers the roadmap of hepatobiliary lineage development
(A) Schematic workflow of hepatobiliary single-cell RNA-seq. (B) Principal component analysis (PCA) plot of 447 hepatobiliary single-cell transcriptomes across 7 developmental stages identifying hepatoblasts/hepatocytes (circle) and cholangiocytes (triangle). Different stages are color coded. Arrowhead curves indicate hepatoblast/hepatocyte and cholangiocyte paths. (C) Schematic summary of hepatobiliary lineage development based on the PCA plot in (B). Each oval represents the distribution of hepatoblasts/hepatocytes or cholangiocytes of each developmental stage. (D) Hierarchical clustering of 1,761 heterogeneously expressed genes, correlated with the first two PCs (p-value < 5×10-15) identifying clusters ‘a-d’. Featured TFs of each cluster are listed on the right. Pseudotime ordering of groups-I and -II is based on the projection of hepatoblasts/hepatocytes on PC1 and cholangiocytes on PC2, respectively. Genes in clusters ‘a-c’ and ‘d’ are re-ordered by correlations with PC1 and PC2, respectively. (E) Selected GO terms enriched in clusters ‘a-d’.
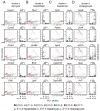
Fig. 2. Expression of cell type-representative genes during hepatobiliary development
(A-D) Gene expression levels from the RNA-seq data are projected onto the PCA plots (left); dot size represents the expression level (TPM). Cells from different stages are color coded. Gene expression levels in E11.5 hepatoblast, E17.5 hepatocyte and cholangiocyte validated by single-cell RT-qPCR are projected on box plots (right). The _y_-axis represents the relative expression values with normalized to Actb expression. *p-value < 0.05; **p-value < 0.01; ***p-value < 0.001, Wilcoxon rank-sum test.
Fig. 3. Proliferating hepatoblasts develop synchronously with quiescent hepatoblasts
(A) Hierarchical clustering identifying two clusters (I and II) of cell cycle-related genes and dividing hepatoblasts into three groups with different cell cycle phases. Cluster featured genes are listed on the right. (B, C) The PCA plot of 215 hepatoblasts. Different cell cycle phases (B) or developmental stages (C) are color coded. Solid and empty circles represent quiescent (G0/G1) and proliferating (G1/S and S/G2/M) cells in (B), respectively. (D) The distribution of quiescent (solid circle) and proliferating (empty circle) hepatoblasts from different developmental stages. The _x_-axis represents the pseudotime ordering of maturation.
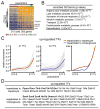
Fig. 4. Hepatoblast adopts hepatocyte fate by default
(A) Hierarchical clustering of 383 upregulated genes correlated with the first two PCs in Fig. 3B (p-value < 1×10⁻⁷) during hepatoblast development. Genes are re-ordered by the correlation with PC1. TFs are listed on the right. (B) Selected GO terms enriched in genes identified in (A). (C) The expression dynamics of upregulated TFs across hepatobiliary lineage development. The red line represents the average tendency curve of relative expression levels of 21 TFs upregulated during the hepatoblast-to-hepatocyte transition. The blue line represents 44 TFs upregulated during the hepatoblast-to-cholangiocyte transition. The gray line represents the relative expression curve of an individual TF. (D) The lists of upregulated genes during hepatoblast-to-hepatocyte or hepatoblast-to-cholangiocyte development. Genes bolded have known to be necessary for hepatic development.
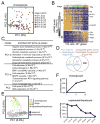
Fig. 5. Characterization of cholangiocyte lineage development
(A) The PCA plot of all 102 cholangiocytes. The cells are color coded by the developmental stage. (B) Hierarchical clustering of 261 genes correlated with PC1 in (A) (p-value < 1×10⁻⁶) identifying two genes clusters (‘a’ and ‘b’) and dividing cholangiocytes into three developmental stages (I-III). Cluster featured TFs are listed on the right. Genes are ordered by correlation with PC1. (C) Selected GO terms enriched in clusters ‘a’ and ‘b’ identified in (B), and genes related to PC2 in (A). (D) Venn diagram showing the overlap between cluster ‘a’ genes in (B) and the genes in Fig. 4A. (E) The PCA plot showing the distribution of hepatobiliary cells with different cell proliferation states. Different stages of cholangiocytes and hepatoblasts/hepatocytes are color coded. Individual cells are marked by empty (proliferating) or solid (quiescent) circles. (F) The percentage of proliferating cholangiocytes from stages-I to -III (top) and hepatoblasts/hepatocytes from E10.5 to E17.5 (bottom).
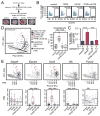
Fig. 6. PKC/ERK/MAPK signaling promotes cholangiocyte maturation
(A) Schematic workflow of the E12.5 liver lobe cultures (top). Liver lobes were treated with DMSO (control), TPPB, U0126 or TPPB+U0126. Images of explants after treatments (bottom) do not show overt differences in morphogenesis between each type of treatment. Scale bar: 200 μm. (B) FACS gating strategy used to sort and analyze EpCAM+ cells. (C) Statistical analysis of the percentage of EpCAM+ cells observed after treatment. The data are presented as means + SEM; n: number of biological replicates; Sample #: the number of cultured liver lobes; ***p-value < 0.001, t-test. (D) PCA plot showing that the TPPB treatment promotes cholangiocyte maturation compared to the control (left). The number of single cells is presented in parentheses. The PC1 values of individual cells in the PCA plot are projected in a box plot (right). ***p-value < 0.001, Wilcoxon rank-sum test. (E) Expression levels (TPM) of marker genes are projected onto PCA plots (top) and box plots (bottom). ***p-value < 0.001, Wilcoxon rank-sum test.
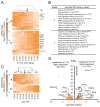
Fig. 7. Bulk-cell RNA-seq defines the hepatoblast-to-hepatocyte turning point
(A) Hierarchical clustering analysis of 4,077 variably expressed genes (CV > 0.4) in bulk hepatoblasts/hepatocytes obtained at nine developmental stages. Cluster-featured TFs are listed on the right. The arrow indicates the timing of the hepatoblast-to-hepatocyte transition. (B) Selected GO terms enriched in clusters ‘a’ and ‘b’ shown in (A). (C) Hierarchical clustering of 222 TFs extracted from (A). The arrow indicates the timing of the hepatoblast-to-hepatocyte transition based on TF expression. (D) Volcano plot showing TFs that are highly expressed in hepatoblasts (E11.5) and hepatocytes (E17.5) with an adjusted p-value (padj) < 0.05. The listed TFs have been reported to regulate hepatoblast/hepatocyte development.
Similar articles
- Lgr5+ stem and progenitor cells reside at the apex of a heterogeneous embryonic hepatoblast pool.
Prior N, Hindley CJ, Rost F, Meléndez E, Lau WWY, Göttgens B, Rulands S, Simons BD, Huch M. Prior N, et al. Development. 2019 Jun 12;146(12):dev174557. doi: 10.1242/dev.174557. Development. 2019. PMID: 31142540 Free PMC article. - Notch signaling controls hepatoblast differentiation by altering the expression of liver-enriched transcription factors.
Tanimizu N, Miyajima A. Tanimizu N, et al. J Cell Sci. 2004 Jul 1;117(Pt 15):3165-74. doi: 10.1242/jcs.01169. J Cell Sci. 2004. PMID: 15226394 - Myofibroblasts control the proliferation of fetal hepatoblasts and their differentiated cholangiocytes during the hepatoblast-to-cholangiocyte transition.
Wang W, Wan L, Chen Z, Jin X, Li D. Wang W, et al. Biochem Biophys Res Commun. 2020 Feb 19;522(4):845-851. doi: 10.1016/j.bbrc.2019.11.174. Epub 2019 Dec 1. Biochem Biophys Res Commun. 2020. PMID: 31801666 - Molecular regulation of mammalian hepatic architecture.
Huppert SS, Iwafuchi-Doi M. Huppert SS, et al. Curr Top Dev Biol. 2019;132:91-136. doi: 10.1016/bs.ctdb.2018.12.003. Epub 2018 Dec 26. Curr Top Dev Biol. 2019. PMID: 30797519 Free PMC article. Review. - Re-evaluation of liver stem/progenitor cells.
Tanimizu N, Mitaka T. Tanimizu N, et al. Organogenesis. 2014 Apr-Jun;10(2):208-15. doi: 10.4161/org.27591. Epub 2014 Jan 22. Organogenesis. 2014. PMID: 24451175 Free PMC article. Review.
Cited by
- Quantitative modeling identifies critical cell mechanics driving bile duct lumen formation.
Van Liedekerke P, Gannoun L, Loriot A, Johann T, Lemaigre FP, Drasdo D. Van Liedekerke P, et al. PLoS Comput Biol. 2022 Feb 18;18(2):e1009653. doi: 10.1371/journal.pcbi.1009653. eCollection 2022 Feb. PLoS Comput Biol. 2022. PMID: 35180209 Free PMC article. - Powerful and accurate detection of temporal gene expression patterns from multi-sample multi-stage single-cell transcriptomics data with TDEseq.
Fan Y, Li L, Sun S. Fan Y, et al. Genome Biol. 2024 Apr 15;25(1):96. doi: 10.1186/s13059-024-03237-3. Genome Biol. 2024. PMID: 38622747 Free PMC article. - Interrogations of single-cell RNA splicing landscapes with SCASL define new cell identities with physiological relevance.
Xiang X, He Y, Zhang Z, Yang X. Xiang X, et al. Nat Commun. 2024 Mar 9;15(1):2164. doi: 10.1038/s41467-024-46480-9. Nat Commun. 2024. PMID: 38461306 Free PMC article. - Generation of _in vivo_-like multicellular liver organoids by mimicking developmental processes: A review.
Okumura A, Aoshima K, Tanimizu N. Okumura A, et al. Regen Ther. 2024 Jun 8;26:219-234. doi: 10.1016/j.reth.2024.05.020. eCollection 2024 Jun. Regen Ther. 2024. PMID: 38903867 Free PMC article. Review. - Divergent WNT signaling and drug sensitivity profiles within hepatoblastoma tumors and organoids.
Kluiver TA, Lu Y, Schubert SA, Kraaier LJ, Ringnalda F, Lijnzaad P, DeMartino J, Megchelenbrink WL, Amo-Addae V, Eising S, de Faria FW, Münter D, van de Wetering M, Kerl K, Duiker E, van den Heuvel MC, de Meijer VE, de Kleine RH, Molenaar JJ, Margaritis T, Stunnenberg HG, de Krijger RR, Zsiros J, Clevers H, Peng WC. Kluiver TA, et al. Nat Commun. 2024 Nov 20;15(1):8576. doi: 10.1038/s41467-024-52757-w. Nat Commun. 2024. PMID: 39567475 Free PMC article.
References
- Zorn AM. StemBook. Cambridge (MA): 2008. Liver development.
- Si-Tayeb K, Lemaigre FP, Duncan SA. Organogenesis and development of the liver. Dev Cell. 2010;18:175–189. - PubMed
- Lemaigre FP. Mechanisms of liver development: concepts for understanding liver disorders and design of novel therapies. Gastroenterology. 2009;137:62–79. - PubMed
- Ludtke TH, Christoffels VM, Petry M, Kispert A. Tbx3 promotes liver bud expansion during mouse development by suppression of cholangiocyte differentiation. Hepatology. 2009;49:969–978. - PubMed
- Suzuki A, Iwama A, Miyashita H, Nakauchi H, Taniguchi H. Role for growth factors and extracellular matrix in controlling differentiation of prospectively isolated hepatic stem cells. Development. 2003;130:2513–2524. - PubMed
Publication types
MeSH terms
LinkOut - more resources
Full Text Sources
Other Literature Sources
Molecular Biology Databases
Research Materials

