Cryo-EM structure of the protein-conducting ERAD channel Hrd1 in complex with Hrd3 - PubMed (original) (raw)
. 2017 Aug 17;548(7667):352-355.
doi: 10.1038/nature23314. Epub 2017 Jul 6.
Wei Mi 2, Alexander Stein 3, Sergey Ovchinnikov 4, Ryan Pavlovicz 4, Frank DiMaio 4, David Baker 4, Melissa G Chambers 2, Huayou Su 5, Dongsheng Li 5, Tom A Rapoport 1, Maofu Liao 2
Affiliations
- PMID: 28682307
- PMCID: PMC5736104
- DOI: 10.1038/nature23314
Cryo-EM structure of the protein-conducting ERAD channel Hrd1 in complex with Hrd3
Stefan Schoebel et al. Nature. 2017.
Abstract
Misfolded endoplasmic reticulum proteins are retro-translocated through the membrane into the cytosol, where they are poly-ubiquitinated, extracted from the membrane, and degraded by the proteasome-a pathway termed endoplasmic reticulum-associated protein degradation (ERAD). Proteins with misfolded domains in the endoplasmic reticulum lumen or membrane are discarded through the ERAD-L and ERAD-M pathways, respectively. In Saccharomyces cerevisiae, both pathways require the ubiquitin ligase Hrd1, a multi-spanning membrane protein with a cytosolic RING finger domain. Hrd1 is the crucial membrane component for retro-translocation, but it is unclear whether it forms a protein-conducting channel. Here we present a cryo-electron microscopy structure of S. cerevisiae Hrd1 in complex with its endoplasmic reticulum luminal binding partner, Hrd3. Hrd1 forms a dimer within the membrane with one or two Hrd3 molecules associated at its luminal side. Each Hrd1 molecule has eight transmembrane segments, five of which form an aqueous cavity extending from the cytosol almost to the endoplasmic reticulum lumen, while a segment of the neighbouring Hrd1 molecule forms a lateral seal. The aqueous cavity and lateral gate are reminiscent of features of protein-conducting conduits that facilitate polypeptide movement in the opposite direction-from the cytosol into or across membranes. Our results suggest that Hrd1 forms a retro-translocation channel for the movement of misfolded polypeptides through the endoplasmic reticulum membrane.
Conflict of interest statement
The authors declare no competing financial interest.
Figures
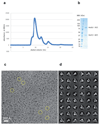
Extended Data Figure 1. Purification and cryo-EM of the Hrd1/Hrd3 complex.
a, In the last purification step, the Hrd1/Hrd3 complex was subjected to gel filtration on a Superdex 200 10/300GL Increase column. Shown is the UV elution profile. b, SDS-PAGE gel of the peak fraction, stained with Coomassie blue. For gel source data, see Supplementary Fig. 1. c, Representative cryo-EM image with a few particles marked by circles. A total of 5,361 images were collected. d, 2D class averages of cryo-EM particles.
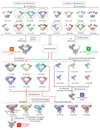
Extended Data Figure 2. 3D classification and refinement procedure for the Hrd1/Hrd3 complex.
Views parallel to the membrane of 3D reconstructions are shown, and percentages of the particles in each class indicated. Three different classes selected from the first round of 3D classification are encircled with dashed lines in different colors, and were used for further analysis, as indicated by correspondingly colored arrows. The four final maps are labeled A-D, and shown with the resolutions and particle numbers. Maps C and D were used for model building. To obtain the best 3D classification focusing on the Hrd1 dimer, we compared dynamic signal subtraction (DSS) and conventional signal subtraction. Only with DSS was particle class obtained that resulted in a reconstruction showing clear densities for the TM7/TM8 and TM5/TM6 loops of Hrd1.
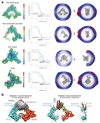
Extended Data Figure 3. Single particle cryo-EM analysis of Hrd1/Hrd3 complexes.
a, Density maps were generated for the Hrd1/Hrd3 dimer, the Hrd1 dimer with one associated Hrd3 molecule, the Hrd1 dimer, and Hrd3 (see Extended Data Fig. 2). The left panels show the maps in a side view, colored according to local resolution, the middle panels show the gold-standard Fourier shell correlation (FSC) curve (blue) with indicated resolution at FSC = 0.143, and the right panels show the Euler angle distribution in two different views. In the two lower panels, the dashed grey FCS curves were calculated between the atomic model and the corresponding final cryo-EM map. b, The density map for the Hrd1/Hrd3 dimer was filtered to a resolution of 6.8Å without amplitude modification, and is displayed at two different isosurface levels. At a low level (left panel), the weak amphipol density is visible and encloses the density of Hrd1 dimer. The amphipathic helix of Hrd3 only associates with the outer surface of amphipol density. At a high isosurface level (middle and right panels), the density for the amphipathic helix is clearly connected with that of the preceding Sel1 domains and well separated from that of TM1 and TM2 of the nearby Hrd1 molecule. The region in the dashed black box (middle panel) is displayed as a sectional view in the right panel.
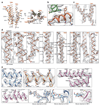
Extended Data Figure 4. Examples of the fit of the model and density maps.
a, Amino acids for which side chain density was observed are indicated in side and top views of the Hrd1 model. b, Central interface between the Hrd1 molecules. H79 and F83 from the two Hrd1 molecules (orange and green) probably form cation-pi interactions. c, TMs 3 and 8 of Hrd1. d, Density for the TMs of Hrd1. Amino acids with clear side chain density are indicated. e, Selected areas in Hrd3: N-terminal (blue), central (yellow) and C-terminal domain (purple).
Extended Data Figure 5. Distance constraints between amino acid residues in Hrd1.
a, Evolutionary couplings between amino acids, determined with the program Gremlin . Shown is a view from the ER lumen with couplings shown as lines between residues. b, Distance constraints calculated with the program RaptorX-Contact ,.
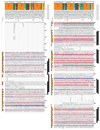
Extended Data Figure 6. Sequence similarities between Hrd1 and other multi-spanning ubiquitin ligases.
Multiple sequence alignment showing amino acid conservation in TMs 3-8 of Hrd1, TMs 3-8 of gp78 (also called AMFR), and TMs 9-14 of TRC8 (also called RNF139) and RNF145. On the left, Uniprot codes for individual sequences are given. Numbers after Uniprot codes indicate the depicted amino acid range. Black bars above the sequences indicate the location of the most C-terminal six transmembrane segments of human gp78 (top), and human TRC8 (bottom) as predicted by TOPCONS. Below that, amino acid numbering for Hrd1p from S. cerevisiae is given. Coloring was edited in JalView according to conservation of hydrophobicity . Residues highlighted in green and with green dots are conserved among Hrd1 and gp78 molecules and are involved in the interaction of TMs 2,3, and 4 on the cytosolic side of the membrane (Extended Data Fig. 7c). Species abbreviations in Uniprot codes: YEAST S. cerevisiae, USTMA Ustilago maydis, CAPO3 Capsaspora owczarzaki, MONBE Monosiga brevicollis, AMPQE Amphimedon queenslandica, SCHMA Schistosoma mansoni, STRPU Strongylocentrotus purpuratus, CAEEL Caenorhabditis elegans, DROME Drosophila melanogaster, DANRE Danio rerio, THETB Thecamonas trahens, PLABS Plasmodiophora brassicae, ECTSI Ectocarpus siliculosus, PLAF7 Plasmodium falciparum, PARTE Paramecium tetraurelia, GUITH Guillardia theta, GALSU Galdieria sulphuraria, OSTLU Ostreococcus lucimarinus, ARATH Arabidopsis thaliana, LEIMA Leishmania major, DICDI Dictyostelium discoideum, DAPPU Daphnia pulex, CIOIN Ciona intestinalis, SELML Selaginella moellendorffii, STRMM Strigamia maritima.
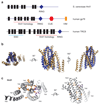
Extended Data Figure 7. Structural homology between the ubiquitin ligases Hrd1 and TRC8.
a, Domain organization of human gp78 and TRC8. Black bars indicate the position of TM segments as predicted by TOPCONS. The positions of the VIM (VCP interacting motif), CUE, and RING finger domains were taken from Uniprot entries Q9UKV5 and Q8WU17. The sterol-sensing domain (blue bar) in TRC8 is positioned according to ref.. Regions with homology to Hrd1 are indicated by red bars. b, Structural model of human TRC 8 (residues 323-516) as generated by RaptorX-Contact (44,45). The structure of S. cerevisiae Hrd1 is shown in brown, the model for TRC in dark blue (residues 345-516). TM9 of TRC8 does not align well with TM3 of Hrd1 and is therefore shown in light blue (residues 323-344). Shown are views from the cytosol (left panel), and views parallel to the membrane either towards the hydrophilic cavity or from the backside (middle and right panels, respectively). The structure of Hrd1 from S. cerevisiae was aligned with the TRC8 model obtained from RaptorX-Contact (44,45) using the command cealign within Pymol . c, Views of Hrd1 from the cytosol (left) and the side (right), with residues conserved in the ubiquitin ligases Hrd1, gp78, TRC8, and RNF145 shown in orange, and residues conserved in Hrd1 and gp78 in purple.
Extended Data Figure 8. Potential Hrd3 binding surfaces for substrate and partners.
a, Groove at the inner surface of Hrd3 (encircled), located at the junction of the N-terminal (residues 187-199), middle (residues 507-521), and C-terminal (residues 539-560, 593-595) domains. The left panel shows a space-filling model with conserved amino acids shown in orange to red (scores 7-9 in the program Consurf). Hrd1 is shown in ribbon presentation. The right panel shows the same view with Hrd3 in cartoon presentation. Helices containing the conserved residues are shown as ribbons. Some residues are labeled for orientation. b, The left panel shows three conserved surface grooves on the outer surface of Hrd3 (encircled), with conserved residues colored as in a. The right panel shows the same view with helices containing conserved residues in ribbon presentation.
Extended Data Figure 9. Sequence conservation of the amphipathic helix of Hrd3.
Consensus sequence of the amphipathic helix of Hrd3, generated with Weblogo 3.0. The size of the letters correlates with their conservation. Black, blue, and green letters indicate hydrophobic, hydrophilic, and other residues, respectively. The lower panel shows an alignment of the amphipathic helix of S. cerevisiae Hrd3 with the consensus sequence (Cons). The blue area indicates the amphipathic helix, with residues in red forming its hydrophobic face.
Figure 1. Architecture of the Hrd1/Hrd3 complex.
a, Side view of the density map of the dimeric Hrd1/Hrd3 complex at 4.7Å resolution. The Hrd1 molecules are shown in brown and green, and the Hrd3 molecules in blue and red. Weak density between the Hrd3 molecules is in grey. The approximate membrane boundaries are indicated. b, Side view of the models for Hrd1 and Hrd3 in ribbon presentation, colored as in a. The grey region in a, corresponding to residues 268-316 of Hrd3, could not be traced. c, As in b, but view from the cytosol. d, As in b, but view from the ER lumen.
Figure 2. Structure of Hrd1.
a, Ribbon presentation of the Hrd1 dimer (brown, green) in two different views from the cytosol. Hrd3 was omitted for clarity. The TMs are numbered. b, Side view of a space-filling model of TMs 3-8 of one Hrd1 molecule together with a ribbon presentation of TMs 1 and 2 of the other. c, Left: conserved hydrophilic residues inside the Hrd1 funnel shown as sticks. The position of these residues is deduced from the orientation of TM helices. Right: hydrophobic residues sealing the funnel towards the ER lumen. d, Hydrophobic seal residues viewed along the grey arrow shown in c (right panel).
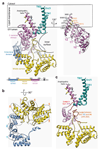
Figure 3. Structure of Hrd3.
a, Left: ribbon presentation of the Hrd3 model. Domain colors correspond to those in the sequence diagram. TM1-TM2 of Hrd1 are in green. The Hrd3 structure lacks the signal sequence and the segment following residue 686. Black dashed arc: inner surface of Hrd3. Right: Sel1 motifs in the C-terminal domain of Hrd3 (ovals). Underlined motifs were not predicted from primary sequence. Hydrophobic and hydrophilic residues of the amphipathic helix are shown in black and yellow, respectively. b, Sel1 motifs in the N terminal and middle domains of Hrd3. c, Hrd3 segments interacting with Hrd1 (in green). The N-terminal domain and Sel1 motifs #11 and #12 were omitted.
Figure 4. Hydrophilic funnels in protein-conducting channels.
a, Cut-away side view of a space-filling model of Hrd1. The membrane boundaries were determined with the OPM server (
http://opm.phar.umich.edu/server.php
). b, As in a, but for the SecY channel (PDB code 1RH5). c, As in a, but for YidC (PDB code 3WO6).
Similar articles
- Cycles of autoubiquitination and deubiquitination regulate the ERAD ubiquitin ligase Hrd1.
Peterson BG, Glaser ML, Rapoport TA, Baldridge RD. Peterson BG, et al. Elife. 2019 Nov 12;8:e50903. doi: 10.7554/eLife.50903. Elife. 2019. PMID: 31713515 Free PMC article. - Structural basis of ER-associated protein degradation mediated by the Hrd1 ubiquitin ligase complex.
Wu X, Siggel M, Ovchinnikov S, Mi W, Svetlov V, Nudler E, Liao M, Hummer G, Rapoport TA. Wu X, et al. Science. 2020 Apr 24;368(6489):eaaz2449. doi: 10.1126/science.aaz2449. Science. 2020. PMID: 32327568 Free PMC article. - Disulfide-crosslink analysis of the ubiquitin ligase Hrd1 complex during endoplasmic reticulum-associated protein degradation.
Pisa R, Rapoport TA. Pisa R, et al. J Biol Chem. 2022 Sep;298(9):102373. doi: 10.1016/j.jbc.2022.102373. Epub 2022 Aug 13. J Biol Chem. 2022. PMID: 35970394 Free PMC article. - Mechanistic insights into ER-associated protein degradation.
Wu X, Rapoport TA. Wu X, et al. Curr Opin Cell Biol. 2018 Aug;53:22-28. doi: 10.1016/j.ceb.2018.04.004. Epub 2018 Apr 30. Curr Opin Cell Biol. 2018. PMID: 29719269 Free PMC article. Review. - Translocation of Proteins through a Distorted Lipid Bilayer.
Wu X, Rapoport TA. Wu X, et al. Trends Cell Biol. 2021 Jun;31(6):473-484. doi: 10.1016/j.tcb.2021.01.002. Epub 2021 Jan 30. Trends Cell Biol. 2021. PMID: 33531207 Free PMC article. Review.
Cited by
- Yeast as a tool for membrane protein production and structure determination.
Carlesso A, Delgado R, Ruiz Isant O, Uwangue O, Valli D, Bill RM, Hedfalk K. Carlesso A, et al. FEMS Yeast Res. 2022 Oct 20;22(1):foac047. doi: 10.1093/femsyr/foac047. FEMS Yeast Res. 2022. PMID: 36175165 Free PMC article. - Unraveling the roles of endoplasmic reticulum-associated degradation in metabolic disorders.
Luo H, Jiao Q, Shen C, Shao C, Xie J, Chen Y, Feng X, Zhang X. Luo H, et al. Front Endocrinol (Lausanne). 2023 Jun 29;14:1123769. doi: 10.3389/fendo.2023.1123769. eCollection 2023. Front Endocrinol (Lausanne). 2023. PMID: 37455916 Free PMC article. Review. - Intracellular Transport and Cytotoxicity of the Protein Toxin Ricin.
Sowa-Rogozińska N, Sominka H, Nowakowska-Gołacka J, Sandvig K, Słomińska-Wojewódzka M. Sowa-Rogozińska N, et al. Toxins (Basel). 2019 Jun 18;11(6):350. doi: 10.3390/toxins11060350. Toxins (Basel). 2019. PMID: 31216687 Free PMC article. Review. - Dynamic Regulation of the 26S Proteasome: From Synthesis to Degradation.
Marshall RS, Vierstra RD. Marshall RS, et al. Front Mol Biosci. 2019 Jun 7;6:40. doi: 10.3389/fmolb.2019.00040. eCollection 2019. Front Mol Biosci. 2019. PMID: 31231659 Free PMC article. Review. - An Update on Sec61 Channel Functions, Mechanisms, and Related Diseases.
Lang S, Pfeffer S, Lee PH, Cavalié A, Helms V, Förster F, Zimmermann R. Lang S, et al. Front Physiol. 2017 Nov 1;8:887. doi: 10.3389/fphys.2017.00887. eCollection 2017. Front Physiol. 2017. PMID: 29163222 Free PMC article. Review.
References
- Ye Y, Meyer HH, Rapoport TA. The AAA ATPase Cdc48/p97 and its partners transport proteins from the ER into the cytosol. Nature. 2001;414:652–656. - PubMed
- Jarosch E, et al. Protein dislocation from the ER requires polyubiquitination and the AAA-ATPase Cdc48. Nature cell biology. 2002;4:134–139. - PubMed
Publication types
MeSH terms
Substances
Grants and funding
- 677770/ERC_/European Research Council/International
- R01 GM052586/GM/NIGMS NIH HHS/United States
- T32 GM007270/GM/NIGMS NIH HHS/United States
- HHMI/Howard Hughes Medical Institute/United States
LinkOut - more resources
Full Text Sources
Other Literature Sources
Molecular Biology Databases
