Phylogenetic Tracings of Proteome Size Support the Gradual Accretion of Protein Structural Domains and the Early Origin of Viruses from Primordial Cells - PubMed (original) (raw)
Phylogenetic Tracings of Proteome Size Support the Gradual Accretion of Protein Structural Domains and the Early Origin of Viruses from Primordial Cells
Arshan Nasir et al. Front Microbiol. 2017.
Abstract
Untangling the origin and evolution of viruses remains a challenging proposition. We recently studied the global distribution of protein domain structures in thousands of completely sequenced viral and cellular proteomes with comparative genomics, phylogenomics, and multidimensional scaling methods. A tree of life describing the evolution of proteomes revealed viruses emerging from the base of the tree as a fourth supergroup of life. A tree of domains indicated an early origin of modern viral lineages from ancient cells that co-existed with the cellular ancestors. However, it was recently argued that the rooting of our trees and the basal placement of viruses was artifactually induced by small genome (proteome) size. Here we show that these claims arise from misunderstanding and misinterpretations of cladistic methodology. Trees are reconstructed unrooted, and thus, their topologies cannot be distorted a posteriori by the rooting methodology. Tracing proteome size in trees and multidimensional views of evolutionary relationships as well as tests of leaf stability and exclusion/inclusion of taxa demonstrated that the smallest proteomes were neither attracted toward the root nor caused any topological distortions of the trees. Simulations confirmed that taxa clustering patterns were independent of proteome size and were determined by the presence of known evolutionary relatives in data matrices, highlighting the need for broader taxon sampling in phylogeny reconstruction. Instead, phylogenetic tracings of proteome size revealed a slowdown in innovation of the structural domain vocabulary and four regimes of allometric scaling that reflected a Heaps law. These regimes explained increasing economies of scale in the evolutionary growth and accretion of kernel proteome repertoires of viruses and cellular organisms that resemble growth of human languages with limited vocabulary sizes. Results reconcile dynamic and static views of domain frequency distributions that are consistent with the axiom of spatiotemporal continuity that is tenet of evolutionary thinking.
Keywords: Heaps law; origin of viruses; phylogenomics; protein structure; proteome growth; tree of life.
Figures
Figure 1
Comparing the indirect outgroup comparison method of rooting trees and the direct generality criterion. Rooting involves orienting an unrooted tree and pulling down a branch that will hold the ancestor of all taxa examined. In outgroup comparison, sister (outgroup) taxa external to the study group (ingroup taxa) are identified a priori of being of ancestral origin and the branch that is closest to the ingroup pulled down. This creates a new outgroup node for rooting the phylogeny. The outgroup node adds a character state vector that includes character state o, which is diagnostic of the outgroup and is assumed to be ancestral and absent in the ingroup. Once the outgroup is made ancestral, the tree is rooted and character state i is shared and derived, making it a synapomorphy. In Weston's generality criterion (Weston, 1988, 1994), the character state distributions in the phylogeny are used to polarize character transformations. Character state z is less distributed than y within the ingroup (it is present only in a minority subset of taxa) and is considered shared and derived. The figure was modified from Bryant (2001).
Figure 2
FSF use (occurrence) and reuse (abundance) are strongly correlated. Scatter log-log plots reveal a strong correlation between FSF use and FSF reuse for total (A) and universal ABEV FSF (B) sets for 368-taxon trees (Nasir and Caetano-Anollés, 2015). Viruses (266), Archaea (34), Bacteria (34), and Eukarya (34) are colored red, black, blue, and green, respectively. Each of these supergroups has its own power law regime that complies with a four-regime Heaps law of vocabulary growth. Individual regimes are indicated with numbers and follow V ~ _N_β relationships, with V representing FSF vocabulary size (use) and N representing FSF database size (reuse) in proteomes. Their fits to linear regression models using ordinary least squares and the estimation of the Heaps exponent β are described in Figure S2.
Figure 3
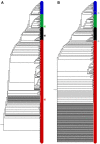
Trees of proteomes are robust and insensitive to the effects of genome size but sensitive to holobiont relationships defining taxa. (A) The single most parsimonious tree (taxa = 368; characters = 442; length = 45,935, retention index = 0.83, _g_1 = −0.31) describing the evolution of 102 cellular organisms (34 each from Archaea, Bacteria, and Eukarya) and 266 viruses (sampled at least 5 viruses from each family/order) (Nasir and Caetano-Anollés, 2015). The smallest proteomes for cells (I. hospitalis and A. gossypii; black and green asterisks) and viruses (bat cycloviruses; red asterisk) are indicated. The names of taxa are not shown because they would not be visible. Instead, the positions of terminals were colored according to supergroup, green (Eukarya), blue (Bacteria), black (Archaea) and red (viruses). (B) A strict consensus of two most parsimonious trees (length = 46,781, retention index = 0.83, _g_1 = −19.81 and −19.82) built using phylogenomic data from the 368 proteomes of panel (A) plus the proteomes from the two extremely reduced R. prowazekii and N. equitans (gray circles and asterisks). While no major topological distortions are observed, the consensus tree losses resolution at its base.
Figure 4
Scatter plots describe the relationship between ABEV FSF use (A) and reuse (B) and node distance (nd) for the 368-taxon ToL (Nasir and Caetano-Anollés, 2015). Data points for different supergroups are colored green (Eukarya), blue (Bacteria), black (Archaea) and red (viruses). The black line describes the nature of the relationship, as determined by the Locally Weighted Regression Scatter Plot Smoothing (LOWESS) method, which obtains a smoothed curve by fitting successive regression functions (q = 0.1, i = 100). The plot reveals high scatter, especially toward smaller nd values and clustering of bacterial and eukaryal taxa in the same nd range despite harboring big differences in FSF use and reuse.
Figure 5
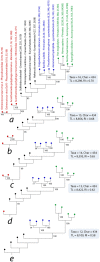
Testing the SGA artifact with the Siddal and Whiting (1999) approach. A single most parsimonious phylogenomic tree (a) describes the evolutionary relationships between four proteomes sampled each from viruses, Archaea, Bacteria, and Eukarya. Taxa are colored as previously described. Numbers on branches indicated BS support values (%). Single most parsimonious trees b through e were recovered after successive elimination of the smallest viral proteomes. TL, tree length; RI, retention index.
Figure 6
Cellular endosymbionts differ from free-living organisms and viruses in their FSF composition profiles. Annotation of FSF domains into one of the seven major functional categories (Metabolism, Information, Intracellular Processes, Extracellular Processes, Regulation, General, and Other) for archaeal, bacterial, eukaryal, and viral proteomes sampled in our study (Nasir and Caetano-Anollés, 2015) and for nine viral and three extremely reduced cellular proteomes included by Harish et al. (2016) in their reconstructions Cand. Nausia deltocephalinicola was not part of our reconstructions (encodes only 55 universal FSFs). Obligate endosymbionts or parasites often increase the repertoire of informational FSF domains, as showcased by Cand. Tremblaya included by Harish et al. (2016), and for 311 other known obligate and facultative parasitic organisms in (Figure 3 in Nasir et al., 2011). Functional scheme as defined by Christine Vogel in SUPERFAMILY database (
http://supfam.org/SUPERFAMILY/function.html
). Category Other includes proteins with either unknown or viral functions. General includes proteins involved in binding to small molecules, ligands, and lipids, and structural proteins. Numbers in parenthesis indicate total number of proteomes included in the FSF profile representation.
Figure 7
Obligate parasitic taxa destabilize leaves of trees. (A) Leaf stabilities (LS maximum) were calculated with RadCon (Thorley and Page, 2000) from 2,000 unrooted BS trees. LS values are ordered in the table (A) according to the most informative strict reduced consensus (SRC) tree (33.54 bits) out of a set of 5 SRC trees, which matches the strict component consensus (consensus efficiency = 0.555) derived from the unrooted trees. (B) LS values are visualized as violin plots. Violin plot is a combination of the box plot (the black rectangle with white circle representing group median) and density plot on each side (yellow) reflecting data distribution. The spread of LS values was calculated for the control set (C) and all possible permutations of free-living Acidobacterium capsulatum (A1–A5) and the obligate endoparasite R. prowazekii (R1–R5) with individual taxa of the corresponding bacterial superkingdoms (identified with numbers following taxon labels). The density trace is plotted symmetrically around the boxplots. White circles are group medians. Asterisks are distributions significantly different from control C (Wilcoxon rank sum test, two-tailed, P < 0.01).
Figure 8
Viruses stabilize leaves of trees. (A) A single most parsimonious phylogenomic tree (length = 13,004, retention index = 0.61) reconstructed from the genomic abundance census of 442 universal FSFs (432 parsimony informative characters) in 24 proteomes selected equally from Archaea (black), Bacteria (blue), and Eukarya (green) (the 8880 dataset). The most stable taxa in each superkingdoms, as indicated by TII values (Table 2), are labeled with an asterisk. (B) A single most parsimonious phylogenomic tree (length = 12,033, retention index = 0.70) reconstructed from the genomic abundance census of 442 universal FSFs (428 parsimony informative characters) in 24 proteomes selected equally from viruses (red), Archaea (black), Bacteria (blue), and Eukarya (green) after replacing the most stable cellular taxa in (A) with viruses (the 6666 dataset). (C) A comparison of various LS statistics between the 8880 and 6666 BS tree datasets, as displayed by violin plots. None of the comparisons were statistically significant (Wilcoxon rank sum test, two-tailed). (D) Comparison of TII distribution for the 8880 dataset against the 6666 dataset, as displayed by violin plots. Inclusion of viral taxa significantly reduces overall tree instability. Asterisk indicates significant mean difference (Wilcoxon rank sum test, two-tailed, P < 0.01).
Figure 9
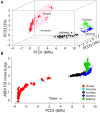
The space of ages of FSF structural domains reveals supergroups as distinct clouds and global evolutionary tendencies of growth in proteomes. (A) An evolutionary principal coordinate (evoPCO) analysis plot portrays in its first three axes (85% variability explained) the evolutionary distances between cellular and viral proteomes [taxa = 368, characters = 442 universal FSFs, character states = occurrence * (1−nd)]. (B) The most important evoPCO component plotted against universal ABEV FSF reuse in logarithm scale. The reconstructed proteome of the last common ancestor of modern cells was added as reference to infer the direction of evolutionary change (Kim and Caetano-Anollés, 2011). a, Lassa virus; b, Ancestor; c, Pandoravisus salinus; d, Pandoravirus dulcis; e, Acanthamoeba polyphaga mimivirus; f, Megavirus chilensis; g, Megavirus iba; h, Ignicoccus hospitalis; i, Haloarcula marismortui; j, Lactobacillus delbrueckii; k, Sorangium cellulosum; l, Ashbya gossypii; m, Emiliana huxleyi.
Similar articles
- Giant viruses coexisted with the cellular ancestors and represent a distinct supergroup along with superkingdoms Archaea, Bacteria and Eukarya.
Nasir A, Kim KM, Caetano-Anolles G. Nasir A, et al. BMC Evol Biol. 2012 Aug 24;12:156. doi: 10.1186/1471-2148-12-156. BMC Evol Biol. 2012. PMID: 22920653 Free PMC article. - The evolutionary history of protein fold families and proteomes confirms that the archaeal ancestor is more ancient than the ancestors of other superkingdoms.
Kim KM, Caetano-Anollés G. Kim KM, et al. BMC Evol Biol. 2012 Jan 27;12:13. doi: 10.1186/1471-2148-12-13. BMC Evol Biol. 2012. PMID: 22284070 Free PMC article. - Did Viruses Evolve As a Distinct Supergroup from Common Ancestors of Cells?
Harish A, Abroi A, Gough J, Kurland C. Harish A, et al. Genome Biol Evol. 2016 Aug 27;8(8):2474-81. doi: 10.1093/gbe/evw175. Genome Biol Evol. 2016. PMID: 27497315 Free PMC article. - Untangling the origin of viruses and their impact on cellular evolution.
Nasir A, Sun FJ, Kim KM, Caetano-Anollés G. Nasir A, et al. Ann N Y Acad Sci. 2015 Apr;1341:61-74. doi: 10.1111/nyas.12735. Epub 2015 Mar 10. Ann N Y Acad Sci. 2015. PMID: 25758413 Review. - Computing the origin and evolution of the ribosome from its structure - Uncovering processes of macromolecular accretion benefiting synthetic biology.
Caetano-Anollés G, Caetano-Anollés D. Caetano-Anollés G, et al. Comput Struct Biotechnol J. 2015 Jul 26;13:427-47. doi: 10.1016/j.csbj.2015.07.003. eCollection 2015. Comput Struct Biotechnol J. 2015. PMID: 27096056 Free PMC article. Review.
Cited by
- Multiple evolutionary origins of giant viruses.
Koonin EV, Yutin N. Koonin EV, et al. F1000Res. 2018 Nov 22;7:F1000 Faculty Rev-1840. doi: 10.12688/f1000research.16248.1. eCollection 2018. F1000Res. 2018. PMID: 30542614 Free PMC article. Review. - More Pieces of Ancient than Recent Theoretical Minimal Proto-tRNA-Like RNA Rings in Genes Coding for tRNA Synthetases.
Demongeot J, Seligmann H. Demongeot J, et al. J Mol Evol. 2019 Jul;87(4-6):152-174. doi: 10.1007/s00239-019-09892-6. Epub 2019 Apr 5. J Mol Evol. 2019. PMID: 30953098 - Ancestrality and Mosaicism of Giant Viruses Supporting the Definition of the Fourth TRUC of Microbes.
Colson P, Levasseur A, La Scola B, Sharma V, Nasir A, Pontarotti P, Caetano-Anollés G, Raoult D. Colson P, et al. Front Microbiol. 2018 Nov 27;9:2668. doi: 10.3389/fmicb.2018.02668. eCollection 2018. Front Microbiol. 2018. PMID: 30538677 Free PMC article. - Emergence of Hierarchical Modularity in Evolving Networks Uncovered by Phylogenomic Analysis.
Caetano-Anollés G, Aziz MF, Mughal F, Gräter F, Koç I, Caetano-Anollés K, Caetano-Anollés D. Caetano-Anollés G, et al. Evol Bioinform Online. 2019 Sep 5;15:1176934319872980. doi: 10.1177/1176934319872980. eCollection 2019. Evol Bioinform Online. 2019. PMID: 31523127 Free PMC article. Review. - The origin and evolution of viruses inferred from fold family structure.
Mughal F, Nasir A, Caetano-Anollés G. Mughal F, et al. Arch Virol. 2020 Oct;165(10):2177-2191. doi: 10.1007/s00705-020-04724-1. Epub 2020 Aug 3. Arch Virol. 2020. PMID: 32748179 Free PMC article. Review.
References
LinkOut - more resources
Full Text Sources
Other Literature Sources


