TRPM7 senses oxidative stress to release Zn2+ from unique intracellular vesicles - PubMed (original) (raw)
TRPM7 senses oxidative stress to release Zn2+ from unique intracellular vesicles
Sunday A Abiria et al. Proc Natl Acad Sci U S A. 2017.
Abstract
TRPM7 (transient receptor potential cation channel subfamily M member 7) regulates gene expression and stress-induced cytotoxicity and is required in early embryogenesis through organ development. Here, we show that the majority of TRPM7 is localized in abundant intracellular vesicles. These vesicles (M7Vs) are distinct from endosomes, lysosomes, and other familiar vesicles or organelles. M7Vs accumulate Zn2+ in a glutathione-enriched, reduced lumen when cytosolic Zn2+ concentrations are elevated. Treatments that increase reactive oxygen species (ROS) trigger TRPM7-dependent Zn2+ release from the vesicles, whereas reduced glutathione prevents TRPM7-dependent cytosolic Zn2+ influx. These observations strongly support the notion that ROS-mediated TRPM7 activation releases Zn2+ from intracellular vesicles after Zn2+ overload. Like the endoplasmic reticulum, these vesicles are a distributed system for divalent cation uptake and release, but in this case the primary divalent ion is Zn2+ rather than Ca2.
Keywords: TRPM7; vesicles; zinc.
Conflict of interest statement
The authors declare no conflict of interest.
Figures
Fig. 1.
Vesicular localization of TRPM7. (A) Immunofluorescence and differential interference contrast (DIC) images of an HEK293 cell expressing TRPM7-HA. (B and C) Superresolution (B) and transmission electron micrographs (C) of an HEK293 cell expressing TRPM7 tagged with GFP positioned on intravesicular residues (arrowheads indicate anti-GFP immunogold-labeled vesicles). (D and E) Vesicular localization of TRPM7 stably expressed in LN-18 glioma cells (D) and in SV40MES-13 glomerular mesangial cells (E). (F) Endogenous TRPM7 in mouse ES cells genetically tagged with GFP (Fig. S1 and Movie S1).
Fig. S1.
(Related to Fig. 1) TRPM7 is in acidic intracellular vesicles. (A) Confirmation of genetic tagging of endogenous TRPM7 with GFP. Reciprocal anti-GFP (Left) and anti-TRPM7 (Right) immunoprecipitations (IP) of TRPM7 from ES clones expressing endogenous WT (BO5 parental ES cell line) or GFP-TRPM7 (clones 29 and 33). Immunoprecipitates were analyzed by Western blotting for GFP or TRPM7. (B and C) HEK293 cells expressing TRPM7 tagged with pHluorin (placed in the S1/2 loop) were fixed and immunolabeled with anti-GFP and 5 mM gold-conjugated protein A. Quantification of immunogold labeling in untransfected control cells or cells expressing pHluorin-TRPM7 (vesicular vs. mitochondrial) (B) and M7V size distributions (C). Diameters of vesicular structures were quantified from 35 images. (D) HEK293 cells expressing pHluorin-TRPM7 were treated with 50 mM NH4Cl (pH 7.0) to alkalinize intracellular compartments, resulting in an increase in vesicular pHluorin fluorescence.
Fig. S2.
(Related to Figs. 3 and 4) Electrophysiological characterization of TRPM7 function after insertion of fluorescent protein sensors in the S1/S2 loop. (A) TRPM7 currents recorded in HEK293 cells expressing ZnGreen1 in the S1/S2 linker with or without extracellular Mg2+. (B) A TRPM7 DNA construct containing GCaMP6s in the S1/S2 linker was transfected in HEK293 cells, and TRPM7 currents were recorded in Mg2+-free intracellular solutions. Current/voltage (I/V) plots at break-in and the current run-up after Mg2+ chelation are shown. Traces are representative of three to five cells.
Fig. 2.
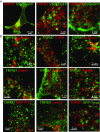
M7Vs are distinct from well-characterized intracellular vesicular compartments. (A) Immunocytochemistry of VSVG-GFP and TRPM7-HA vesicles in HEK293 cells. (B) Absence of colocalization of TRPM7-HA and markers of the ER (Calnexin), EDEMosomes (Edem1), the tyrosinase ER–Golgi intermediate compartment, peroxisomes (RFP-PTS and Pex19), lysosomes (Lamp1), melanosomes (Tyrosinase or Tyros), or clathrin-coated endosomes. See Table S1 for additional description of markers.
Fig. 3.
Purification of M7Vs. (A) Gradient centrifugation of endogenous M7Vs. PNS from SV40MES-13 cells was first separated on a sucrose gradient and then Western blotted for TRPM7, plasma membrane (Na+/K+ ATPase), ER (PDI: protein disulfide isomerase), and recycling endosome (Rab11) markers. (B) Postnuclear supernatants of HEK293 cells stably expressing TRPM7-HA (with GCaMP6s in the S1/2 loop) were isolated using mouse anti-HA–conjugated magnetic nanoparticles. Vesicles were visualized by incubation with Ca2+, and nanoparticles were detected with Alexa Fluor 546-conjugated anti-mouse secondary antibodies. (C) Anti-HA Western blot: HA-peptide blocks nanoparticle binding to vesicles. (D) Western blot of isolated vesicles: enrichment of vesicles and depletion of ER (Calnexin; Canx or PDI) and mitochondria (cyt-C). B, Bound; NB. Not bound. See also Fig. S3_A_.
Fig. S3.
(Related to Figs. 2_A_ and 3 and Dataset S1) Tandem affinity purification (TAP) and proteomic analysis of M7Vs. (A) Proteins of HEK293 cells expressing TRPM7 with an N-terminal FLAG-tag and cleavable C-terminal HA-tag were labeled with heavy isotopes of
l
-arginine and
l
-lysine (SILAC). After labeled cells were mixed with equal amounts of unlabeled, nontransfected wild-type (NT) cells, vesicles were isolated from the PNS using anti-HA–conjugated magnetic nanoparticles. Bound [immunoprecipitation (IP): HA, B] vesicles were eluted (IP: HA, EL) from nanoparticles using HRV-3C protease and were immunoprecipitated again with anti-FLAG–conjugated magnetic nanoparticles (IP FLAG: B). NB, not bound. TAP quality was monitored by Western blot of equal amounts of fractions for Na+/K+ ATPase, protein disulfide isomerase (PDI), cytochrome C (cyt-C), and Coomassie Blue protein staining. TAP vesicles then were analyzed by LC-MS-MS. (B) Images in Fig. 2_A_ are presented separately to depict colocalization of VIP36-V5 and TRPM7-HA in HEK293 cells.
Fig. 4.
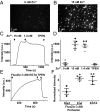
Zn2+ accumulation in purified vesicles. (A and B) M7Vs isolated from SV40MES-13 cells were loaded with FluoZin-3-AM and imaged in medium containing EGTA (A) or 15 nM Zn2+ (B). (C and D) Vesicles were perfused first with 15 nM Zn2+ and then with 1.4 nM Zn2+ or 50 µM TPEN. The mean, SD, and ANOVA statistics from four experiments are shown. *P < 0.001 compared with initial fluorescence; **P < 0.001 after TPEN addition. (E and F) Zn2+ trapping in vesicles is not caused by fluorophore accumulation: Zn2+-loaded vesicles were incubated with FluoZin-3-AM without Zn2+; then extravesicular dye was washed off, and remaining vesicular fluorescence was reduced by Zn2+ chelation by membrane-permeant TPEN but not membrane-impermeant EGTA. Fluorescence intensities in F were normalized to those in TPEN. Results are shown as the mean and SD from three experiments are shown; *P < 0.05; ANOVA. See also Fig. S4 A and B.
Fig. S4.
(Related to Fig. 5) M7Vs do not sequester Ca2+ or Mg2+. (A) M7Vs isolated from SV40MES-13 cells were loaded with Fluo4-AM (A) or MagFluo4 (B) and were perfused with the indicated concentrations of Ca2+ or Mg2+. Then, 5 µM Bromo-A23187 in 1 mM EDTA was used to deplete cations at the end of the time course. (C and D) HEK293 cells coexpressing GCaMP6s in the intravesicular loop of TRPM7 (green) and ER-targeted (RCEPIAer, red, C) or cytosolic (R-GECO1, red, D) Ca2+ sensors were stimulated with 100 µM ATP in HBSS. ATP-induced vesicular Ca2+ spikes (C and D, green) and synchronous Ca2+ efflux from the ER (C, red) or influx into the cytosol (D, red) were monitored simultaneously. Traces are representative of at least three experiments.
Fig. 5.
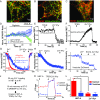
Zn2+ sequestration by M7Vs in intact cells. (A) Colocalization of VIP36-V5 and TRPM7-HA in HEK293 cells. (B) Colocalization of immunostained VIP36-eCALWY4 intravesicular Zn2+ sensor and TRPM7-HA in HEK293 cells. (C) Lack of colocalization of ER-targeted eCALWY4 and TRPM7-HA. (D) ER lumen-targeted RCEPIA1er was coexpressed with cytosol-facing GFP (located on the N terminus of TRPM7) or VIP36-eCALWY4. Then the plasma membrane was permeabilized with 20 µM digitonin, and proteinase K was added to digest cytosolic fluorescent proteins. ER lumen-targeted RCEPIA1er was used as a proteinase K-inaccessible control. (E) HEK293 cells expressing VIP36-eCALWY4 were incubated with 50 µM TPEN or 50 µM Zn2+/20 µM pyrithione. Shown are means and SEMs of seven cells in more than four representative time-course experiments. (F) eCALWY4 was targeted into the ER lumen using Sec61β, and cells were imaged in 50 µM TPEN or 50 µM Zn2+/20 µM pyrithione. Shown are the mean and SEM of seven cells in a representative time-course experiment. (G) HEK293 cells were transfected with either VIP36-eCALWY4 or eCALWY4 cDNA and then were incubated with 500 µM Zn2+, followed by 50 µM Zn2+/20 µM pyrithione and TPEN. Shown are time constants of Zn2+ entry and 95% CIs of 10–12 cells representative of multiple similar experiments; *P < 0.0001 after an extra sum of squares _F_-test comparison of the two curves. (H) Vesicular Zn2+ loading was initiated with 500 µM extracellular Zn2+, which then was replaced with 250 µM EGTA to chelate Zn2+. The mean and SEM of data from 19 cells from three experiments are plotted. (I) Cells expressing TRPM7 (ZnGreen1 inserted between the S1 and S2 domains of TRPM7) were perfused with Zn2+ and EGTA as in H. Plots show means and SEMs of cells from one experiment representative of more than three; axis breaks are 5 min. (J) The method for loading and releasing Zn2+ from M7Vs with luminal ZnGreen1. (K and L) After cytosolic and M7V-luminal ZnGreen1 were saturated with Zn2+ and cells were allowed to extrude cytosolic Zn2+ as described in J, residual cytosolic and vesicular Zn2+ were imaged in 50 µM HBT-A or 50 µM TPEN Zn2+/20 µM pyrithione. *P < 0.05, ANOVA after Tukey’s multiple comparison test of 24–36 cells from three experiments. See also Figs. S2–S5 and Dataset S1.
Fig. S5.
(Related to Fig. 5) Characterization of genetically encoded Zn2+ sensors. (A) Vesicular and nuclear Zn2+ were monitored concurrently in a mixture of HEK293 cells expressing VIP36-eCALWY4 or ZapCmR2-NLS and titrated with increasing Zn2+ concentrations in 20 µM pyrithione. (B) VIP36-eCALWY4 FRET was monitored in HEK293 cells before and after neutralization of vesicular pH with NH4Cl. (C) HEK293 cells expressing intravesicular ZnGreen1 (in the TRPM7 S1/2 loop) were incubated with 50 µM TPEN or 50 µM Zn2+/20 µM pyrithione. (D) Cytosolic and vesicular ZnGreen1 sensors were saturated (indicated by the axis break) 20 min after loading with 500 µM extracellular Zn2+ at room temperature. (E and F) Cytosolic (E) and vesicular (F) ZnGreen1 were titrated with increasing concentrations of Zn2+ in 20 µM pyrithione to determine Zn2+ affinities of the sensors. The K_ds of the TRPM7-conjugated sensors (21–2.9 nM) indicate higher affinity than that reported for the naked sensor (633 nM) (51). Note: We have inverted eCALWY-4 FRET changes to overlay the calibration curve of eCALWY-4 and that of a conventional FRET-based sensor (ZapCmR2) in Fig. S5_A. To keep the panels consistent, intensity changes of ZnGreen1 were also inverted.
Fig. 6.
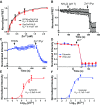
Regulation of TRPM7-mediated Zn2+ entry by the glutathione redox state. (A) Luciferase assay of GSH in postnuclear membranes and M7Vs purified from ES cells expressing HA-tagged endogenous TRPM7. The mean and SD of four replicates are plotted and compared by Student’s t test; *P < 0.01. (B and C) Cytosolic or intravesicular roGFP2 was maximally reduced with 10 mM DTT and maximally oxidized with 1 mM diamide in HBT-A. *P < 0.001 by Student’s t test, n = 35–42 cells. (D) HEK293 cells expressing eCALWY4 without (green only) or with mCherry-TRPM7 (green and red). (E) Time-course of Zn2+ entry into nontransfected HEK293 cells (NT, gray line), HEK293 cells overexpressing WT mCherry-TRPM7 (WT, black line), or loss-of-function pore-mutant mCherry-TRPM7 (PM, red line). After baseline imaging in HBT-A, cells were perfused with the Zn2+ chelator TPEN, followed by 50 µM Zn2+ and 50 µM Zn2+/20 µM pyrithione (Zn2+/Pyr) at the time points indicated by black arrows. (F) Time constants of Zn2+ entry into nontransfected and TRPM7-overexpressing HEK293 cells. Means and SD are plotted along with results of ANOVA with Kruskal–Wallis post test; asterisks indicate P < 0.05 compared with WT TRPM7-transfected cells. (G) Comparison of the effects of GSH (red line) and GSSG (purple line) on Zn2+ entry into HEK293 cells expressing eCALWY4 without (dashed line) or with (solid lines) mCherry-TRPM7. (H) Dose-dependence of GSH/GSSG effects on Zn2+ entry. τmax is the maximum time constant for Zn2+ entry (no inhibition); n = 3–10 cells; error bars indicate SEM. *P < 0.001. (I) Responses of Calcium Green-1 (low-affinity Zn2+ indicator), to Zn2+ in 100 µM TPEN or 1 mM GSH. The means and SEMs of three to six replicates are plotted; *P < 0.05 by ANOVA followed by a Kruskal–Wallis post test; a.u., arbitrary units. See Figs. S6 and S7 and Dataset S2.
Fig. S6.
Isolation of vesicles containing endogenous TRPM7. (A) Mouse ES cells containing a gene-trapped TRPM7 exon 1 (BO5) or their derivatives expressing HA-tagged endogenous TRPM7 were solubilized for anti-HA immunoprecipitation (IP) and Western blotting (WB) with anti-HA (Upper) or anti-TRPM7 (Lower). (B) Endogenous M7Vs were isolated from PNSs and were analyzed by Western blotting for HA and Na+/K+ ATPase or by Coomassie Blue (total protein) staining. B, bound; NB, not bound.
Fig. S7.
Relief of Zn2+ block of TRPM7 currents by glutathione. (A and B) The current/voltage (I/V) relationship of monovalent TRPM7 currents (A) and time course of currents (B) in HEK293 cells stably overexpressing GFP-TRPM7, with or without 1 mM Zn2+. (C) Dose-dependence of TRPM7 current inhibition by Zn2+. (D) Compositions of intracellular and extracellular recording solutions for E and F. (E) Enhancement of monovalent TRPM7 currents by reduced, but not oxidized, glutathione. (F) Enhancement of monovalent TRPM7 currents by GSH despite 20 mM Zn2+. Time elapsed just after (0 min) and 1 min after break-in with 140 mM NMDG intracellular solution is indicated. Traces are representative of 5–14 cells.
Fig. 7.
TRPM7 is required for ROS-induced Zn2+ release from intracellular stores. (A_–_C) Zn2+ release from M7Vs was monitored in WT (A and C) or TRPM7−/− (B and C) HEK293T cells expressing the VIP36-eCALWY4 intravesicular Zn2+ sensor. Cells first were incubated with 500 µM Zn2+ and then were perfused with 100 µM H2O2 in Zn2+-free HBT-A containing 250 µM EGTA and 4 mM MgCl2. WT and TRPM7−/− cells were compared by Student’s t test; *P < 0.0001, n = 21–39 cells. (D_–_F) FluoZin-3–loaded WT (D and F) or TRPM7−/− (E and F) HEK293T cells were similarly loaded with Zn2+ and then were treated with H2O2 in Zn2+-free extracellular medium. The means and SEMs of 44–67 cells are plotted; *P < 0.0001 compared with WT, Student’s t test. (G_–_I) Experiments were performed as in A_–_F, but 10 mM sodium dithionite, instead of H2O2, was applied to induce Zn2+ release from intracellular stores, and glucose was omitted from HBT-A. WT mCherry-TRPM7 was overexpressed to rescue the Zn2+ release in TRPM7−/− cells. The means and SEMs of 8–30 cells are plotted; *P < 0.0001 compared with WT, Student’s t test. a.u., arbitrary units.
Similar articles
- TRPM7 activates m-calpain by stress-dependent stimulation of p38 MAPK and c-Jun N-terminal kinase.
Su LT, Chen HC, González-Pagán O, Overton JD, Xie J, Yue L, Runnels LW. Su LT, et al. J Mol Biol. 2010 Mar 5;396(4):858-69. doi: 10.1016/j.jmb.2010.01.014. Epub 2010 Jan 11. J Mol Biol. 2010. PMID: 20070945 Free PMC article. - Local anesthetic lidocaine inhibits TRPM7 current and TRPM7-mediated zinc toxicity.
Leng TD, Lin J, Sun HW, Zeng Z, O'Bryant Z, Inoue K, Xiong ZG. Leng TD, et al. CNS Neurosci Ther. 2015 Jan;21(1):32-9. doi: 10.1111/cns.12318. Epub 2014 Aug 28. CNS Neurosci Ther. 2015. PMID: 25169754 Free PMC article. - The TRPM7 chanzyme is cleaved to release a chromatin-modifying kinase.
Krapivinsky G, Krapivinsky L, Manasian Y, Clapham DE. Krapivinsky G, et al. Cell. 2014 May 22;157(5):1061-72. doi: 10.1016/j.cell.2014.03.046. Cell. 2014. PMID: 24855944 Free PMC article. - TRPM7, Magnesium, and Signaling.
Zou ZG, Rios FJ, Montezano AC, Touyz RM. Zou ZG, et al. Int J Mol Sci. 2019 Apr 16;20(8):1877. doi: 10.3390/ijms20081877. Int J Mol Sci. 2019. PMID: 30995736 Free PMC article. Review. - Function and regulation of the channel-kinase TRPM7 in health and disease.
Visser D, Middelbeek J, van Leeuwen FN, Jalink K. Visser D, et al. Eur J Cell Biol. 2014 Oct;93(10-12):455-65. doi: 10.1016/j.ejcb.2014.07.001. Epub 2014 Jul 8. Eur J Cell Biol. 2014. PMID: 25073440 Review.
Cited by
- A bibliometric analysis and review of recent researches on TRPM7.
Zhang S, Zhao D, Jia W, Wang Y, Liang H, Liu L, Wang W, Yu Z, Guo F. Zhang S, et al. Channels (Austin). 2020 Dec;14(1):203-215. doi: 10.1080/19336950.2020.1788355. Channels (Austin). 2020. PMID: 32643506 Free PMC article. Review. - Endosomal fusion of pH-dependent enveloped viruses requires ion channel TRPM7.
Doyle CA, Busey GW, Iobst WH, Kiessling V, Renken C, Doppalapudi H, Stremska ME, Manjegowda MC, Arish M, Wang W, Naphade S, Kennedy J, Bloyet LM, Thompson CE, Rothlauf PW, Stipes EJ, Whelan SPJ, Tamm LK, Kreutzberger AJB, Sun J, Desai BN. Doyle CA, et al. Nat Commun. 2024 Oct 1;15(1):8479. doi: 10.1038/s41467-024-52773-w. Nat Commun. 2024. PMID: 39353909 Free PMC article. - On the Connections between TRPM Channels and SOCE.
Souza Bomfim GH, Niemeyer BA, Lacruz RS, Lis A. Souza Bomfim GH, et al. Cells. 2022 Apr 1;11(7):1190. doi: 10.3390/cells11071190. Cells. 2022. PMID: 35406753 Free PMC article. Review. - Airway Smooth Muscle Regulated by Oxidative Stress in COPD.
Kume H, Yamada R, Sato Y, Togawa R. Kume H, et al. Antioxidants (Basel). 2023 Jan 6;12(1):142. doi: 10.3390/antiox12010142. Antioxidants (Basel). 2023. PMID: 36671004 Free PMC article. Review. - The kinase activity of the channel-kinase protein TRPM7 regulates stability and localization of the TRPM7 channel in polarized epithelial cells.
Cai N, Lou L, Al-Saadi N, Tetteh S, Runnels LW. Cai N, et al. J Biol Chem. 2018 Jul 20;293(29):11491-11504. doi: 10.1074/jbc.RA118.001925. Epub 2018 Jun 4. J Biol Chem. 2018. PMID: 29866880 Free PMC article.
References
- Nadler MJ, et al. LTRPC7 is a Mg.ATP-regulated divalent cation channel required for cell viability. Nature. 2001;411:590–595. - PubMed
- Runnels LW, Yue L, Clapham DE. TRP-PLIK, a bifunctional protein with kinase and ion channel activities. Science. 2001;291:1043–1047. - PubMed
- Aarts M, et al. A key role for TRPM7 channels in anoxic neuronal death. Cell. 2003;115:863–877. - PubMed
Publication types
MeSH terms
Substances
Grants and funding
- R00 HL124070/HL/NHLBI NIH HHS/United States
- HHMI/Howard Hughes Medical Institute/United States
- T32 HL007572/HL/NHLBI NIH HHS/United States
- K99 HL124070/HL/NHLBI NIH HHS/United States
- R00 DK106655/DK/NIDDK NIH HHS/United States
LinkOut - more resources
Full Text Sources
Other Literature Sources
Molecular Biology Databases
Research Materials
Miscellaneous


