Genomic landscape of human diversity across Madagascar - PubMed (original) (raw)
. 2017 Aug 8;114(32):E6498-E6506.
doi: 10.1073/pnas.1704906114. Epub 2017 Jul 17.
Margit Heiske 1, Harilanto Razafindrazaka 1, Ignace Rakoto 2, Nelly Rabetokotany 2, Bodo Ravololomanga 2, Lucien M-A Rakotozafy 2, Mireille Mialy Rakotomalala 2, Michel Razafiarivony 2, Bako Rasoarifetra 2, Miakabola Andriamampianina Raharijesy 2, Lolona Razafindralambo 2, Ramilisonina 2, Fulgence Fanony 2, Sendra Lejamble 3, Olivier Thomas 3, Ahmed Mohamed Abdallah 3, Christophe Rocher 3, Amal Arachiche 3, Laure Tonaso 1, Veronica Pereda-Loth 1, Stéphanie Schiavinato 1, Nicolas Brucato 1, Francois-Xavier Ricaut 1, Pradiptajati Kusuma 1 4 5, Herawati Sudoyo 4 5, Shengyu Ni 6, Anne Boland 7, Jean-Francois Deleuze 7, Philippe Beaujard 8, Philippe Grange 9, Sander Adelaar 10, Mark Stoneking 6, Jean-Aimé Rakotoarisoa 11, Chantal Radimilahy 11, Thierry Letellier 12
Affiliations
- PMID: 28716916
- PMCID: PMC5559028
- DOI: 10.1073/pnas.1704906114
Genomic landscape of human diversity across Madagascar
Denis Pierron et al. Proc Natl Acad Sci U S A. 2017.
Abstract
Although situated ∼400 km from the east coast of Africa, Madagascar exhibits cultural, linguistic, and genetic traits from both Southeast Asia and Eastern Africa. The settlement history remains contentious; we therefore used a grid-based approach to sample at high resolution the genomic diversity (including maternal lineages, paternal lineages, and genome-wide data) across 257 villages and 2,704 Malagasy individuals. We find a common Bantu and Austronesian descent for all Malagasy individuals with a limited paternal contribution from Europe and the Middle East. Admixture and demographic growth happened recently, suggesting a rapid settlement of Madagascar during the last millennium. However, the distribution of African and Asian ancestry across the island reveals that the admixture was sex biased and happened heterogeneously across Madagascar, suggesting independent colonization of Madagascar from Africa and Asia rather than settlement by an already admixed population. In addition, there are geographic influences on the present genomic diversity, independent of the admixture, showing that a few centuries is sufficient to produce detectable genetic structure in human populations.
Keywords: Indian Ocean; Malagasy origins; genetics; genome-wide data; proto-globalization.
Conflict of interest statement
The authors declare no conflict of interest.
Figures
Fig. 1.
Geographic distribution of Asian and African genetic ancestry across Madagascar. (A) Sampling grid across Madagascar: Three to four villages were sampled in each of 82 spots that are each 50 km in diameter. Image courtesy of Google Earth ©2016 TerraMetrics. (B) Exponential kriging interpolation of the ancestry across the Madagascar landscape based on the frequency of mtDNA lineages and Y chromosome lineages in each village and the average of Admixture (k = 3) analysis for genome-wide data based on the high-density panel.
Fig. 2.
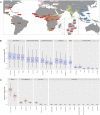
Uniparental lineages. (A) Distribution of mtDNA lineages according to continental origin. Asian lineages are in blue, African lineages are in red, and M23 (unknown origin) is in purple. (B) Distribution of Y chromosome lineages according to continental origin. Asian lineages are in blue, African lineages are in red, and Eurasian lineages are in green.
Fig. 3.
Genome-wide analysis: Admixture plots based on a worldwide population panel (Dataset S1: low density) for k = 9. (A) Boxplot of the distribution of shared IBD segments between any Malagasy and any individual from the reference population in high-density panel 2 from Eurasia in blue (B) or Africa in red (C).
Fig. 4.
Genetic groups. (A) Geographic distribution of genetic groups in Madagascar. Each dot represents a village, and the intensity of the color corresponds to the relative presence of individuals of each group. (B) Kriging model of the spatial distribution of genetic groups based on the frequency of each group in each sampled village. (C) Superposition of all genetic groups distributions (based on kriging model). Colors were assigned according to the dominant genetic cluster present in a given area. Plain colors were used for locations where the majority of people (>50%) belong to this cluster.
Fig. 5.
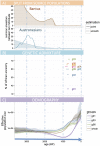
Demographic model of the settlement of Madagascar. The plots in the three panels share the same x axis. (A) Timeline of the point and smoothed estimation of the average number of common ancestors shared between Malagasy and Borneo (in blue) and Malagasy and Bantu (in red) populations, as estimated by shared IBD segments from genome-wide data. (B) Estimation of percentage and date of admixture for each genetic group of Madagascar. The straight line represents the uncertainty (±1 SD) of admixture dates estimated from GLOBEtrotter. Some populations overlap. (More detailed results are provided in Fig. S7_B_). (C) Estimation of changes in the effective population size across time for selected genetic groups and for the whole Malagasy population, estimated by shared IBD genome-wide.
Fig. 6.
Overview of the inferred history of Madagascar. Descriptions and dates are given in A_–_D.
Similar articles
- The dual origin of the Malagasy in Island Southeast Asia and East Africa: evidence from maternal and paternal lineages.
Hurles ME, Sykes BC, Jobling MA, Forster P. Hurles ME, et al. Am J Hum Genet. 2005 May;76(5):894-901. doi: 10.1086/430051. Epub 2005 Mar 25. Am J Hum Genet. 2005. PMID: 15793703 Free PMC article. - On the origins and admixture of Malagasy: new evidence from high-resolution analyses of paternal and maternal lineages.
Tofanelli S, Bertoncini S, Castrì L, Luiselli D, Calafell F, Donati G, Paoli G. Tofanelli S, et al. Mol Biol Evol. 2009 Sep;26(9):2109-24. doi: 10.1093/molbev/msp120. Epub 2009 Jun 17. Mol Biol Evol. 2009. PMID: 19535740 - Malagasy Genetic Ancestry Comes from an Historical Malay Trading Post in Southeast Borneo.
Brucato N, Kusuma P, Cox MP, Pierron D, Purnomo GA, Adelaar A, Kivisild T, Letellier T, Sudoyo H, Ricaut FX. Brucato N, et al. Mol Biol Evol. 2016 Sep;33(9):2396-400. doi: 10.1093/molbev/msw117. Epub 2016 Jul 5. Mol Biol Evol. 2016. PMID: 27381999 Free PMC article. - Genetic evidence and historical theories of the Asian and African origins of the present Malagasy population.
Heiske M, Alva O, Pereda-Loth V, Van Schalkwyk M, Radimilahy C, Letellier T, Rakotarisoa JA, Pierron D. Heiske M, et al. Hum Mol Genet. 2021 Apr 26;30(R1):R72-R78. doi: 10.1093/hmg/ddab018. Hum Mol Genet. 2021. PMID: 33481023 Review. - Population genomics of East Asian ethnic groups.
Pan Z, Xu S. Pan Z, et al. Hereditas. 2020 Dec 8;157(1):49. doi: 10.1186/s41065-020-00162-w. Hereditas. 2020. PMID: 33292737 Free PMC article. Review.
Cited by
- Genetic origins and diversity of bushpigs from Madagascar (Potamochoerus larvatus, family Suidae).
Lee C, Day J, Goodman SM, Pedrono M, Besnard G, Frantz L, Taylor PJ, Herrera MJ, Gongora J. Lee C, et al. Sci Rep. 2020 Nov 26;10(1):20629. doi: 10.1038/s41598-020-77279-5. Sci Rep. 2020. PMID: 33244111 Free PMC article. - Global importance of Indigenous Peoples, their lands, and knowledge systems for saving the world's primates from extinction.
Estrada A, Garber PA, Gouveia S, Fernández-Llamazares Á, Ascensão F, Fuentes A, Garnett ST, Shaffer C, Bicca-Marques J, Fa JE, Hockings K, Shanee S, Johnson S, Shepard GH, Shanee N, Golden CD, Cárdenas-Navarrete A, Levey DR, Boonratana R, Dobrovolski R, Chaudhary A, Ratsimbazafy J, Supriatna J, Kone I, Volampeno S. Estrada A, et al. Sci Adv. 2022 Aug 12;8(32):eabn2927. doi: 10.1126/sciadv.abn2927. Epub 2022 Aug 10. Sci Adv. 2022. PMID: 35947670 Free PMC article. Review. - Genome Analysis Using Whole-Exome Sequencing of Non-Syndromic Cleft Lip and/or Palate from Malagasy Trios Identifies Variants Associated with Cilium-Related Pathways and Asian Genetic Ancestry.
Manojlovic Z, Auslander A, Jin Y, Schmidt RJ, Xu Y, Chang S, Song R, Ingles SA, Nunes A, Vavra KC, Feigelson D, Rakotoarison S, DiBona M, Magee K, Smile O, Ramamonjisoa A, Magee Iii W. Manojlovic Z, et al. Genes (Basel). 2023 Mar 7;14(3):665. doi: 10.3390/genes14030665. Genes (Basel). 2023. PMID: 36980938 Free PMC article. - A multimillennial climatic context for the megafaunal extinctions in Madagascar and Mascarene Islands.
Li H, Sinha A, Anquetil André A, Spötl C, Vonhof HB, Meunier A, Kathayat G, Duan P, Voarintsoa NRG, Ning Y, Biswas J, Hu P, Li X, Sha L, Zhao J, Edwards RL, Cheng H. Li H, et al. Sci Adv. 2020 Oct 16;6(42):eabb2459. doi: 10.1126/sciadv.abb2459. Print 2020 Oct. Sci Adv. 2020. PMID: 33067226 Free PMC article. - Dialects of Madagascar.
Serva M, Pasquini M. Serva M, et al. PLoS One. 2020 Oct 2;15(10):e0240170. doi: 10.1371/journal.pone.0240170. eCollection 2020. PLoS One. 2020. PMID: 33007011 Free PMC article.
References
- Beaujard P. Les mondes de l’océan Indien. Armand Colin; Paris: 2012.
- Adelaar K. Malay influence on Malagasy; historical and linguistic inferences. Ocean Ling. 1989;28:1–46.
- Allibert C. Migration austronésienne et mise en place de la civilisation malgache. Lectures croisées: Linguistique, archéologie, génétique, anthropologie culturelle. Diogène. 2007;2:6–17.
- Beaujard P. The first migrants to Madagascar and their introduction of plants: Linguistic and ethnological evidence. Azania. 2011;46:169–189.
Publication types
MeSH terms
LinkOut - more resources
Full Text Sources
Other Literature Sources


