In vivo CRISPR screening identifies Ptpn2 as a cancer immunotherapy target - PubMed (original) (raw)
. 2017 Jul 27;547(7664):413-418.
doi: 10.1038/nature23270. Epub 2017 Jul 19.
Robert T Manguso 1 2 3, Margaret D Zimmer 1 3, Flavian D Brown 1 2, Kathleen B Yates 1 3, Brian C Miller 1 3 4, Natalie B Collins 1 3 5, Kevin Bi 1 3, Martin W LaFleur 1 2, Vikram R Juneja 6, Sarah A Weiss 1, Jennifer Lo 7, David E Fisher 7, Diana Miao 2 3, Eliezer Van Allen 2 3, David E Root 3, Arlene H Sharpe 5 8, John G Doench 3, W Nicholas Haining 1 3 5
Affiliations
- PMID: 28723893
- PMCID: PMC5924693
- DOI: 10.1038/nature23270
In vivo CRISPR screening identifies Ptpn2 as a cancer immunotherapy target
Robert T Manguso et al. Nature. 2017.
Abstract
Immunotherapy with PD-1 checkpoint blockade is effective in only a minority of patients with cancer, suggesting that additional treatment strategies are needed. Here we use a pooled in vivo genetic screening approach using CRISPR-Cas9 genome editing in transplantable tumours in mice treated with immunotherapy to discover previously undescribed immunotherapy targets. We tested 2,368 genes expressed by melanoma cells to identify those that synergize with or cause resistance to checkpoint blockade. We recovered the known immune evasion molecules PD-L1 and CD47, and confirmed that defects in interferon-γ signalling caused resistance to immunotherapy. Tumours were sensitized to immunotherapy by deletion of genes involved in several diverse pathways, including NF-κB signalling, antigen presentation and the unfolded protein response. In addition, deletion of the protein tyrosine phosphatase PTPN2 in tumour cells increased the efficacy of immunotherapy by enhancing interferon-γ-mediated effects on antigen presentation and growth suppression. In vivo genetic screens in tumour models can identify new immunotherapy targets in unanticipated pathways.
Conflict of interest statement
The authors declare no competing financial interests.
Figures
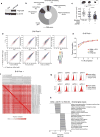
Extended Data Figure 1. Analysis of screen performance
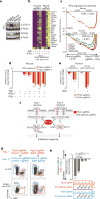
a, Western blot of for Cas9 and β-actin B16 cell lysate of uninfected cells or after transduction with a lentiviral vector encoding Cas9. For western blot source data, see Supplementary Fig. 1. b, Pie chart showing the fraction of genes targeted in the screen in each of the GO term categories indicated. c, Tumour volume for individual animals (dots) on the day of euthanasia in the conditions indicated. Data are mean ± s.d. d, 2D frequency histograms showing the pair wise distribution of sgRNAs abundance (averaged for each condition). e, Saturation analysis of animal replicates from the three in vivo screening conditions. Pearson’s correlations are calculated for the library distribution in one animal versus any other animal, then for two animals averaged versus any other two averaged, and so on. Saturation approaches r = 0.95. f, A matrix of the Pearson’s correlations of the library distribution from one animal compared to any other animal for B16 pool 1. g, Expression of PD-L1 (top) or CD47 (bottom) after infection of B16-Cas9 cells with four different sgRNAs targeting the indicated gene. h, Enrichment analysis (hypergeometric test) of functional classes of genes (GO) targeted by sgRNAs that were enriched or depleted in tumours in animals treated with GVAX and anti-PD-1 compared to _Tcra_−/− animals. **P <0.01; ***P< 0.001; ****P< 0.0001.
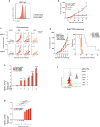
Extended Data Figure 2. Additional validation data for screen hits
a, Expression of CD47 by B16 cells transfected with either CD47-targeting (red) or control (grey) sgRNA. b, Tumour volume over time for CD47− null or control tumours growing in mice treated with GVAX and PD-1 blockade. Data are mean ± s.e.m.; n = 10 animals per group; representative of two independent experiments. c, Tumour growth in immunotherapy-treated animals challenged with B16 cells lacking the indicated genes. Each line represents one animal; n = 5 animals per group. d, Tumour volume averaged for each group at each time point (left) and survival (right) for Braf/Pten melanoma cells lacking the indicated gene in mice treated with PD-1 blockade. Data are mean ± s.e.m.; n = 5 animals per group. e, Change in the ratios (log2(normalized fold change)) of B16 cells lacking the indicated genes:control cells after in vitro culture with the combinations of cytokines indicated below. Data are mean ± s.e.m.; n = 3 replicates per group. f, Expression of MHC-I (H2K(b)/H2D(b)) on B16 cells lacking the indicated genes with or without IFNγ treatment. g, Change in the ratios (log2(normalized fold change)) of OVA-expressing B16 cells lacking the indicated genes:control cells after in vitro co-culture with OVA-specific T cells at the indicated ratio of T cells:tumour cells. Data are mean ± s.d.; n = 3 replicates per group. *P < 0.05; **P< 0.01; ***P < 0.001; ****P < 0.0001.
Extended Data Figure 3. Additional validation data for Ptpn2
a, Western blot of B16 cell lysate for PTPN2 and β-actin after transfection with either control or _Ptpn2_-targeting sgRNAs. For western blot source data, see Supplementary Fig. 1. b, Ptpn2 transcript abundance for the same conditions as in a measured by qPOR. Data are mean ± s.d. c, Change in the ratios (log2(normalized fold change)) of B16 cells lacking Ptpn2:control cells in immunotherapy-treated mice relative to _Tcra_−/− mice with three different sgRNAs. Data are mean ± s.d.; n = 5 animals per group; representative of two independent experiments. d, Survival analysis for _Ptpn2_-null (red) or control (grey) B16 cells growing in mice treated with GVAX and PD-1 blockade. n = 20 animals per group; representative of two independent experiments. **P <0.01; ****p< 0.0001.
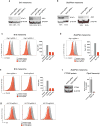
Extended Data Figure 4. Deletion of screen hits from tumour cells
a, Western blot of B16 cell lysate for STAT1 (left) and JAK1 (right) after transfection with the indicated sgRNA and Cas9. β-Actin serves as a loading control for each. The numbers below the lane indicate the per cent expression of the target relative to control sgRNA cells. b, The same as in a, but for Braf/Pten melanoma cells. c, Expression of Ifngr1 in B16 cells transfected with the indicated _Ifngr1_-targeting (red) or control (grey) sgRNA and Cas9 (left) and quantification of mean fluorescence intensity (right). d, The same as in c, but for Braf/Pten melanoma cells. e, Expression of Ifnar2 in B16 cells transfected with the indicated _Ifnar2_-targeting or control sgRNA and Cas9 (left) and quantification of mean fluorescence intensity (right). f, Western blot of Braf/Pten melanoma cell lysate for PTPN2 and β-actin after transfection with either control or _Ptpn2_-targeting sgRNAs (left) and Ptpn2 transcript abundance for the same conditions measured by qPCR (right). Data are mean ± s.d. g, Expression of H2-T23 by B16-Cas9 cells infected with the indicated H2-T23-targeting (red) and control (grey) sgRNA. For western blot source data, see Supplementary Fig. 1. **P < 0.01.
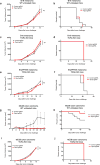
Extended Data Figure 5. Ptpn2-null tumour cells do not have a growth disadvantage in vivo in the absence of T cells or immunotherapy and MC38 colon carcinoma cells are sensitive to Ptpn2 deletion in vivo
a, Tumour volume averaged for each group at each time point for _Ptpn2_-null (red) or control (grey) B16 cells growing in wild-type (WT) mice with no treatment. Data are mean ± s.e.m.; n = 10 animals per group. b, Survival analysis for the groups shown in a. c, Tumour volume averaged for each group at each time point for Ptpn2-null or control B16 cells growing in _Tcra_−/− mice with no treatment. Data are mean ± s.e.m.; n = 10 animals per group. d, Survival analysis for the groups shown in c. Both groups reached the end point on the same day. e, Tumour volume averaged for each group at each time point for Ptpn2-null or control Braf/Pten melanoma cells growing in _Tcra_−/− mice with no treatment. Data are mean ± s.e.m.; n = 5 animals per group. f, Survival analysis for the groups shown in e. g, Tumour volume averaged for each group at each time point for Ptpn2-null or control MC38 cells growing in wild-type mice with no treatment. Data are mean ± s.e.m.; n = 10 animals per group. h, Survival analysis for the groups shown in g. i, Tumour volume averaged for each group at each time point for Ptpn2-null or control MC38 cells growing in _Tcra_−/− mice with no treatment. Data are mean ± s.e.m.; n = 5 animals per group. j, Survival analysis for the groups shown in i. Both groups reached the end point on the same day. *P < 0.05.
Extended Data Figure 6. Analysis of Ptpn2 amplifications in human cancer using exome sequencing
a, Patients treated with anti-PD-1, anti-PD-L1 or anti-CTLA-4 therapies in four cancer types: bladder cancer, head and neck squamous cell carcinoma (HNSCC), lung cancer and melanoma with copy-number amplifications (CNA) of PTPN2 were grouped according to whether or not they received clinical benefit from immunotherapy. The mutational burden is indicated on the y axis and the type of amplification event (focal, arm level or chromosome level) is indicated for each patient.
Extended Data Figure 7. Ptpn2-null tumours have increased effector T cell populations, but no other significant differences in immune infiltrates compared with control tumours were found
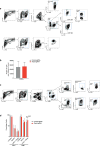
a, Representative plots showing the gating strategy for the data shown in Fig. 4a. Populations of interest are gated in blue. b, The number of CD45+ cells per mg of tumour for Ptpn2-null (red) and control (grey) B16 tumours. Data are mean ± s.d. c, Representative plots showing the gating strategy for the quantification of T cell populations from _Ptpn2_-null and control B16 tumours shown in d. Populations of interest are gated in blue. d, Quantification of effector T cell populations in either _Ptpn2_-null or control B16 tumours. Data mean ± s.d. Data pooled from two independent experiments with a minimum of eight mice per group.
Extended Data Figure 8. Ptpn2-null tumours show no significant differences in myeloid cell infiltration compared to control tumours
a, Representative plots showing the gating strategy for the myeloid cell populations quantified in b. Populations of interest are gated in blue. b, Numbers of myeloid cells per mg of tumour for Ptpn2-null (red) and control (grey) B16 tumours. Data are mean s.d. Data pooled from two independent experiments with a minimum of eight mice per group.
Extended Data Figure 9. Ptpn2-null tumour cells have increased MHC-I expression after IFNγ stimulation and have increased sensitivity to costimulation with TNF and IFNγ
a, Expression of MHC-I (H2K(b)/H2D(b)) on either Ptpn2-null (red) or control (grey) B16 cells after stimulation with IFNγ for 72 h (left) and quantification of mean fluorescence intensity (right). Data are mean ± s.d. b, Gene set enrichment analysis showing enrichment of signatures for IFNγ, IFNα and TNFα signalling via NF-κB in Ptpn2-null B16 cells after costimulation with TNF and IFNγ relative to Ptpn2-null cells stimulated with IFNγ alone.
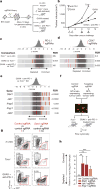
Figure 1. In vivo CRISPR–Cas9 screening recovers known mediators of immune evasion and resistance
a, Diagram of screening system. b, Tumour volume averaged for groups indicated. n = 40 per group. c, Frequency histograms of enrichment or depletion (z score) for all sgRNAs. sgRNAs targeting indicated genes are shown by the red lines. d, Depletion of CD47-targeting sgRNAs. e, Enrichment of IFNγ pathway sgRNAs. f, Diagram of in vivo competition assay. g, Ratio of control:control and control:_Stat1_-null B16 cells for conditions indicated. h, Change in the ratios of B16 cells lacking the indicated genes in immunotherapy-treated mice compared with _Tcra_−/− mice. Data are mean ± s.e.m.; n = 8–10 mice per group). **P < 0.01; ***P < 0.001.
Figure 2. Loss-of-function screening identifies targets that increase the efficacy of immunotherapy
a, Frequency histograms of enrichment or depletion of sgRNAs targeting genes indicated. b, Competition assays of tumour cells lacking Ptpn2, H2-T23, Ripk1 or Stub1. c, Ratios of tumour cells lacking the indicated genes. n = 3–13 mice per group; representative of two independent experiments. d, e, Tumour volume (d) and survival analysis (e) of H2-T23-null (red) or control (grey) B16 tumours. Data are mean ± s.e.m.; n = 10 mice per group; representative of two independent experiments. *P < 0.05; **P < 0.01; ***P < 0.001; ****P < 0.0001.
Figure 3. Deletion of Ptpn2 sensitizes tumours to immunotherapy
a, b, Tumour volume for control tumours or those with gene deletions as indicated in B16 melanoma (a; n = 20 animals per group; representative of three independent experiments) and Braf/Pten melanoma (b; n = 10 animals per group; representative of two independent experiments; data are mean ± s.e.m.). c, d, Flow plots (c) and change in ratios (d) of _Ptpn2_-null, Ptpn2 rescued or overexpressing B16 cells relative to control B16 cells. n = 5 animals per group. Data are mean ± s.d. *P < 0.05; **P < 0.01; ***P < 0.001.
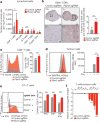
Figure 4. Deletion of Ptpn2 improves antigen presentation and T cell stimulation
a, Quantification of immune cells in _Ptpn2_-null (red) or control (grey) B16 tumours. n = 8-10 animals per group; data from two experiments. b, Immunohistochemistry for CD8α in control or _Ptpn2_-null tumours. n = 4-5 animals per group. c, Granzyme B (Gzmb) expression by CD8+ T cells in _Ptpn2_-null or control B16 tumours. n = 8-10 animals per group; data from two experiments. d, SIINFEKL-H2K(b) presentation by _Ptpn2_-null or control B16 cells. MFI, mean fluorescence intensity. e, Intracellular IFNγ and TNF staining in CD8+ T cells after restimulation with _Ptpn2_-null or control B16 cells. f, Ratios of B16 cells lacking the indicated genes after co-culture with antigen-specific T cells. n = 3; representative of two independent experiments. Data are mean ± s.d. *P <0.05; **P< 0.01; ***P< 0.001.
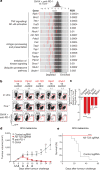
Figure 5. Deletion of Ptpn2 sensitizes tumours to IFNγ
a, p-STAT1 after IFNγ treatment of control, _Ptpn2_-null, rescued or overexpressing (OX) B16 cells. For western blot source data, see Supplementary Fig. 1. b, IFNγ response gene expression in _Ptpn2_-null or control B16 cells. c, Gene set enrichment analysis of IFNγ response genes in mouse and human tumour cell lines. d, e, Ratios of mouse (d) or human (e) tumour cells with the indicated sgRNA cultured with the indicated cytokines. n = 3 replicates; representative of two independent experiments. Data are mean ± s.d. f, Diagram of the type I and type II interferon pathway. g, Flow cytometry plots showing frequencies of Stat1/Ptpn2 double-null cells versus _Stat1_-null cells (right) and _Ptpn2_-null cells versus control cells (left) in the condition indicated. n = 5 mice per group. h, Change in ratio of Stat1/Ptpn2 double-null cells versus _Stat1_-null cells and _Ptpn2_-null cells versus control cells in the condition indicated. **P < 0.01; ***P < 0.001; NS, not significant.
Republished in
- Immunotherapy: Searching in the immune checkpoint black box.
Villanueva MT. Villanueva MT. Nat Rev Cancer. 2017 Sep;17(9):511. doi: 10.1038/nrc.2017.75. Epub 2017 Aug 24. Nat Rev Cancer. 2017. PMID: 28835721 No abstract available.
Comment in
- Cancer immunotherapy: Searching in the immune checkpoint black box.
Villanueva MT. Villanueva MT. Nat Rev Drug Discov. 2017 Sep;16(9):599. doi: 10.1038/nrd.2017.163. Epub 2017 Aug 11. Nat Rev Drug Discov. 2017. PMID: 28799544 No abstract available. - PTPN2: a tumor suppressor you want deleted?
Wiede F, Tiganis T. Wiede F, et al. Immunol Cell Biol. 2017 Nov;95(10):859-861. doi: 10.1038/icb.2017.70. Epub 2017 Oct 10. Immunol Cell Biol. 2017. PMID: 28994418 No abstract available. - CRISPR takes genetic screens forward.
Neff EP. Neff EP. Lab Anim (NY). 2020 Jan;49(1):13-16. doi: 10.1038/s41684-019-0445-0. Lab Anim (NY). 2020. PMID: 31853027 No abstract available.
Similar articles
- Natural Killer Cells Suppress T Cell-Associated Tumor Immune Evasion.
Freeman AJ, Vervoort SJ, Ramsbottom KM, Kelly MJ, Michie J, Pijpers L, Johnstone RW, Kearney CJ, Oliaro J. Freeman AJ, et al. Cell Rep. 2019 Sep 10;28(11):2784-2794.e5. doi: 10.1016/j.celrep.2019.08.017. Cell Rep. 2019. PMID: 31509742 - Loss of ADAR1 in tumours overcomes resistance to immune checkpoint blockade.
Ishizuka JJ, Manguso RT, Cheruiyot CK, Bi K, Panda A, Iracheta-Vellve A, Miller BC, Du PP, Yates KB, Dubrot J, Buchumenski I, Comstock DE, Brown FD, Ayer A, Kohnle IC, Pope HW, Zimmer MD, Sen DR, Lane-Reticker SK, Robitschek EJ, Griffin GK, Collins NB, Long AH, Doench JG, Kozono D, Levanon EY, Haining WN. Ishizuka JJ, et al. Nature. 2019 Jan;565(7737):43-48. doi: 10.1038/s41586-018-0768-9. Epub 2018 Dec 17. Nature. 2019. PMID: 30559380 Free PMC article. - Chimeric antigen receptor engineered NK cellular immunotherapy overcomes the selection of T-cell escape variant cancer cells.
Lee MY, Robbins Y, Sievers C, Friedman J, Abdul Sater H, Clavijo PE, Judd N, Tsong E, Silvin C, Soon-Shiong P, Padget MR, Schlom J, Hodge J, Hinrichs C, Allen C. Lee MY, et al. J Immunother Cancer. 2021 Mar;9(3):e002128. doi: 10.1136/jitc-2020-002128. J Immunother Cancer. 2021. PMID: 33741731 Free PMC article. - CRISPR screen in mechanism and target discovery for cancer immunotherapy.
Liu D, Zhao X, Tang A, Xu X, Liu S, Zha L, Ma W, Zheng J, Shi M. Liu D, et al. Biochim Biophys Acta Rev Cancer. 2020 Aug;1874(1):188378. doi: 10.1016/j.bbcan.2020.188378. Epub 2020 May 13. Biochim Biophys Acta Rev Cancer. 2020. PMID: 32413572 Review. - PTPN2 in the Immunity and Tumor Immunotherapy: A Concise Review.
Song J, Lan J, Tang J, Luo N. Song J, et al. Int J Mol Sci. 2022 Sep 2;23(17):10025. doi: 10.3390/ijms231710025. Int J Mol Sci. 2022. PMID: 36077422 Free PMC article. Review.
Cited by
- Oncolytic Virotherapy: The Cancer Cell Side.
Ehrlich M, Bacharach E. Ehrlich M, et al. Cancers (Basel). 2021 Feb 24;13(5):939. doi: 10.3390/cancers13050939. Cancers (Basel). 2021. PMID: 33668131 Free PMC article. Review. - Targeting the NF-κB pathway as a potential regulator of immune checkpoints in cancer immunotherapy.
Ebrahimi N, Abdulwahid ARR, Mansouri A, Karimi N, Bostani RJ, Beiranvand S, Adelian S, Khorram R, Vafadar R, Hamblin MR, Aref AR. Ebrahimi N, et al. Cell Mol Life Sci. 2024 Feb 29;81(1):106. doi: 10.1007/s00018-023-05098-8. Cell Mol Life Sci. 2024. PMID: 38418707 Free PMC article. Review. - PINCER: improved CRISPR/Cas9 screening by efficient cleavage at conserved residues.
Veeneman B, Gao Y, Grant J, Fruhling D, Ahn J, Bosbach B, Bienkowska J, Follettie M, Arndt K, Myers J, Zhong W. Veeneman B, et al. Nucleic Acids Res. 2020 Sep 25;48(17):9462-9477. doi: 10.1093/nar/gkaa645. Nucleic Acids Res. 2020. PMID: 32821942 Free PMC article. - Therapeutic potential of targeting protein tyrosine phosphatases in liver diseases.
Wang A, Zhang Y, Lv X, Liang G. Wang A, et al. Acta Pharm Sin B. 2024 Aug;14(8):3295-3311. doi: 10.1016/j.apsb.2024.05.006. Epub 2024 May 13. Acta Pharm Sin B. 2024. PMID: 39220870 Free PMC article. Review. - Combing the Cancer Genome for Novel Kinase Drivers and New Therapeutic Targets.
Torres-Ayuso P, Brognard J. Torres-Ayuso P, et al. Cancers (Basel). 2019 Dec 7;11(12):1972. doi: 10.3390/cancers11121972. Cancers (Basel). 2019. PMID: 31817861 Free PMC article. Review.
References
- Reck M, et al. Pembrolizumab versus chemotherapy for PD-L1-positive non-small-cell lung cancer. N Engl J Med. 2016;375:1823–1833. - PubMed
- Dong H, et al. Tumor-associated B7-H1 promotes T-cell apoptosis: a potential mechanism of immune evasion. Nat Med. 2002;8:793–800. - PubMed
Publication types
MeSH terms
Substances
LinkOut - more resources
Full Text Sources
Other Literature Sources
Molecular Biology Databases
Research Materials
