Human intrahepatic CD69 + CD8+ T cells have a tissue resident memory T cell phenotype with reduced cytolytic capacity - PubMed (original) (raw)
Human intrahepatic CD69 + CD8+ T cells have a tissue resident memory T cell phenotype with reduced cytolytic capacity
Femke Stelma et al. Sci Rep. 2017.
Abstract
Tissue resident memory T cells (TRM) have been identified in various tissues, however human liver TRM to date remain unidentified. TRM can be recognized by CD69 and/or CD103 expression and may play a role in the pathology of chronic hepatitis B (CHB) and hepatitis C virus infection (CHC). Liver and paired blood mononuclear cells from 17 patients (including 4 CHB and 6 CHC patients) were isolated and CD8+ T cells were comprehensively analysed by flowcytometry, immunohistochemistry and qPCR. The majority of intrahepatic CD8+ T cells expressed CD69, a marker used to identify TRM, of which a subset co-expressed CD103. CD69 + CD8+ T cells expressed low levels of S1PR1 and KLF2 and a large proportion (>90%) was CXCR6+, resembling liver TRM in mice and liver resident NK cells in human. Cytotoxic proteins were only expressed in a small fraction of liver CD69 + CD8+ T cells in patients without viral hepatitis, however, in livers from CHB patients more CD69 + CD8+ T cells were granzyme B+. In CHC patients, less intrahepatic CD69 + CD8+ T cells were Hobit+ as compared to CHB and control patients. Intrahepatic CD69 + CD8+ T cells likely TRM which have a reduced cytolytic potential. In patients with chronic viral hepatitis TRM have a distinct phenotype.
Conflict of interest statement
Hendrik W. Reesink serves as a consultant for AbbVie, Alnylam, Bristol Myers Squibb, Gilead Sciences, Janssen-Cilag, Merck, PRA International, Regulus, Replicor, Roche and R-Pharm and received grant/research support from AbbVie, Bristol Myers Squibb, Boehringer Ingelheim, Gilead Sciences, Janssen-Cilag, Merck, PRA International, Regulus, Replicor and Roche. All other authors: None declared.
Figures
Figure 1
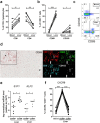
(a) Frequency of CD8+ and CD4+ T cells as a percentage of total CD3+ lymphocytes was compared in control blood and liver (n = 7). Statistical analyses; paired t-test. (b) Frequency of CD69+ and CD103+ as a percentage of total CD8+ T cells in blood and liver. Statistical analyses; paired t-test. (c) Representative flow cytometry plots showing CD69 and CD103 expression, gated on CD8 + CD3+ positive lymphocytes. (d) Paraffin embedded formalin-fixed sections of control livers (n = 3)(tumor-free tissue was used) were stained using sequential immunohistochemistry. An immunohistochemical staining of CD69 is shown with a portal field (*) and a central vein (#), and a portal field with co-localization of CD69 + CD8 + CD3+ lymphocytes (filled arrow) and CD69 + CD103 + CD8 + CD3 + lymphocytes (open arrow). Original magnification: 20x. (e) Relative expression of S1PR1 and transcription factor KLF2 in sorted CD69 + and CD69-CD8+ T cells from the liver (n = 6). Bars indicate median. Statistical analyses; Wilcoxon signed rank test. (f) Frequency of CXCR6+ T cells as a percentage of total CD8+ T cells in blood, liver CD69+ and liver CD69-CD8+ T cells. Statistical analyses; paired t-test. *p < 0.05, **p < 0.01, ***p < 0.001, ****p < 0.0001.
Figure 2
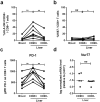
Frequency of HLA-DR + CD38+ double positive (a) and Ki67 (b) positive cells as a percentage of CD8+ T cells and gMFI of PD-1 (c) in control blood vs. liver (CD69+ and CD69-) CD8+ T cells. Statistical analyses; paired t-test. **p < 0.01. (d) Relative expression of Nur77 in sorted CD69+ and CD69-CD8+ T cells from the liver (n = 6, one CD69+ sample was unavailable). Bars indicate median. Statistical analyses; Wilcoxon signed rank test. Abbreviations: ns, non-significant.
Figure 3
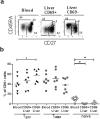
(a) Representative flow cytometry plots showing CD27 and CD45RA expression with gates indicating effector memory (TEFF, CD45RA ± CD27−), memory (TMEM, CD45RA-CD27+) and naïve (CD45RA + CD27 + ) CD8+ T cells in control blood and liver (CD69+ and CD69−). (b) Frequency of TEFF, TMEM and naïve CD8+ T cells as a percentage of total CD8+ T lymphocytes in control blood and liver (CD69+ and CD69−). Bars indicate mean. Statistical analyses; paired t-test *p < 0.05, **p < 0.01, ****p < 0.0001. Abbreviations: ns, non-significant.
Figure 4
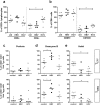
Frequency of perforin+, granzyme B+, Tbethi, Hobit+ and Eomes+ cells as a percentage of CD8+ TEFF (a) and TMEM (b) in control blood and liver (CD69+ and CD69−). Statistical analyses; paired t-test. (c) Representative FACS staining and gating for perforin, granzyme B, Eomes and T-bet in blood and liver CD69 + ad CD69- TEFF and TMEM cells. Statistical analyses; paired t-test. (d) Relative expression of cytokines interferon-γ (IFNγ), tumor necrosis factor-α (TNFα) and macrophage inflammatory protein 1β (MIP-1β) in sorted CD69+ and CD69-CD8+ T cells from control livers. Bars indicate median. Statistical analyses; Wilcoxon signed rank test. *p < 0.05, **p < 0.01, ***p < 0.001 ****p < 0.0001. Abbreviations: ns, non-significant.
Figure 5
(a) Frequency of CD8+ and CD4+ T cells as a percentage of total CD3+ T lymphocytes in control (ctrl, n = 7), CHB infected (HBV, n = 3–4) and CHC infected (HCV, n = 5–6) livers (number of samples depending on sample availability). Bars indicate median. Statistical analyses; Mann-whitney test. (b) Frequency of CD69+ and CD103+ as a percentage of total CD8+ T lymphocytes in control, HBV and HCV livers. Bars indicate median. Statistical analyses; Mann-whitney test. Frequency of perforin+ (c), granzyme B+ (d) and Hobit+ (e) CD8+ T cells as a percentage of intrahepatic CD69 + CD8+ TEFF (upper graphs) and TMEM (lower graphs). Bars indicate median. Statistical analyses; Mann-whitney test. *p < 0.05, **p < 0.01.
Similar articles
- Functions of human liver CD69+CD103-CD8+ T cells depend on HIF-2α activity in healthy and pathologic livers.
Kim JH, Han JW, Choi YJ, Rha MS, Koh JY, Kim KH, Kim CG, Lee YJ, Kim AR, Park J, Kim HK, Min BS, Seo SI, Kang M, Park HJ, Han DH, Kim SI, Kim MS, Lee JG, Lee DH, Kim W, Park JY, Park SH, Joo DJ, Shin EC. Kim JH, et al. J Hepatol. 2020 Jun;72(6):1170-1181. doi: 10.1016/j.jhep.2020.01.010. Epub 2020 Jan 24. J Hepatol. 2020. PMID: 31987989 - IRG1/Itaconate inhibits proliferation and promotes apoptosis of CD69+CD103+CD8+ tissue-resident memory T cells in autoimmune hepatitis by regulating the JAK3/STAT3/P53 signalling pathway.
Zhou P, Tao K, Zeng L, Zeng X, Wan Y, Xie G, Liu X, Zhang P. Zhou P, et al. Apoptosis. 2024 Oct;29(9-10):1738-1756. doi: 10.1007/s10495-024-01970-5. Epub 2024 Apr 19. Apoptosis. 2024. PMID: 38641760 - The Clinical Significance of Hepatic CD69+ CD103+ CD8+ Resident-Memory T Cells in Autoimmune Hepatitis.
You Z, Li Y, Wang Q, Zhao Z, Li Y, Qian Q, Li B, Zhang J, Huang B, Liang J, Chen R, Lyu Z, Chen Y, Lian M, Xiao X, Miao Q, Fang J, Lian Z, Eric Gershwin M, Tang R, Ma X. You Z, et al. Hepatology. 2021 Aug;74(2):847-863. doi: 10.1002/hep.31739. Epub 2021 Jun 22. Hepatology. 2021. PMID: 33554350 - The Emerging Role of CD8+ Tissue Resident Memory T (TRM) Cells in Antitumor Immunity: A Unique Functional Contribution of the CD103 Integrin.
Corgnac S, Boutet M, Kfoury M, Naltet C, Mami-Chouaib F. Corgnac S, et al. Front Immunol. 2018 Aug 15;9:1904. doi: 10.3389/fimmu.2018.01904. eCollection 2018. Front Immunol. 2018. PMID: 30158938 Free PMC article. Review. - TGF-β: Many Paths to CD103+ CD8 T Cell Residency.
Qiu Z, Chu TH, Sheridan BS. Qiu Z, et al. Cells. 2021 Apr 23;10(5):989. doi: 10.3390/cells10050989. Cells. 2021. PMID: 33922441 Free PMC article. Review.
Cited by
- Tissue adaptation of CD4 T lymphocytes in homeostasis and cancer.
Pereira MVA, Galvani RG, Gonçalves-Silva T, de Vasconcelo ZFM, Bonomo A. Pereira MVA, et al. Front Immunol. 2024 Apr 16;15:1379376. doi: 10.3389/fimmu.2024.1379376. eCollection 2024. Front Immunol. 2024. PMID: 38690280 Free PMC article. - Tissue-resident memory T cells populate the human brain.
Smolders J, Heutinck KM, Fransen NL, Remmerswaal EBM, Hombrink P, Ten Berge IJM, van Lier RAW, Huitinga I, Hamann J. Smolders J, et al. Nat Commun. 2018 Nov 2;9(1):4593. doi: 10.1038/s41467-018-07053-9. Nat Commun. 2018. PMID: 30389931 Free PMC article. - Tissue Trafficking Kinetics of Rhesus Macaque Natural Killer Cells Measured by Serial Intravascular Staining.
Mortlock RD, Wu C, Potter EL, Abraham DM, Allan DSJ, Hong SG, Roederer M, Dunbar CE. Mortlock RD, et al. Front Immunol. 2022 Jan 11;12:772332. doi: 10.3389/fimmu.2021.772332. eCollection 2021. Front Immunol. 2022. PMID: 35095846 Free PMC article. - Tissue-Resident Lymphocytes: Implications in Immunotherapy for Hepatocellular Carcinoma.
Han JW, Yoon SK. Han JW, et al. Int J Mol Sci. 2020 Dec 28;22(1):232. doi: 10.3390/ijms22010232. Int J Mol Sci. 2020. PMID: 33379384 Free PMC article. Review. - Non-human Primate Determinants of Natural Killer Cells in Tissues at Steady-State and During Simian Immunodeficiency Virus Infection.
Huot N, Rascle P, Petitdemange C, Contreras V, Palgen JL, Stahl-Hennig C, Le Grand R, Beignon AS, Jacquelin B, Müller-Trutwin M. Huot N, et al. Front Immunol. 2020 Sep 10;11:2134. doi: 10.3389/fimmu.2020.02134. eCollection 2020. Front Immunol. 2020. PMID: 33013901 Free PMC article.
References
Publication types
MeSH terms
Substances
LinkOut - more resources
Full Text Sources
Other Literature Sources
Research Materials


