Defining a Cancer Dependency Map - PubMed (original) (raw)
. 2017 Jul 27;170(3):564-576.e16.
doi: 10.1016/j.cell.2017.06.010.
Francisca Vazquez 2, Phil G Montgomery 1, Barbara A Weir 2, Gregory Kryukov 2, Glenn S Cowley 1, Stanley Gill 2, William F Harrington 1, Sasha Pantel 1, John M Krill-Burger 1, Robin M Meyers 1, Levi Ali 1, Amy Goodale 1, Yenarae Lee 1, Guozhi Jiang 1, Jessica Hsiao 1, William F J Gerath 1, Sara Howell 1, Erin Merkel 1, Mahmoud Ghandi 1, Levi A Garraway 3, David E Root 1, Todd R Golub 4, Jesse S Boehm 1, William C Hahn 5
Affiliations
- PMID: 28753430
- PMCID: PMC5667678
- DOI: 10.1016/j.cell.2017.06.010
Defining a Cancer Dependency Map
Aviad Tsherniak et al. Cell. 2017.
Abstract
Most human epithelial tumors harbor numerous alterations, making it difficult to predict which genes are required for tumor survival. To systematically identify cancer dependencies, we analyzed 501 genome-scale loss-of-function screens performed in diverse human cancer cell lines. We developed DEMETER, an analytical framework that segregates on- from off-target effects of RNAi. 769 genes were differentially required in subsets of these cell lines at a threshold of six SDs from the mean. We found predictive models for 426 dependencies (55%) by nonlinear regression modeling considering 66,646 molecular features. Many dependencies fall into a limited number of classes, and unexpectedly, in 82% of models, the top biomarkers were expression based. We demonstrated the basis behind one such predictive model linking hypermethylation of the UBB ubiquitin gene to a dependency on UBC. Together, these observations provide a foundation for a cancer dependency map that facilitates the prioritization of therapeutic targets.
Keywords: RNAi screens; cancer dependencies; cancer targets; genetic vulnerabilities; genomic biomarkers; precision medicine; predictive modeling; seed effects; shRNA.
Copyright © 2017 Elsevier Inc. All rights reserved.
Figures
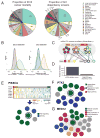
Figure 1. Computational segregation of on- and off-target effects of RNAi
(A) Tumor types by their contribution to cancer mortality (left) and their cancer cell line representation in the reported dataset (right). (B) Distributions of Pearson correlation coefficients for pairs of shRNA viability profiles before (left) and after (right) removal of inferred seed effects and selection of effective shRNAs (n > 12,000) by DEMETER. Pairs of shRNAs selected randomly (blue lines), targeting the same gene (orange) and sharing a seed sequence (green). (C) Schematic representation of DEMETER and its computational model. Gene- and seed-related effects are estimated from shRNA depletion data. The color of inner circles represents the shRNA target gene and the color of outer circles represents the shRNAs seed sequence. (D) For the top 0.1% most depleted shRNA readouts and the top 0.1% DEMETER gene dependency scores across the whole dataset, the fraction of data points corresponding to a cell line not expressing the target gene. (E) A heatmap depicts the dependency scores (rows) across 501 screened lines (columns) for PIK3CA and the 7 genes that have significantly correlated dependency profiles (z-score > 3). These data were used to plot a gene network, with each edge representing a significant correlation between a pair of dependency profiles. Genes are colored by functional classes. The same analysis was used to generate gene networks for PTK2 (F) and MED12 (G).
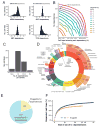
Figure 2. The landscape of genetic dependencies in 501 cancer cell lines
(A) Histograms of gene dependency scores for the indicated genes for all cell lines (x-axis). (B) For each differential dependency strength (line color), and for each number of cell lines (xaxis), the number of genes that are differential dependencies is shown (y-axis). (C) Distribution of the number of 6σ dependencies per cell line. (D) Distribution of 6σ dependencies by protein classes. (E) The number of 6σ dependencies annotated as druggable by either being included in DGIdb or IUPHAR/BPS Guide to Pharmacology. (F) The fraction of cell lines (y-axis) that have a 6σ differential dependency on at least one gene in a set of a given size (x-axis). Blue line – considering all 6σ dependencies; orange line – considering only druggable ones.
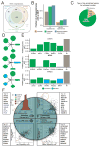
Figure 3. Prediction of differential dependencies using molecular markers
(A) The number of 6σ dependencies with predictive models built using all features (Unbiased, blue), features of genes related to the dependency gene (Related, red) and those falling into one of the four identified dependency classes (green). (B) Cumulative fraction of 6σ and non-6σ dependencies with predictive models (y-axis) using all features (red bars), plus related features (green), plus those in the four dependency classes (blue). (C) The proportion of the top predictive feature type (copy number, orange; expression, green; mutation, blue) in all unbiased models of 6σ dependencies (D) Top five features of predictive models for 3 gene dependencies in white circles. Circle size is proportional to the relative importance of each feature to the model’s predictive power. (E) Predictive accuracy of ATLANTIS models using only single features (black and colored bars) and using all features (gray bars). (F) Four classes of MDPs, each with a representative example and the top 10 predictable dependencies. Red dotted circles highlight the most dependent cell lines. (Top left) A histogram of GNAI2 dependency scores (x-axis). The two cell lines most dependent on GNAI2 harbor the same indel mutation. (Top right) POU2F2 dependency scores (x-axis) and expression levels (y-axis). Cell lines over-expressing POU2F2 are the most dependent lines. (Bottom left) RPL17 dependency (x-axis) and copy number (y-axis) illustrating a CYCLOPS dependency. (Bottom right) FERMT1 dependency (x-axis) and FERMT2 expression levels (y-axis) for cell lines with low expression of FERMT3 (log2RPKM < 3). Cell lines most dependent on FERMT1 do not express FERMT2.
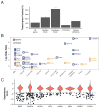
Figure 4. Oncogene and expression addiction MDPs are enriched in lineage-specific transcription factors
(A) Percentage of transcription factors (TF) among all genes and the four dependency classes. * - P-value < 0.05, *** - P-value < 10−15, Fisher’s exact test. (B) Lineage enrichment (odds ratio; y-axis) of mutation- and expression-driven TF dependencies (N=50) for lineages (x-axis) with significant enrichment (Fisher’s exact FDR < 0.05) in a single (blue) or multiple (orange) lineages. (C) Distributions of 6σ TF dependencies overrepresented in non-essential lineages (ovary, breast, prostate, multiple myeloma and melanoma) compared to known mutation-driven dependencies (BRAF, PIK3CA); dots depict dependency scores greater than 4σ.
Figure 5. UBB/UBC as a paralog deficiency MDP in ovarian cancer cell lines
(A) UBC dependency scores (x-axis) versus UBB expression levels (y-axis). UBB expression (y-axis) versus promoter methylation (x-axis; Fraction) in (B) ovarian cell lines (CCLE data) and (C) tumors (TCGA data). (D) GFP viability competition assay in UBBlow and UBBhigh ovarian cell lines using 4 shRNAs targeting UBC. Log2 fold change of shUBC expressing cells relative to negative controls is shown. (E) Time course of relative viability upon UBC suppression with or without ectopic expression of monoubiquitin (UBB) in a UBBlow cell line (SNU8). Data represent fold change relative to day 1 normalized to pLKO_TRC005-nullT. Error bars represent SD. (F) Levels of conjugated ubiquitin upon UBC suppression in UBBlow (SNU8) and UBBhigh (TOV112D) cell lines.
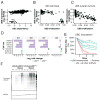
Figure 6. Effects of scale on the completeness of a Cancer Dependency Map
(A) For each differential dependency with a significant predictive model, the predictive power of the best model (y-axis) and its MDP class (color) along with the strength of the dependency in the most dependent cell line (x-axis). (B) Discovery status of a curated set of 39 mutation- and expression-related dependencies in the dataset. We computed the correlations of each marker with all the differential dependencies and categorized them as (1) Discovered, (2) Not concordant (3) Insufficient context or (4) No differential dependency (see Methods). (C) Fraction of predictable 6σ dependencies, summarized by the number of 6σ dependent cell lines. (D) Results of a down-sampling analysis showing the number of 6σ differential dependencies identified (y-axis) in randomly-sampled subsets of the screened cell lines (x-axis). The blue, orange, green and red lines correspond to dependencies observed in at least 1, 5, 10 or 20 cell lines, respectively.
Similar articles
- Seed-effect modeling improves the consistency of genome-wide loss-of-function screens and identifies synthetic lethal vulnerabilities in cancer cells.
Jaiswal A, Peddinti G, Akimov Y, Wennerberg K, Kuznetsov S, Tang J, Aittokallio T. Jaiswal A, et al. Genome Med. 2017 Jun 1;9(1):51. doi: 10.1186/s13073-017-0440-2. Genome Med. 2017. PMID: 28569207 Free PMC article. - Improved estimation of cancer dependencies from large-scale RNAi screens using model-based normalization and data integration.
McFarland JM, Ho ZV, Kugener G, Dempster JM, Montgomery PG, Bryan JG, Krill-Burger JM, Green TM, Vazquez F, Boehm JS, Golub TR, Hahn WC, Root DE, Tsherniak A. McFarland JM, et al. Nat Commun. 2018 Nov 2;9(1):4610. doi: 10.1038/s41467-018-06916-5. Nat Commun. 2018. PMID: 30389920 Free PMC article. - Partial gene suppression improves identification of cancer vulnerabilities when CRISPR-Cas9 knockout is pan-lethal.
Krill-Burger JM, Dempster JM, Borah AA, Paolella BR, Root DE, Golub TR, Boehm JS, Hahn WC, McFarland JM, Vazquez F, Tsherniak A. Krill-Burger JM, et al. Genome Biol. 2023 Aug 23;24(1):192. doi: 10.1186/s13059-023-03020-w. Genome Biol. 2023. PMID: 37612728 Free PMC article. - From cell lines to living biosensors: new opportunities to prioritize cancer dependencies using ex vivo tumor cultures.
Tseng YY, Boehm JS. Tseng YY, et al. Curr Opin Genet Dev. 2019 Feb;54:33-40. doi: 10.1016/j.gde.2019.02.007. Epub 2019 Mar 28. Curr Opin Genet Dev. 2019. PMID: 30928774 Review. - Use of RNAi screens to uncover resistance mechanisms in cancer cells and identify synthetic lethal interactions.
Diehl P, Tedesco D, Chenchik A. Diehl P, et al. Drug Discov Today Technol. 2014 Mar;11:11-8. doi: 10.1016/j.ddtec.2013.12.002. Drug Discov Today Technol. 2014. PMID: 24847648 Free PMC article. Review.
Cited by
- Cancer cell histone density links global histone acetylation, mitochondrial proteome and histone acetylase inhibitor sensitivity.
Bruhn C, Bastianello G, Foiani M. Bruhn C, et al. Commun Biol. 2022 Aug 27;5(1):882. doi: 10.1038/s42003-022-03846-3. Commun Biol. 2022. PMID: 36030322 Free PMC article. - Discovering the anti-cancer potential of non-oncology drugs by systematic viability profiling.
Corsello SM, Nagari RT, Spangler RD, Rossen J, Kocak M, Bryan JG, Humeidi R, Peck D, Wu X, Tang AA, Wang VM, Bender SA, Lemire E, Narayan R, Montgomery P, Ben-David U, Garvie CW, Chen Y, Rees MG, Lyons NJ, McFarland JM, Wong BT, Wang L, Dumont N, O'Hearn PJ, Stefan E, Doench JG, Harrington CN, Greulich H, Meyerson M, Vazquez F, Subramanian A, Roth JA, Bittker JA, Boehm JS, Mader CC, Tsherniak A, Golub TR. Corsello SM, et al. Nat Cancer. 2020 Feb;1(2):235-248. doi: 10.1038/s43018-019-0018-6. Epub 2020 Jan 20. Nat Cancer. 2020. PMID: 32613204 Free PMC article. - Optimal methods for analyzing targeted pairwise knockout screens.
Chou J, Anvar NE, Elghaish R, Chen J, Hart T. Chou J, et al. bioRxiv [Preprint]. 2024 Aug 20:2024.08.19.608665. doi: 10.1101/2024.08.19.608665. bioRxiv. 2024. PMID: 39229040 Free PMC article. Preprint. - A functional analysis of 180 cancer cell lines reveals conserved intrinsic metabolic programs.
Cherkaoui S, Durot S, Bradley J, Critchlow S, Dubuis S, Masiero MM, Wegmann R, Snijder B, Othman A, Bendtsen C, Zamboni N. Cherkaoui S, et al. Mol Syst Biol. 2022 Nov;18(11):e11033. doi: 10.15252/msb.202211033. Mol Syst Biol. 2022. PMID: 36321552 Free PMC article. - Current status and future outlook for patient-derived cancer models from a rare cancer research perspective.
Kondo T. Kondo T. Cancer Sci. 2021 Mar;112(3):953-961. doi: 10.1111/cas.14669. Epub 2021 Feb 6. Cancer Sci. 2021. PMID: 32986888 Free PMC article. Review.
References
MeSH terms
Substances
Grants and funding
- P01 CA203655/CA/NCI NIH HHS/United States
- U01 CA199253/CA/NCI NIH HHS/United States
- R01 CA130988/CA/NCI NIH HHS/United States
- U01 CA176058/CA/NCI NIH HHS/United States
- U54 CA112962/CA/NCI NIH HHS/United States
LinkOut - more resources
Full Text Sources
Other Literature Sources
Research Materials
Miscellaneous
