Enhancer Reprogramming Promotes Pancreatic Cancer Metastasis - PubMed (original) (raw)
. 2017 Aug 24;170(5):875-888.e20.
doi: 10.1016/j.cell.2017.07.007. Epub 2017 Jul 27.
Chang-Il Hwang 2, Tim D D Somerville 1, Joseph P Milazzo 1, Eun Jung Lee 2, Brandon Da Silva 2, Laura Maiorino 1, Hervé Tiriac 2, C Megan Young 2, Koji Miyabayashi 2, Dea Filippini 2, Brianna Creighton 2, Richard A Burkhart 3, Jonathan M Buscaglia 4, Edward J Kim 5, Jean L Grem 6, Audrey J Lazenby 7, James A Grunkemeyer 8, Michael A Hollingsworth 8, Paul M Grandgenett 8, Mikala Egeblad 1, Youngkyu Park 2, David A Tuveson 9, Christopher R Vakoc 10
Affiliations
- PMID: 28757253
- PMCID: PMC5726277
- DOI: 10.1016/j.cell.2017.07.007
Enhancer Reprogramming Promotes Pancreatic Cancer Metastasis
Jae-Seok Roe et al. Cell. 2017.
Abstract
Pancreatic ductal adenocarcinoma (PDA) is one of the most lethal human malignancies, owing in part to its propensity for metastasis. Here, we used an organoid culture system to investigate how transcription and the enhancer landscape become altered during discrete stages of disease progression in a PDA mouse model. This approach revealed that the metastatic transition is accompanied by massive and recurrent alterations in enhancer activity. We implicate the pioneer factor FOXA1 as a driver of enhancer activation in this system, a mechanism that renders PDA cells more invasive and less anchorage-dependent for growth in vitro, as well as more metastatic in vivo. In this context, FOXA1-dependent enhancer reprogramming activates a transcriptional program of embryonic foregut endoderm. Collectively, our study implicates enhancer reprogramming, FOXA1 upregulation, and a retrograde developmental transition in PDA metastasis.
Keywords: FOXA1; enhancer; metastasis; organoid; pancreatic cancer; pancreatic ductal adenocarcinoma.
Copyright © 2017 Elsevier Inc. All rights reserved.
Figures
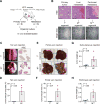
Figure 1. Paired Tumor- and Metastasis-derived Organoids Provide a Model to Study Mechanisms of PDA Progression
(A) Schematic diagram demonstrating establishment of paired primary tumor- and metastasis-derived organoid cultures from the KPC mouse model of pancreatic cancer. (B) Hematoxylin and eosin (H&E) staining of murine primary tumor and metastases derived from KPC mice (top) and bright field images of established organoids (bottom). Scale bars, 100 μm (top) and 1 mm (bottom). (C and D) Representative bright field images (C, left) and H&E staining (C, right) of lung and quantification (D) 2 months after tail vein injection of T3 and M1L organoids (5 × 10⁵ cells per each injection, n = 4) in C57Bl/6J mice. Scale bars, 5 mm. (E and F) Representative bright field images (E) and quantification (F) one month after portal vein injection of T3 and M1L organoids (5 × 10⁵ cells per each injection, n = 4) in C57Bl/6J mice. (G) Quantification of subcutaneous tumors 6 weeks after injection of T3 and M1L organoids (5 × 10⁵ cells per each injection, n = 5) in C57Bl/6J mice. (H) Quantification of tumor weight 4 weeks after peritoneal wall injection of T23 and M10P organoids (5 × 10⁵ cells per each injection, n = 4) in C57Bl/6J mice. For bar charts, each dot represents a mouse and the mean +/- SEM is shown. _p_-value was determined by Student’s t-test. See also Figure S1.
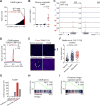
Figure 2. Massive enhancer reprogramming accompanies the metastatic transition
(A) Distribution of gained H3K27ac peaks across the indicated P, T and M organoids. From a total of 34,852 H3K27ac ChIP-seq peaks, gained H3K27ac peaks are defined by more than 10-fold increase of H3K27ac signal relative to the average of N5 and N6 (Navg). Bottom brackets indicate the pairs of matching T and M organoids. (B) Heatmap representation of GAIN regions based on H3K27ac occupancy in organoids. The 857 GAIN regions were identified from the union of all gained H3K27ac peaks described in Figure 2A. 10-Kb around the center of GAIN regions are displayed for each organoid. Each row represents a single region (n = 857). Each column represents an individual organoid (n = 16). (C) Representative H3K27ac ChIP-seq profiles of GAIN regions at Lbh and Acan loci in N, P, T and M organoids. (D) Heatmap representation of unsupervised hierarchical clustering based on H3K27ac occupancy at total H3K27ac ChIP-seq peaks. Samples were clustered based on Spearman correlation coefficient with average linkage. (E) Pie chart showing the genomic annotations of 857 GAIN regions according to the location of a given peak. TSS, ‘−1-kb to +100-bp’ of transcription start sites. TTS, ‘−100-bp to +1-Kb’ of transcription termination sites. UTR includes both 5′ and 3′ UTRs. (F) Metagene representation of the mean ChIP-seq signal for the indicated histone marks (left and middle) or the mean ATAC-seq signal (right) across GAIN regions in the indicated organoids. Metagenes are centered on the middle of GAIN regions and 10-Kb around the center of GAIN regions are displayed. To compare relative signal changes (denoted as value-x), the mean signal of each biological replicate was determined by averaging signals of 2-Kb (H3K27ac or H3K4me1 ChIP-seq) or 1-Kb (ATAC-seq) around the center of GAIN regions. _p_-value was determined by Kolmogorov–Smirnov test. See also Figure S2 and Table S1 and S2.
Figure 3. Elevated FOXA1 Expression and Occupancy is Associated with PDA Metastasis and GAIN Enhancer Activation
(A) Representation of motifs enriched at GAIN regions. Mouse promoters were used as the comparison library. _p_-values correspond to the corrected p in the output. AP1 motif is ranked first; SOX motif is ranked second; FOXD1 and FOXA2 motifs are ranked third and fourth, respectively. Position weight matrices for FOXD1 and FOXA2 are represented as Forkhead motifs. (B) RNA-seq based Foxa1 mRNA expression in organoids. Each dot represents an independent organoid culture and the mean +/− SEM is shown. _p_-value was determined by Student’s t-test. N, normal; P, PanIN; T, primary tumor; M, metastasis; rpkm, reads per kilobase per million mapped reads. (C) Representative FOXA1 ChIP-seq profiles of GAIN regions at Lbh and Acan loci in the indicated organoids. (D) Metagene representation of the mean FOXA1 ChIP-seq signal across GAIN regions in the indicated organoids. The mean signal of each biological replicate was determined by averaging signals of 1-Kb around the center of the indicated regions. _p_-value was determined by Kolmogorov–Smirnov test. (E) RNA fluorescence in situ hybridization (RNA-FISH) of the indicated tissue sections including diaphragm metastasis from KPC mice using a _Foxa1_-specific probe (red). Two independent KPC primary tumor and metastatic lesions were examined. White arrows indicate areas of focal Foxa1 mRNA expression in primary PDA tumors. Counterstain, DAPI (blue). Scale bars, 100 μm. (F) Microarray based FOXA1 mRNA expression in publicly available PDA patient data. Each dot represents individual patient. The mean +/− SEM is shown. _p_-values were determined by Student’s t-test. (G) FOXA1 expression during pancreatic differentiation of human embryonic stem cells (hES) relative to foregut stage. (H) Gene set enrichment analysis (GSEA) of posterior foregut versus hES RNA-seq using a signature of GAIN genes. Normalized enrichment score (NES) and nominal _p_-value (p) were provided according to GSEA. (I) GSEA of averaged six M (Mavg) versus averaged six T (Tavg) RNA-seq using posterior foregut signature genes. See also Figure S3 and Table S3.
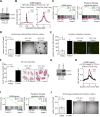
Figure 4. FOXA1 Promotes Enhancer activation and Metastatic Capabilities in 2D PDA Cell Lines
(A) Western blot analysis with the indicated antibodies and whole cell lysates prepared from KPC-2D cells stably expressing FOXA1 cDNA (KPC-2D/FOXA1) or control (KPC-2D/empty). (B) Metagene representation of the mean FOXA1 (left) or H3K27ac (right) ChIP-seq signal across GAIN regions in the indicated organoids. The mean signal of each biological replicate was determined by averaging signals of 1-Kb (FOXA1) or 2-Kb (H3K27ac) around the center of the indicated regions. _p_-value was determined by Kolmogorov–Smirnov test. (C) GSEA of averaged KPC-2D/FOXA1 (FOXA1avg) versus averaged KPC-2D/empty (emptyavg) RNA-seq using GAIN genes (left), and posterior foregut signature genes (right). (D) Anchorage-independent sphere formation assay of KPC-2D/empty and KPC-2D/FOXA1 cells (n = 4). Bright field images were taken from 4x field after 2 weeks of culture and the size of spheres were measured for quantification. The mean +/− SEM is shown and _p_-value was determined by Student’s t-test. Scale bars, 500 μm. (E) Boyden-chamber invasion assay of KPC-2D/empty and KPC-2D/FOXA1 cells (n = 4). Invaded cells were stained with Syto13 (GFP) 24 hours after cell seeding. Fluorescent microscopic images were taken from 4× field (right) to quantify the number of invaded cells (left). The mean +/− SEM is shown and _p_-value was determined by Student’s t-test. Scale bars, 500 μm. (F) Tail vein injection of KPC-2D/empty and KPC-2D/FOXA1 cells (2.5 × 10⁵ cells) into C57Bl/6J mice to assess lung colonization at 4 weeks post-injection. Representative images of H&E staining are shown (right). Percent tumor area per lung lobe (%) was determined by dividing the whole surface area of the largest lung lobe with lung tumor area of the given lobe. The mean +/− SEM is shown and _p_-value was determined by Student’s t-test (n = 15). Scale bars, 5 mm. (G) Western blot analysis with the indicated antibodies and whole cell lysates prepared from hT2-2D cells stably expressing FOXA1 cDNA (hT2-2D/FOXA1) or control (hT2-2D/empty). (H) Metagene representation of H3K27ac ChIP-seq signal across GAIN regions in hT2-2D cells. The mean signal of each biological replicate was determined by averaging signals of 2-Kb H3K27ac around the center of the indicated regions. _p_-value was determined by Kolmogorov– Smirnov test. (I) GSEA of hT2-2D/FOXA1 versus hT2-2D/empty using a signature of GAIN genes (left) and posterior foregut signature genes (right). Normalized enrichment score (NES) and nominal _p_-value (p) were provided according to GSEA. (J) Anchorage-independent sphere formation assay of hT2-2D/empty and hT2-2D/FOXA1 cells (n = 3). Bright field images were taken from 4x field after 2 weeks of culture and the size of spheres were measured for quantification. The mean +/− SEM is shown and _p_-value was determined by Student’s t-test. Scale bars, 500 μm. See also Figure S4 and Table S4–S5.
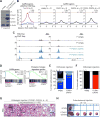
Figure 5. FOXA1 Cooperates with GATA5 to Activate GAIN Enhancers and Promote PDA Progression in vivo
(A) Western blot analysis of T3/empty or T3/FOXA1-GATA5 organoids with the indicated antibodies. (B) Metagene representation of the mean H3K27ac ChIP-seq signal across GAIN regions in the indicated organoids. Mean H3K27ac signal of two parental T organoids (T3 and T23) and their matched M organoids (M1L and M10P) are displayed (left). T3 and T23 organoids stably expressing control, FOXA1, GATA5 or FOXA1-GATA5 construct were subjected to H3K27ac ChIP-seq to compare with parental T (blue dotted line) or matched M (red dotted line) organoids. Parental T organoids were compared with matched M organoids, and T/FOXA1 or T/FOXA1-GATA5 organoids were compared with T/empty organoids. The mean signal of each biological replicate was determined by averaging signals of 2-Kb around the center of the indicated regions. _p_-value was determined by Kolmogorov–Smirnov test. (C) Representative H3K27ac ChIP-seq profiles of GAIN regions at Lbh and Acan loci in the indicated organoids. (D) GSEA of averaged T/FOXA1-GATA5 (FOXA1-GATA5avg) versus averaged T/empty (emptyavg) RNA-seq using GAIN genes (left) or posterior foregut signature genes (right). (E-F) Quantification of the number of mice with primary tumors at injection site (pancreas, E) and metastases (F) after orthotopic injection of T3/empty or T3/FOXA1-GATA5 organoids in athymic nu/nu mice (n = 5). 5 × 10⁵ cells were orthotopically injected and mice were sacrificed at 12 weeks post-injection. Frequency of PDA and microinvasive PDA development in orthotopic injection is 40% (n = 2/5) and 20% (n = 1/5), respectively for T3/empty and 80% (n = 4/5) and 20% (n = 1/5), respectively for T3/FOXA1-GATA5. (G) H&E staining of lung micrometastases (n = 4/5, arrows) upon orthotopic injection of T3/FOXA1-GATA5 organoids. Scale bars, 200 μm. (H) Tumor development after subcutaneous injection of T3/empty and T3/FOXA1-GATA5 organoids. 5 × 10⁵ of cells were subcutaneously injected into C57Bl/6J mice and mice were sacrificed at 11 weeks post-injection. Note, four of T3/empty-injected mice (n = 5) did not show apparent subcutaneous tumor formation in a syngeneic background. See also Figure S5 and Table S4–S5.
Figure 6. Suppression of FOXA1 Deactivates GAIN Enhancers and Diminishes the Aggressiveness of Metastasis-derived PDA Organoids
(A) Western blotting of M1L organoids stably expressing shRen (M1L/shRen) or sh_Foxa1_.2959 construct (M1L/sh_Foxa1_) with the indicated antibodies. (B) Representative H3K27ac ChIP-seq profiles of GAIN regions at Lbh and Acan loci in the indicated organoids. (C) Metagene representation of the mean FOXA1 (left) or H3K27ac (right) ChIP-seq signal across GAIN regions in the indicated organoids. The mean signal of each biological replicate was determined by averaging signals of 1-Kb (FOXA1) or 2-Kb (H3K27ac) around the center of the indicated regions. p_-value was determined by Kolmogorov–Smirnov test. (D) GSEA of M1L/sh_Foxa1 versus M1L/shRen using GAIN genes (left) or posterior foregut signature genes (right). (E) Quantification of primary tumor weight from injection site (pancreas) after orthotopic injection of M/shRen or M/sh_Foxa1_ organoids in athymic nu/nu mice (n = 10). 5 × 10⁵ cells were orthotopically injected and mice were sacrificed at 6 weeks post-injection. Each dot represents a mouse and the mean +/− SEM is shown. p_-value was determined by Student’s t-test. (F) Quantification of the number of mice bearing metastasis upon orthotopic injection of M/shRen or M/sh_Foxa1 organoids (n = 10). See also Figure S6 and Table S4–S5.
Comment in
- Reprogramming Enhancers to Drive Metastasis.
Mostoslavsky R, Bardeesy N. Mostoslavsky R, et al. Cell. 2017 Aug 24;170(5):823-825. doi: 10.1016/j.cell.2017.08.010. Cell. 2017. PMID: 28841414
Similar articles
- Aspartate β-hydroxylase promotes pancreatic ductal adenocarcinoma metastasis through activation of SRC signaling pathway.
Ogawa K, Lin Q, Li L, Bai X, Chen X, Chen H, Kong R, Wang Y, Zhu H, He F, Xu Q, Liu L, Li M, Zhang S, Nagaoka K, Carlson R, Safran H, Charpentier K, Sun B, Wands J, Dong X. Ogawa K, et al. J Hematol Oncol. 2019 Dec 30;12(1):144. doi: 10.1186/s13045-019-0837-z. J Hematol Oncol. 2019. PMID: 31888763 Free PMC article. - Cellular heterogeneity during mouse pancreatic ductal adenocarcinoma progression at single-cell resolution.
Hosein AN, Huang H, Wang Z, Parmar K, Du W, Huang J, Maitra A, Olson E, Verma U, Brekken RA. Hosein AN, et al. JCI Insight. 2019 Jul 23;5(16):e129212. doi: 10.1172/jci.insight.129212. JCI Insight. 2019. PMID: 31335328 Free PMC article. - Epigenetic Alterations in Pancreatic Cancer Metastasis.
Wang SS, Xu J, Ji KY, Hwang CI. Wang SS, et al. Biomolecules. 2021 Jul 22;11(8):1082. doi: 10.3390/biom11081082. Biomolecules. 2021. PMID: 34439749 Free PMC article. Review. - Semaphorin 3D autocrine signaling mediates the metastatic role of annexin A2 in pancreatic cancer.
Foley K, Rucki AA, Xiao Q, Zhou D, Leubner A, Mo G, Kleponis J, Wu AA, Sharma R, Jiang Q, Anders RA, Iacobuzio-Donahue CA, Hajjar KA, Maitra A, Jaffee EM, Zheng L. Foley K, et al. Sci Signal. 2015 Aug 4;8(388):ra77. doi: 10.1126/scisignal.aaa5823. Sci Signal. 2015. PMID: 26243191 Free PMC article. - Organoid models for translational pancreatic cancer research.
Tiriac H, Plenker D, Baker LA, Tuveson DA. Tiriac H, et al. Curr Opin Genet Dev. 2019 Feb;54:7-11. doi: 10.1016/j.gde.2019.02.003. Epub 2019 Mar 4. Curr Opin Genet Dev. 2019. PMID: 30844513 Free PMC article. Review.
Cited by
- The nuclear factor ID3 endows macrophages with a potent anti-tumour activity.
Deng Z, Loyher PL, Lazarov T, Li L, Shen Z, Bhinder B, Yang H, Zhong Y, Alberdi A, Massague J, Sun JC, Benezra R, Glass CK, Elemento O, Iacobuzio-Donahue CA, Geissmann F. Deng Z, et al. Nature. 2024 Feb;626(8000):864-873. doi: 10.1038/s41586-023-06950-4. Epub 2024 Feb 7. Nature. 2024. PMID: 38326607 Free PMC article. - The foundational framework of tumors: Gametogenesis, p53, and cancer.
Liu C, Moten A, Ma Z, Lin HK. Liu C, et al. Semin Cancer Biol. 2022 Jun;81:193-205. doi: 10.1016/j.semcancer.2021.04.018. Epub 2021 Apr 30. Semin Cancer Biol. 2022. PMID: 33940178 Free PMC article. Review. - Pioneer Transcription Factors Initiating Gene Network Changes.
Zaret KS. Zaret KS. Annu Rev Genet. 2020 Nov 23;54:367-385. doi: 10.1146/annurev-genet-030220-015007. Epub 2020 Sep 4. Annu Rev Genet. 2020. PMID: 32886547 Free PMC article. Review. - Reciprocal regulation of pancreatic ductal adenocarcinoma growth and molecular subtype by HNF4α and SIX1/4.
Camolotto SA, Belova VK, Torre-Healy L, Vahrenkamp JM, Berrett KC, Conway H, Shea J, Stubben C, Moffitt R, Gertz J, Snyder EL. Camolotto SA, et al. Gut. 2021 May;70(5):900-914. doi: 10.1136/gutjnl-2020-321316. Epub 2020 Aug 21. Gut. 2021. PMID: 32826305 Free PMC article. - Heterogeneity of Glycan Biomarker Clusters as an Indicator of Recurrence in Pancreatic Cancer.
Wisniewski L, Braak S, Klamer Z, Gao C, Shi C, Allen P, Haab BB. Wisniewski L, et al. bioRxiv [Preprint]. 2023 Jan 6:2023.01.05.522607. doi: 10.1101/2023.01.05.522607. bioRxiv. 2023. PMID: 36711795 Free PMC article. Updated. Preprint.
References
- Bailey P, Chang DK, Nones K, Johns AL, Patch AM, Gingras MC, Miller DK, Christ AN, Bruxner TJ, Quinn MC, et al. Genomic analyses identify molecular subtypes of pancreatic cancer. Nature. 2016;531:47–52. - PubMed
MeSH terms
Substances
Grants and funding
- P20 CA192996/CA/NCI NIH HHS/United States
- P30 CA093373/CA/NCI NIH HHS/United States
- R01 CA188134/CA/NCI NIH HHS/United States
- R01 CA190092/CA/NCI NIH HHS/United States
- R50 CA211506/CA/NCI NIH HHS/United States
- P50 CA101955/CA/NCI NIH HHS/United States
- U10 CA180944/CA/NCI NIH HHS/United States
- P30 CA045508/CA/NCI NIH HHS/United States
- P01 CA013106/CA/NCI NIH HHS/United States
- P30 DK089502/DK/NIDDK NIH HHS/United States
- P20 CA192994/CA/NCI NIH HHS/United States
- P50 CA127297/CA/NCI NIH HHS/United States
- R50 CA211462/CA/NCI NIH HHS/United States
- T32 CA126607/CA/NCI NIH HHS/United States
- U01 CA168409/CA/NCI NIH HHS/United States
- F32 CA180717/CA/NCI NIH HHS/United States
LinkOut - more resources
Full Text Sources
Other Literature Sources
Medical
Molecular Biology Databases
Research Materials
Miscellaneous


