Identification of essential genes for cancer immunotherapy - PubMed (original) (raw)
. 2017 Aug 31;548(7669):537-542.
doi: 10.1038/nature23477. Epub 2017 Aug 7.
Neville E Sanjana 3 4, Rigel J Kishton 1, Arash Eidizadeh 1, Suman K Vodnala 1, Maggie Cam 1, Jared J Gartner 1, Li Jia 1, Seth M Steinberg 1, Tori N Yamamoto 1 5, Anand S Merchant 1, Gautam U Mehta 1, Anna Chichura 1, Ophir Shalem 6, Eric Tran 1, Robert Eil 1, Madhusudhanan Sukumar 1, Eva Perez Guijarro 1, Chi-Ping Day 1, Paul Robbins 1, Steve Feldman 1, Glenn Merlino 1, Feng Zhang 7 8, Nicholas P Restifo 1 9
Affiliations
- PMID: 28783722
- PMCID: PMC5870757
- DOI: 10.1038/nature23477
Identification of essential genes for cancer immunotherapy
Shashank J Patel et al. Nature. 2017.
Abstract
Somatic gene mutations can alter the vulnerability of cancer cells to T-cell-based immunotherapies. Here we perturbed genes in human melanoma cells to mimic loss-of-function mutations involved in resistance to these therapies, by using a genome-scale CRISPR-Cas9 library that consisted of around 123,000 single-guide RNAs, and profiled genes whose loss in tumour cells impaired the effector function of CD8+ T cells. The genes that were most enriched in the screen have key roles in antigen presentation and interferon-γ signalling, and correlate with cytolytic activity in patient tumours from The Cancer Genome Atlas. Among the genes validated using different cancer cell lines and antigens, we identified multiple loss-of-function mutations in APLNR, encoding the apelin receptor, in patient tumours that were refractory to immunotherapy. We show that APLNR interacts with JAK1, modulating interferon-γ responses in tumours, and that its functional loss reduces the efficacy of adoptive cell transfer and checkpoint blockade immunotherapies in mouse models. Our results link the loss of essential genes for the effector function of CD8+ T cells with the resistance or non-responsiveness of cancer to immunotherapies.
Conflict of interest statement
Competing financial interests
The authors declare no competing financial interests.
Figures
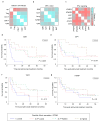
Extended Data Figure 1. Intratumoral expression of antigen presentation genes, B2M, TAP1 and TAP2 informs long-term survival of melanoma patients treated with anti-CTLA4 (ipilimumab) immunotherapy
a, Pearson correlation matrix of intratumoral cytolytic activity (CYT, expression of perforin and granzyme A) with tumour infiltrating effector cell markers for natural killer (NK, expression of NCAM1 and NCR1), regulatory T (Treg, expression of FOXP3 and IL2RA), CD4+ T (expression of CD3E and CD4) and CD8+ T cells (expression of CD3E and CD8A). b, Pearson correlation matrix of CYT with the expression of MHC class I antigen presentation genes. c, Pearson correlation matrix of CYT with the expression of IFNγ signalling genes. d–g, Kaplan-Meier survival plots of patient overall survival with the expression of antigen presentation genes after ipilimumab immunotherapy (Van allen et al. cohort). Data were divided into quartiles based on RPKM values of each individual gene and the four groups were evaluated for their association with survival. The global _P_-values shown indicate the overall association of the quartiles of gene expression levels with survival. n = 42 patients (a–g).
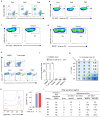
Extended Data Figure 2. Optimization of selection pressure and duration of co-culture for 2CT-CRISPR assay system
a, FACS plots showing percentages of CD4+ and CD8+ T cells in three different patient PBMCs after transduction with a retroviral plasmid encoding NY-ESO-1 TCR and expansion for 7 days. b, Transduction efficiency of T cells transduced with a retroviral plasmid encoding NY-ESO-1 TCR as determined by FACS. T cells were obtained from the peripheral blood of patients with metastatic melanoma. c, Transduction efficiency of T cells transduced with a retroviral plasmid encoding NY-ESO-1 TCR as determined by FACS. T cells were obtained from the peripheral blood of healthy donors. d, Transduction efficiency of T cells transduced with a retroviral plasmid encoding MART-1 TCR as determined by FACS. T cells were obtained from the peripheral blood of healthy donors. e, Representative plots of FACS-based determination of live, PI− (propidium iodine) CD3− tumour cell counts after co-culture of patient ESO T cells with Mel624 cells at an E:T ratio of 100 for 24 h. f, Barplot quantifies the cytolytic efficiency of T cells for data shown in (e). n = 3 biological replicates. g, Optimization of selection pressure exerted by ESO T cells on Mel624 cells at variable timings of co-culture and E:T ratios. Numbers in the grid represent average tumour cell survival (%) after co-culture. Data pooled from 3 independent experiments. n = 3 culture replicates. h, Upregulation of β2M expression at 0, 6 or 12 hours after co-culture of Mel624 cells with ESO T cells at an E:T ratio of 0.5. Left panel: Representative FACS plot showing distribution of β2M expressing tumour cells. Right panel: Bar plot depicts mean fluorescence intensities of n = 3 co-culture replicates**. i,** Specific reactivity of ESO T cells against NY-ESO-1 antigen assessed in tumour lines by IFNγ secretion (pg/ml) after overnight co-culture. n = 3 co-culture replicates. Values in f and h are mean ± s.e.m. ***P < 0.001 as determined by two-tailed Student’s _t-_test.
Extended Data Figure 3. Optimization of 2CT-CRISPR assay system for genome-scale screening
a, Representative FACS plot of B2M expression in Mel624 cells on day 5 after transduction with lentiCRISPRv2 lentivirus containing a pool of three sgRNAs targeting B2M. b–c, Cas9 disruption of MHC Class I antigen presentation/processing pathway genes reduces efficacy of T cell-mediated cytolysis. Timeline shows 12 hours of co-culture of ESO T cells with individual gene edited Mel624 cells at E:T ratio of 0.5. Live cell survival (%) was calculated from control cells unexposed to T cell selection. Each dot in the plot represents independent gene-specific CRISPR lentivirus infection replicate (n = 3). Improvement in CRISPR edited cell yields at 60 h timepoint compared to 36 h after 2CT assay as shown in (c). All values are mean ± s.e.m. Data is representative of two independent experiments.
Extended Data Figure 4. Genome-scale 2CT-CRISPR mutagenesis identifies genes in tumour cells essential for the effector function of T cells
a, Scatterplot of sgRNA representation in the plasmid pool and Mel624 cells at Day 7 after transduction with the GeCKOv2 library for 2CT-CRISPR screens with E:T of 0.5 and 0.3. b, Scatterplot showing the effect of T cell selection pressure on the global distribution of sgRNAs after co-culture at E:T of 0.5 and 0.3. c, Agreement between top ranked genes enriched via two different metrics-second most enriched sgRNA and RIGER _P_-value analyses in 2CT-CRISPR screens performed at E:T of 0.5. d, Scatterplot showing the enrichment of the most versus the second most enriched sgRNAs for top 100 genes after T cell-based selection at E:T 0.3. Data pooled from 2 independent screens with libraries A and B. e, Overlap of genes and miRs enriched after T cell-based selection at E:T of 0.5 (high selection) and 0.3 (low selection). Venn diagrams depicts shared and unique most enriched candidates in top 5% of the second most enriched sgRNA. f, Common enriched genes across all screens within the top 500 genes ranked by the second most enriched sgRNA.
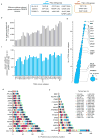
Extended Data Figure 5. Association of candidate essential genes with CYT and mutation spectrum
a, Top candidate genes are categorized based on their inducibility by effector cytokines IFNγ (light blue) or TNFα (orange), using publicly available gene expression profiles GSE3920, GSE5542, GSE2638. b, Genes whose expression are positively correlated (_P <_ 0.05) with cytolytic activity (defined as the geometric mean of _PRF1_ and _GZMA_ expression) in TCGA datasets for 36 human cancers. **c,** Overlap (Jaccard coefficient) between genes correlated with cytolytic activity (from panel **b**) with top 2.5% of CRISPR screen gene hits (with second best sgRNA enrichment > 0.5). d, Bubble plot depicting the number of overlapping genes from (b) correlated across multiple cancers. Previously known genes B2M, CASP7 and CASP8, and novel validated genes from CRISPR screen are highlighted (in bold) according to their correlation to the cytolytic activity in the number of different cancer-types. The size of each bubble represents the number of genes in each dataset. d–e, Pan-cancer mutational heterogeneity of top candidate genes from CRISPR screens with T cell based selection at E:T of 0.5 (d) and 0.3 (e). Patient tumour data containing genetic aberrations including missense, nonsense, non-start, frameshift, truncation or splice-site mutations, or homozygous deletions was retrieved from TCGA database.
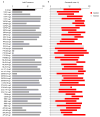
Extended Data Figure 6. Validation of top ranked candidate genes using Mel624 cells and two different T cell receptors
a–b, Survival of Mel624 cells edited with individual sgRNAs (2–4 per gene) after co-culture with ESO T cells (a) and MART-1 T cells (b) at E:T ratio of 0.5 in 2CT assay. _P_-value calculated for positively enriched gene-targeting sgRNAs compared to control sgRNA by Student’s _t_-test. Data representative of at least two independent experiments. n = 3 replicates per sgRNA. c. Representative histogram of deep sequencing analysis of on-target insertion-deletion (indel) mutations by individual lentiCRISPR. d–e, Deep sequencing analysis of indels generated by CRISPR-Cas9 at each exonic target site for the genes validated in Mel624 cells at day 20 post-transduction.
Extended Data Figure 7. Gene perturbation efficiency and indel mutations after CRISPR-Cas9 targeted disruption in A375
Deep sequencing analysis of indels generated by CRISPR-Cas9 at each exonic target site for validated in A375 cells at day 5 post-transduction. Average values are mean. Error bars denotes s.e.m.
Extended Data Figure 8. Characterization of non-synonymous mutations in APLNR identified in patient tumours resistant to immunotherapy
a, List of all somatic mutations in APLNR from 4 published immunotherapy studies,,, and 1 unpublished patient tumor from NCI Surgery Branch (SB). b, Schematic of the re-introduction of WT or mutated APLNR in _APLNR-_edited cells to functionally verify the point mutations from the SB and Van Allen et al. cohorts. Blasticidin selects for cells that received the WT/mutated APLNR rescue construct.
Extended Data Figure 9. APLNR modulates IFNγ signaling via physical interaction with JAK1
a, Pull-down of JAK1 and APLNR in the extracts from HEK 293T cells transiently transfected with APLNR-FLAG plasmid**. b,** Immunoblot showing the upregulation of JAK1 protein expression in APLNR overexpressing A375 cells (APLNR OE). EV: Empty vector control. c, Effect of overexpression of APLNR in tumour cells on T cell-mediated cytolysis. n = 4 biological replicates. d, Immunoblot showing that addition of 100 μM Apelin ligand does not induce phosphorylation of JAK1 in tumour cells. e, Immunoblot showing the phosphorylation levels of JAK1 at Tyr1022/1023 residues and STAT1 at Tyr701 residue upon 100 ng/ml IFNγ treatment for 30 min in _APLNR_-edited cells versus cells receiving a control sgRNA. f, Quantitative PCR analysis of JAK1-STAT1 pathway-induced genes in _APLNR_-edited cells post 4, 8 and 24 h of treatment with 1 μg/ml IFNγ. n = 3 biological replicates. g, Induction of surface expression of β2M on _APLNR-_edited cells upon co-culture with ESO T cells for 6 h as measured by FACS. h, Intracellular staining assay performed on CD8+ T cells to measure IFNγ production post co-culture with A375 cells as target for 5–6 hr. n = 3 biological replicates. All data are representative of at least two independent experiments. Error bars represent mean ± s.e.m. of replicate measurements. **** P < 0.0001, *** P < 0.001 **P < 0.01, *P < 0.05.
Extended Data Figure 10. APLNR knock-down decreases the efficiency of in vivo adoptive cell transfer immunotherapy
Subcutaneous tumour growth in mice receiving ACT of Pmel T cells. Tumour area (a) and overall survival (b) are shown. Significance for tumour growth kinetics were calculated by Wilcoxon rank sum test. Survival significance was assessed by a log-rank Mantel-Cox test. n = 5 mice per ‘Untreated’ groups. n = 10 mice per ‘Pmel ACT treated’ groups. All values are mean ± s.e.m. ****P < 0.0001, **P < 0.01, *P < 0.05. Data are representative of two independent experiments.
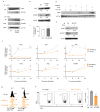
Figure 1. 2CT-CRISPR assay system confirms functional essentiality of antigen presentation genes for immunotherapy
a–c, Kaplan-Meier survival plots of patient overall survival with the expression of antigen presentation genes B2M (a), TAP1 (b) and TAP2 (c) after ipilimumab immunotherapy. Patients were categorized into ‘High’ and ‘Low’ groups according to the highest and the lowest quartiles of each individual gene expression (RPKM). Reported _P_-values have been penalized by multiplying the unadjusted _P_-value by 3 to account for the comparison of the two extreme quartiles. Hazard ratio (HR) was calculated using Mantel-Haenszel test; with HR ranges: B2M (0.02–0.31), TAP1 (0.04–0.52) and TAP2 (0.12–1.07). Data is derived from 42 melanoma patients from the Van-Allen et al. cohort. d, Schematic of the 2CT-CRISPR assay to identify essential genes for EFT. e, NY-ESO-1 antigen specific lysis of melanoma cells after 24 h of co-culture of ESO T cells with NY-ESO-1− SK23, NY-ESO-1+ SK23 and NY-ESO-1+ Mel624 cells (n = 3 biological replicates) at E:T ratio of 1. f, Survival of Mel624 cells modified through lentiviral CRISPR targeting of MHC class I antigen presentation/processing genes after introduction of ESO T cells. CRISPR-modified Mel624 cells were co-cultured with ESO T cells at E:T ratio of 0.5 for 12 h. Live cell survival (%) was calculated from control cells unexposed to T cell selection. Data is from 3 independent infection replicates. All values are mean ± s.e.m. ***P < 0.001 as determined by Student’s _t_-test.
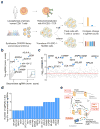
Figure 2. Genome-wide CRISPR mutagenesis reveals essential genes for the effector function of T cells in a target cell
a, Design of the genome-wide 2CT-CRISPR assay to identify loss-of-function genes conferring resistance to T cell-mediated cytolysis. b, Scatterplot of the normalized enrichment of the most-enriched sgRNA versus the second-most-enriched sgRNAs for all genes after T cell-based selection (inset). The top 100 genes by second-most-enriched sgRNA rank are displayed in the enlarged region. c, Identification of top enriched genes using the RIGER analysis. d, Consistency of multiple sgRNA enrichment for the top 20 ranked genes by second-most enriched sgRNA score. The number of sgRNAs targeting each gene that are found in the top 5% of most enriched sgRNAs overall is plotted. e, Schematic of MHC class I antigen processing pathway with candidate genes scoring in the top 0.1% of all genes in the library highlighted.
Figure 3. Categorization of candidate essential genes for EFT using available knowledge database
a, Candidate genes based on FDR cut-off of 0.1% (n = 554 genes) were functionally categorized by multiple methods to understand the biological significance for EFT. b, Most significant pathways by Ingenuity Pathway Analysis (P < 0.05) from top 2CT-CRISPR candidates. c–d, Association of top 554 candidate genes with intratumoral cytolytic activity (CYT, expression of perforin and granzyme) using TCGA datasets. c, RNA-sequencing data for 36 human cancers were obtained from the TCGA database and genes positively correlated with CYT (P < 0.05, Pearson correlation) were intersected with 2CT-CRISPR candidates to quantify number of overlapping genes in each cancer subtype. d, Heatmap showing the partitioning of the clusters of genes based on Pearson correlation coefficient values of CRISPR screen hits with CYT using pan-cancer TCGA data. Individual cancer and pathway heatmaps are available at
https://bioinformatics.cancer.gov/publications/restifo
.
Figure 4. Validation of top candidate genes across cancers
a, Schematic of the array validation strategy for top candidates from the pooled 2CT-CRISPR screen to test generalization across melanomas, MHC class I antigens and other (non-melanoma) cancer. b, Survival of HLA-A*02+ NY-ESO-1+ A375 cells edited with individual sgRNAs (2–4 per gene) after co-culture with ESO T cells at E:T ratio of 0.5. n = 3 biological replicates per sgRNA. c, Shared and unique genes essential for EFT in Mel624 and A375 melanoma cells. d, Survival of HLA-A*02+ NY-ESO-1+ renal cell carcinoma 2245R cells edited with individual sgRNAs (4 per gene) after co-culture with ESO T cells at E:T ratio of 0.5 in 2CT assay. n = 4 biological replicates per sgRNA. b–d, _P_-value calculated for positively enriched gene-targeting sgRNAs compared to control sgRNA by Student’s _t_-test. Data representative of at least two independent experiments.
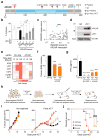
Figure 5. Functional loss of APLNR reduces efficacy of cancer immunotherapy
a, Non-synonymous mutations detected in APLNR in human melanoma tumours refractory to indicated immunotherapies. Ipi, ipilimumab; Nivo, nivolumab; Pembro, pembrolizumab; EC, extracellular domain; CS, cytoplasmic signalling domain. b, Mutations encoding G349E and T44S in APLNR resist the restoration of T-cell mediated cytolysis in _APLNR_-perturbed tumour cells. n = 3 biological replicates. c, Second most enriched sgRNA score in CRISPR screens for 96 APLNR-interacting proteins from the BioGrid database. d, Western blot probed for APLNR after immunoprecipitation pull-down of JAK1 from A375 cell lysates. Results were similar in an independent replicate experiment (not shown). e, Quantitative PCR analysis of JAK1-STAT1 pathway induced genes in wild-type and APLNR-edited cells at 0, 8 and 24 h post treatment with 1 μg/ml IFNγ. n = 3 biological replicates. f, Induction of surface expression of β2M on _APLNR-_edited cells upon co-culture with ESO T cells as measured by FACS. n = 3 biological replicates. g, IFNγ secretion from ESO T cells after overnight co-culture with CRISPR edited A375 cells determined using ELISA. n = 3 biological replicates. h, Schematic of in vivo experiments to test the response of B2m and Aplnr knock-out tumours to ACT in immunocompetent mice. i, j, Subcutaneous tumour growth in mice receiving ACT of Pmel-1 T cells. Tumour area (i) and overall survival (j) are shown. Significance for tumour growth kinetics were calculated by Wilcoxon rank sum test. Survival significance was assessed by a log-rank Mantel-Cox test. n = 5 mice per ‘No treatment’ groups. For ‘Pmel ACT’ groups, n = 9 mice in control group, n = 10 mice per _B2m_-sg and Aplnr-sg groups. All values are mean ± s.e.m. ****P < 0.0001, **P < 0.01, *P < 0.05. Data are representative of two independent experiments.
Comment in
- Resistance Genes Identified.
[No authors listed] [No authors listed] Cancer Discov. 2017 Oct;7(10):1056. doi: 10.1158/2159-8290.CD-NB2017-116. Epub 2017 Aug 15. Cancer Discov. 2017. PMID: 28811327 - JAKing up resistance to immunotherapy.
Alsufyani F, Pillai S. Alsufyani F, et al. Sci Immunol. 2017 Oct 6;2(16):eaaq0015. doi: 10.1126/sciimmunol.aaq0015. Sci Immunol. 2017. PMID: 28986420 - Running INTERFERONce on immunotherapy.
Rosenbaum S, Aplin A. Rosenbaum S, et al. Pigment Cell Melanoma Res. 2018 May;31(3):352-353. doi: 10.1111/pcmr.12663. Epub 2017 Nov 21. Pigment Cell Melanoma Res. 2018. PMID: 29068157 No abstract available.
Similar articles
- Natural Killer Cells Suppress T Cell-Associated Tumor Immune Evasion.
Freeman AJ, Vervoort SJ, Ramsbottom KM, Kelly MJ, Michie J, Pijpers L, Johnstone RW, Kearney CJ, Oliaro J. Freeman AJ, et al. Cell Rep. 2019 Sep 10;28(11):2784-2794.e5. doi: 10.1016/j.celrep.2019.08.017. Cell Rep. 2019. PMID: 31509742 - Acquired IFNγ resistance impairs anti-tumor immunity and gives rise to T-cell-resistant melanoma lesions.
Sucker A, Zhao F, Pieper N, Heeke C, Maltaner R, Stadtler N, Real B, Bielefeld N, Howe S, Weide B, Gutzmer R, Utikal J, Loquai C, Gogas H, Klein-Hitpass L, Zeschnigk M, Westendorf AM, Trilling M, Horn S, Schilling B, Schadendorf D, Griewank KG, Paschen A. Sucker A, et al. Nat Commun. 2017 May 31;8:15440. doi: 10.1038/ncomms15440. Nat Commun. 2017. PMID: 28561041 Free PMC article. - Genome-Wide CRISPR Screening Identifies JAK1 Deficiency as a Mechanism of T-Cell Resistance.
Han P, Dai Q, Fan L, Lin H, Zhang X, Li F, Yang X. Han P, et al. Front Immunol. 2019 Feb 19;10:251. doi: 10.3389/fimmu.2019.00251. eCollection 2019. Front Immunol. 2019. PMID: 30837996 Free PMC article. - CD8+ cytotoxic T lymphocytes in cancer immunotherapy: A review.
Farhood B, Najafi M, Mortezaee K. Farhood B, et al. J Cell Physiol. 2019 Jun;234(6):8509-8521. doi: 10.1002/jcp.27782. Epub 2018 Nov 22. J Cell Physiol. 2019. PMID: 30520029 Review. - Recent Advances in Lung Cancer Immunotherapy: Input of T-Cell Epitopes Associated With Impaired Peptide Processing.
Leclerc M, Mezquita L, Guillebot De Nerville G, Tihy I, Malenica I, Chouaib S, Mami-Chouaib F. Leclerc M, et al. Front Immunol. 2019 Jul 3;10:1505. doi: 10.3389/fimmu.2019.01505. eCollection 2019. Front Immunol. 2019. PMID: 31333652 Free PMC article. Review.
Cited by
- Immunotherapy in gastroesophageal cancers: Current state and future directions.
Shaikh H, Kamran A, Monga DK. Shaikh H, et al. J Oncol Pharm Pract. 2021 Mar;27(2):395-404. doi: 10.1177/1078155220963538. Epub 2020 Oct 13. J Oncol Pharm Pract. 2021. PMID: 33050805 Free PMC article. Review. - CRISPR/Cas9 Gene-Editing in Cancer Immunotherapy: Promoting the Present Revolution in Cancer Therapy and Exploring More.
Ou X, Ma Q, Yin W, Ma X, He Z. Ou X, et al. Front Cell Dev Biol. 2021 May 20;9:674467. doi: 10.3389/fcell.2021.674467. eCollection 2021. Front Cell Dev Biol. 2021. PMID: 34095145 Free PMC article. Review. - Single-Cell CD4 and CD8 T-Cell Secretome Profiling Reveals Temporal and Niche Differences in Acute Myeloid Leukemia Following Immune Checkpoint Blockade Therapy.
Root JL, Desai PN, Ly C, Wang B, Jelloul FZ, Zhou J, Mackay S, Alfayez M, Matthews J, Pierce S, Reville PK, Daver N, Abbas HA. Root JL, et al. Cancer Res Commun. 2024 Mar 6;4(3):671-681. doi: 10.1158/2767-9764.CRC-23-0402. Cancer Res Commun. 2024. PMID: 38391202 Free PMC article. - Protein Barcodes Enable High-Dimensional Single-Cell CRISPR Screens.
Wroblewska A, Dhainaut M, Ben-Zvi B, Rose SA, Park ES, Amir ED, Bektesevic A, Baccarini A, Merad M, Rahman AH, Brown BD. Wroblewska A, et al. Cell. 2018 Nov 1;175(4):1141-1155.e16. doi: 10.1016/j.cell.2018.09.022. Epub 2018 Oct 18. Cell. 2018. PMID: 30343902 Free PMC article. - Immuno-Oncology: Emerging Targets and Combination Therapies.
Marshall HT, Djamgoz MBA. Marshall HT, et al. Front Oncol. 2018 Aug 23;8:315. doi: 10.3389/fonc.2018.00315. eCollection 2018. Front Oncol. 2018. PMID: 30191140 Free PMC article. Review.
References
- Chan TA, Wolchok JD, Snyder A. Genetic basis for clinical response to CTLA-4 blockade in melanoma. New England Journal of Medicine. 2015;373:1984–1984. - PubMed
Publication types
MeSH terms
Substances
LinkOut - more resources
Full Text Sources
Other Literature Sources
Molecular Biology Databases
Research Materials
Miscellaneous
