Expanding the host cell ubiquitylation machinery targeting cytosolic Salmonella - PubMed (original) (raw)
Expanding the host cell ubiquitylation machinery targeting cytosolic Salmonella
Mira Polajnar et al. EMBO Rep. 2017 Sep.
Abstract
Ubiquitylation is one of the cardinal post-translational modifications in the cell, balancing several distinct biological processes and acting as a pathogen recognition receptor during bacterial pathogen invasion. A dense layer of polyubiquitin chains marks invading bacteria that gain access to the host cytosol for their selective clearance via xenophagy. However, the enzymes that mediate recognition of cytosolic bacteria and generate this ubiquitin (Ub) coat remain largely elusive. To address this, we employed an image-based RNAi screening approach to monitor the loss of Ub on Salmonella upon depletion of human Ub E3 ligases in cells. Using this approach, we identified ARIH1 as one of the ligases involved in the formation of Ub coat on cytosolic bacteria. In addition, we provide evidence that the RING-between-RING ligase ARIH1, together with LRSAM1 and HOIP, forms part of a network of ligases that orchestrates recognition of intracellular Salmonella and participates in the activation of the host cell immune response.
Keywords: HHARI; Salmonella; ARIH1; RBR E3 ligase; ubiquitin.
© 2017 The Authors.
Figures
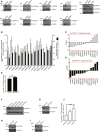
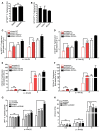
Figure EV1. Infection, knockdown, and wild‐type S. Typhimurium controls (related to Fig 1)
- A
Lysates from HeLa cells transfected with indicated pooled siRNAs for 72 h were analyzed by SDS–PAGE and immunoblotting. Due to low specificity of commercially available antibodies, the efficiency of RNAi‐mediated depletion of NKLAM and RNF144A could not be assessed by immunoblotting. Notably, Parkin is not expressed in HeLa cells. - B
HeLa cells reversely transfected with sicontrol or pooled siRNAs targeting all 14 known RBR Ub E3 ligases for 72 h were infected with wild‐type cytoGFP‐expressing S. Typhimurium for 2 h prior to fixation and immunolabeling with anti‐polyUb antibody (FK2). Number of GFP‐positive (GFP+) and Ub‐positive and GFP‐positive (Ub+/GFP+) bacteria was determined using an automated quantification software and normalized to sicontrol counting on average 800 cells/sample (GFP‐positive S. Typhimurium/cell = 3.90 ± 0.42, ubiquitylated S. Typhimurium [%] = 11.76 ± 2.10). Data represent mean ± SD. n = 2 biological replicates. - C, D
_z_‐scores of GFP+ (C) and Ub+/GFP+ (D) bacteria from (B). - E
HeLa cells transfected with sicontrol or left untreated (mock) for 72 h were infected with Δ_sifA_ cytoGFP‐expressing S. Typhimurium for 2 h prior to fixation. Number of GFP+ bacteria in at least 250 cells/sample was determined using automated quantification. Data represent mean ± SD. Significance was determined using unpaired Student's _t_‐test. ns = not significant. n = 3 biological replicates. - F–I
Lysates from HeLa cells transfected with indicated single siRNAs for 72 h were analyzed by SDS–PAGE and immunoblotting. - J
HeLa cells transfected with indicated single siRNAs for 72 h were infected as in (B) followed by fixation and confocal microscopy. Number of GFP+ bacteria was determined by automated quantification in 250 cells/sample on average. Data represent mean ± SD. Significance was determined using one‐way ANOVA. *P < 0.05, **P < 0.01. n = 3 biological replicates.
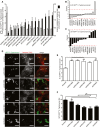
Figure 1. Image‐based RNAi screening of RBR E3 ligases involved in bacterial Ub coat formation upon S. Typhimurium infection
- A
HeLa cells reversely transfected for 72 h with non‐targeting control (sicontrol) or pooled siRNAs targeting all 14 known RBR Ub E3 ligases were infected with cytoGFP‐expressing Δ_sifA S_. Typhimurium for 2 h prior to fixation and immunolabeling with anti‐Ub antibody (FK2). Number of GFP‐positive (GFP+) and Ub‐ and GFP‐positive (Ub+/GFP+) bacteria was determined using automated quantification software and normalized to sicontrol counting on average 800 cells/sample (GFP‐positive S. Typhimurium/cell = 3.50 ± 0.13, ubiquitylated S. Typhimurium [%] = 8.32 ± 1.10). Data represent mean ± SD. n = 2 biological replicates. - B, C
_z_‐scores of GFP+ (B) and Ub+/GFP+ (C) bacteria from (A). - D
HeLa cells were transfected with indicated single siRNAs, infected, fixed, and immunolabeled as in (A). Scale bar: 10 μm. Arrowheads indicate colocalization events. - E, F
Automated quantification of GFP+ (E) and Ub+/GFP+ (F) bacteria in on average 250 cells/sample. Data represent mean ± SD. Significance was determined using one‐way ANOVA. *P < 0.05, **P < 0.01, ***P < 0.001, ns = not significant. n = 3 biological replicates.
Data information: See also Fig EV1.
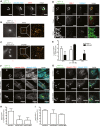
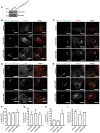
Figure 2. ARIH1 is recruited to the cytosolic S. Typhimurium, localizes with LRSAM1, and contributes K48‐linked polyUb chains to their Ub coat
- A
HeLa cells were infected with cytoGFP Δ_sifA S_. Typhimurium for 2 h followed by fixation, immunolabeling with anti‐Ub (FK2) and anti‐ARIH1 antibodies, and confocal microscopy. Scale bar: 5 μm. - B, C
HeLa cells were infected and fixed as in (A) and immunolabeled with anti‐ARIH1 (B) or anti‐LRSAM1 (C) antibodies followed by additional fixation and super‐resolution _d_STORM imaging. Scale bar: 2 μm. Arrowheads indicate nanoscale protein patches. - D
HeLa cells were infected for indicated p.i. time points and fixed as in (A) prior to immunolabeling with anti‐ARIH1 and anti‐LRSAM1 antibodies and confocal microscopy. Scale bar: 5 μm. Arrowheads indicate colocalization events. - E
Automated quantification of LRSAM1‐positive and ARIH1‐positive S. Typhimurium from (D) in at least 100 cells/sample. Data represent mean ± SD. n = 2 biological replicates. - F, G
HeLa cells transfected with indicated single siRNAs for 72 h and infected as in (A) prior to fixation and immunolabeling with anti‐Ub (FK2) and anti‐K48 (F) or ‐K63 polyUb (G) antibodies. Scale bar: 10 μm. Arrowheads indicate colocalization events. - H, I
Automated quantification of K48+/GFP+ (F) or K63+/GFP+ (G) bacteria in at least 100 cells/sample from (F and G). Data represent mean ± SD. n = 2 biological replicates.
Data information: See also Fig EV2.
Figure EV2. Neddylated CRLs are not required for ubiquitylation of cytosolic S. Typhimurium (related to Figs 2, 3, 4)
- HeLa cells transfected with indicated single siRNAs for 72 h were infected with cytoGFP‐expressing Δ_sifA S_. Typhimurium for 2 h followed by fixation and anti‐ARIH1 immunolabeling. Number of ARIH1+/GFP+ bacteria in at least 250 cells/sample was determined using automated quantification. Data represent mean ± SD. n = 2 biological replicates.
- HeLa cells were infected with cytoGFP wild‐type S. Typhimurium for 2 h followed by fixation, immunolabeling with anti‐ARIH1 antibody, and confocal microscopy. Arrowheads indicate colocalization events. Scale bar: 5 μm.
- Integrity control of bacteria. While performing the in vitro ubiquitylation reaction, bacterial supernatants were sampled right before (s1) and immediately after (s2) the reaction. Intact bacteria were used as a positive control.
- HeLa cells infected as in (A) or left uninfected were treated with 2 μM MLN4924 or DMSO during the course of the infection prior to lysis. Lysates were analyzed by SDS–PAGE and immunoblotting.
- HeLa cells infected as in (A) were treated with MLN4924 or DMSO as in (D) prior to fixation and immunolabeling with anti‐Ub antibody (FK2). Arrowheads indicate colocalization events. Scale bar: 5 μm.
- HeLa cells were transfected with indicated pooled siRNAs and infected as in (A) prior to fixation and anti‐Ub (FK2) immunolabeling. Arrowheads indicate colocalization events. Scale bar: 5 μm.
- HeLa cells were reversely transfected with indicated pooled siRNAs for 72 h and lysed. Lysates were analyzed by SDS–PAGE and immunoblotting.
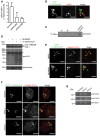
Figure 3. In vitro ubiquitylation of S. Typhimurium by ARIH1
- A
In vitro ubiquitylation reaction scheme. - B
Purified inactive full‐length or C‐terminally truncated, active ARIH1 (Δariadne) were incubated with HA‐Ub, UBA1, and UBCH7 in the absence or presence of ATP at 37°C for 1 h. Reactions were stopped by addition of EDTA and subjected to SDS–PAGE and immunoblot analysis. - C–E
Reactions were carried out as in (B) in the presence of cytoGFP Δ_sifA S_. Typhimurium (C), purified mitochondria from P. anserina (D), or proteinase K‐pretreated S. Typhimurium (E). Once the reactions were stopped, bacteria or mitochondria were repeatedly pelleted by centrifugation and washed followed by separation on SDS–PAGE and immunoblotting. Notably, PMSF was added to the ubiquitylation buffer in (E) to inhibit proteinase K activity during the ubiquitylation reaction.
Data information: See also Fig EV2.
Figure 4. ARIH1 function during bacterial infection does not require activation by CRLs and encompasses both autophagy‐dependent and autophagy‐independent roles
- A
HeLa cells infected with cytoGFP‐expressing Δ_sifA S_. Typhimurium for 2 h or left uninfected were treated with 2 μM MLN4924 or DMSO during the course of infection, fixed, and immunolabeled with anti‐Ub antibody (FK2). Number of Ub+/GFP+ bacteria in at least 250 cells/sample was determined by using automated quantification. Data represent mean ± SD. Significance was determined using unpaired Student's _t_‐test. ns = not significant. n = 3 biological replicates. - B
HeLa cells were transfected with indicated pooled siRNAs for 72 h, infected, fixed, and immunolabeled as described in (A) prior to fixation. Number of Ub+/GFP+ bacteria was determined by automated quantification in at least 100 cells/sample. Data represent mean ± SD. n = 2 biological replicates. - C–H
Wild‐type or ATG7 CRISPR/Cas9 knockout HeLa cells transfected for 72 h with indicated siRNAs were infected during indicated p.i. time points as in (A) prior to fixation (C, D, and G) or lysis and serial dilution plating (E, F, and H). Number of GFP+ bacteria in at least 250 cells/sample was determined using automated quantification (C, D, and G). Results in (C–F) were normalized to the 30 min p.i. time point. Data represent mean ± SD. Significance was determined using two‐way ANOVA. *P < 0.05, **P < 0.01, ***P < 0.001, ns = not significant. n = 3 (wild‐type HeLa) or n = 2 (ATG7 knockout HeLa) biological replicates.
Data information: See also Fig EV2.
Figure EV3. Colocalization of xenophagy components to cytosolic S. Typhimurium upon ARIH1 depletion (related to Fig 4)
- A
Lysates from wild‐type and ATG7 CRISPR/Cas9 knockout HeLa cells were analyzed by SDS–PAGE and immunoblotting. - B–I
HeLa cells transfected with indicated siRNAs for 72 h were infected with Δ_sifA_ cytoGFP‐expressing S. Typhimurium for 2 h, fixed, and immunolabeled with anti‐LC3B (B), anti‐NDP52 (C), anti‐p62 (D), or anti‐OPTN (E) antibodies. Number of GFP+ bacteria that colocalized with LC3B (F), NDP52 (G), p62 (H), or OPTN (I) was determined by automated quantification in at least 100 cells/sample. Data represent mean ± SD. n = 2 biological replicates.
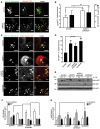
Figure 5. Depletion of either ARIH1, LRSAM1, or both triggers linear ubiquitylation of S. Typhimurium and activation of the NF‐κB pathway
- A
Wild‐type HeLa cells transfected with indicated single siRNAs for 72 h were left infected for 2 h with cytoGFP‐expressing ΔsifA S. Typhimurium prior to fixation and immunolabeling with anti‐Ub antibody (FK2). Scale bar: 5 μm. Arrowheads indicate colocalization events. - B
Automated quantification of GFP+ and Ub+/GFP+ bacteria in at least 250 cells/sample from (A). Data represent mean ± SD. Significance was determined using two‐way ANOVA. *P < 0.05, ns = not significant. n = 3 biological replicates. - C
HeLa cells transfected with indicated siRNAs and infected as in (A) were fixed and immunolabeled with an antibody specific for linear Ub chains (M1‐Ub). Scale bar: 5 μm. Arrowheads indicate colocalization events. - D
Automated quantification of M1+/GFP+ bacteria in at least 250 cells/sample from (C). Data represent mean ± SD. Significance was determined using one‐way ANOVA. *P < 0.05, **P < 0.01, ***P < 0.001. n = 3 biological replicates. - E
Lysates from HeLa cells were transfected and infected as in (A) during indicated p.i. time points or left uninfected and analyzed by SDS–PAGE and immunoblotting. - F, G
Quantification of IkBα protein abundance (F) and phosphorylation of p65 (G) from (E). All density values were normalized to actin. Data represent mean ± SD. Significance was determined using two‐way ANOVA. *P < 0.05, ***P < 0.001, n = 4 biological replicates.
Data information: See also Fig EV4.
Figure EV4. Immune detection of Ub chains topologies (related to Fig 5)
- Purified linear (M1), K48‐linked, and K63‐linked di‐Ub variants were separated by SDS–PAGE and analyzed by immunoblotting.
- HeLa cells were transfected with indicated siRNAs and infected as in (A) followed by fixation and immunolabeling with anti‐polyUb antibodies (FK2 and M1). Scale bar: 5 μm. Regions of interest (ROIs) show colocalization of FK2‐positive and M1‐positive bacteria and a concomitant increase in fluorescence intensities.
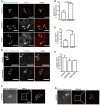
Figure 6. ARIH1, LRSAM1, and HOIP mutually regulate localization of host ligases to cytosolic bacteria
- A
HeLa cells transfected with indicated siRNAs were infected with cytoGFP Δ_sifA S_. Typhimurium for 2 h followed by fixation and immunolabeling with anti‐ARIH1 antibody. Scale bar: 5 μm. Arrowheads indicate colocalization events. - B, C
Automated quantification of ARIH1+ bacteria upon LRSAM1 (B) or HOIP (C) knockdown in on average 250 cells/sample from (A). Data represent mean ± SD. Significance was determined using unpaired Student's _t_‐test. *P < 0.05, ***P < 0.001. n = 3 biological replicates. - D
HeLa cells transfected with indicated siRNA were infected as in (A), fixed and immunolabeled with anti‐LRSAM1 antibody. Scale bar: 5 μm. Arrowheads indicate colocalization events. - E
Automated quantification of LRSAM1+ S. Typhimurium upon knockdown of ARIH1 in at least 100 cells/sample. Data represent mean ± SD. n = 2 biological replicates. - F, G
HeLa cells were transfected with indicated siRNA, fixed, immunolabeled with anti‐ARIH1 (F), or anti‐LRSAM1 (G) antibody, followed by additional post‐staining fixation and super‐resolution _d_STORM imaging. Scale bar: 2 μm. Arrowheads indicate nanoscale protein patches.
Data information: See also Fig EV5.
Figure EV5. ARIH1 does not bind to LRSAM1 or HOIP (related to Fig 6)
- HeLa cells were reversely transfected with indicated single siRNA for 72 h and lysed. Lysates were analyzed by SDS–PAGE and immunoblotting.
- Lysates from HeLa cells expressing C‐terminally HA‐tagged ARIH1 were subjected to HA immunoprecipitation and analyzed by SDS–PAGE and immunoblotting.
Comment in
- Salmonella ubiquitination: ARIH1 enters the fray.
Lobato-Márquez D, Mostowy S. Lobato-Márquez D, et al. EMBO Rep. 2017 Sep;18(9):1476-1477. doi: 10.15252/embr.201744672. Epub 2017 Aug 18. EMBO Rep. 2017. PMID: 28821533 Free PMC article.
Similar articles
- LUBAC-synthesized linear ubiquitin chains restrict cytosol-invading bacteria by activating autophagy and NF-κB.
Noad J, von der Malsburg A, Pathe C, Michel MA, Komander D, Randow F. Noad J, et al. Nat Microbiol. 2017 May 8;2:17063. doi: 10.1038/nmicrobiol.2017.63. Nat Microbiol. 2017. PMID: 28481331 Free PMC article. - The LRR and RING domain protein LRSAM1 is an E3 ligase crucial for ubiquitin-dependent autophagy of intracellular Salmonella Typhimurium.
Huett A, Heath RJ, Begun J, Sassi SO, Baxt LA, Vyas JM, Goldberg MB, Xavier RJ. Huett A, et al. Cell Host Microbe. 2012 Dec 13;12(6):778-90. doi: 10.1016/j.chom.2012.10.019. Cell Host Microbe. 2012. PMID: 23245322 Free PMC article. - Linear ubiquitination of cytosolic Salmonella Typhimurium activates NF-κB and restricts bacterial proliferation.
van Wijk SJL, Fricke F, Herhaus L, Gupta J, Hötte K, Pampaloni F, Grumati P, Kaulich M, Sou YS, Komatsu M, Greten FR, Fulda S, Heilemann M, Dikic I. van Wijk SJL, et al. Nat Microbiol. 2017 May 8;2:17066. doi: 10.1038/nmicrobiol.2017.66. Nat Microbiol. 2017. PMID: 28481361 - The ubiquitin ligation machinery in the defense against bacterial pathogens.
Tripathi-Giesgen I, Behrends C, Alpi AF. Tripathi-Giesgen I, et al. EMBO Rep. 2021 Nov 4;22(11):e52864. doi: 10.15252/embr.202152864. Epub 2021 Sep 13. EMBO Rep. 2021. PMID: 34515402 Free PMC article. Review. - RING-Between-RING E3 Ligases: Emerging Themes amid the Variations.
Dove KK, Klevit RE. Dove KK, et al. J Mol Biol. 2017 Nov 10;429(22):3363-3375. doi: 10.1016/j.jmb.2017.08.008. Epub 2017 Aug 19. J Mol Biol. 2017. PMID: 28827147 Free PMC article. Review.
Cited by
- HOIL-1 ubiquitin ligase activity targets unbranched glucosaccharides and is required to prevent polyglucosan accumulation.
Kelsall IR, McCrory EH, Xu Y, Scudamore CL, Nanda SK, Mancebo-Gamella P, Wood NT, Knebel A, Matthews SJ, Cohen P. Kelsall IR, et al. EMBO J. 2022 Apr 19;41(8):e109700. doi: 10.15252/embj.2021109700. Epub 2022 Mar 11. EMBO J. 2022. PMID: 35274759 Free PMC article. - Selective Autophagy by Close Encounters of the Ubiquitin Kind.
Vainshtein A, Grumati P. Vainshtein A, et al. Cells. 2020 Oct 24;9(11):2349. doi: 10.3390/cells9112349. Cells. 2020. PMID: 33114389 Free PMC article. Review. - Regulation and repurposing of nutrient sensing and autophagy in innate immunity.
Sanchez-Garrido J, Shenoy AR. Sanchez-Garrido J, et al. Autophagy. 2021 Jul;17(7):1571-1591. doi: 10.1080/15548627.2020.1783119. Epub 2020 Jul 5. Autophagy. 2021. PMID: 32627660 Free PMC article. Review. - Roles of ubiquitin in autophagy and cell death.
Gómez-Díaz C, Ikeda F. Gómez-Díaz C, et al. Semin Cell Dev Biol. 2019 Sep;93:125-135. doi: 10.1016/j.semcdb.2018.09.004. Epub 2018 Sep 10. Semin Cell Dev Biol. 2019. PMID: 30195063 Free PMC article. Review. - An innate pathogen sensing strategy involving ubiquitination of bacterial surface proteins.
Apte S, Bhutda S, Ghosh S, Sharma K, Barton TE, Dibyachintan S, Sahay O, Roy S, Sinha AR, Adicherla H, Rakshit J, Tang S, Datey A, Santra S, Joseph J, Sasidharan S, Hammerschmidt S, Chakravortty D, Oggioni MR, Santra MK, Neill DR, Banerjee A. Apte S, et al. Sci Adv. 2023 Mar 22;9(12):eade1851. doi: 10.1126/sciadv.ade1851. Epub 2023 Mar 22. Sci Adv. 2023. PMID: 36947610 Free PMC article.
References
- Spadoni I, Zagato E, Bertocchi A, Paolinelli R, Hot E, Di Sabatino A, Caprioli F, Bottiglieri L, Oldani A, Viale G et al (2015) A gut‐vascular barrier controls the systemic dissemination of bacteria. Science 350: 830–834 - PubMed
- Marcus SL, Brumell JH, Pfeifer CG, Finlay BB (2000) Salmonella pathogenicity islands: big virulence in small packages. Microbes Infect 2: 145–156 - PubMed
MeSH terms
Substances
LinkOut - more resources
Full Text Sources
Other Literature Sources
