TRPC6 counteracts TRPC3-Nox2 protein complex leading to attenuation of hyperglycemia-induced heart failure in mice - PubMed (original) (raw)
TRPC6 counteracts TRPC3-Nox2 protein complex leading to attenuation of hyperglycemia-induced heart failure in mice
Sayaka Oda et al. Sci Rep. 2017.
Abstract
Excess production of reactive oxygen species (ROS) caused by hyperglycemia is a major risk factor for heart failure. We previously reported that transient receptor potential canonical 3 (TRPC3) channel mediates pressure overload-induced maladaptive cardiac fibrosis by forming stably functional complex with NADPH oxidase 2 (Nox2). Although TRPC3 has been long suggested to form hetero-multimer channels with TRPC6 and function as diacylglycerol-activated cation channels coordinately, the role of TRPC6 in heart is still obscure. We here demonstrated that deletion of TRPC6 had no impact on pressure overload-induced heart failure despite inhibiting interstitial fibrosis in mice. TRPC6-deficient mouse hearts 1 week after transverse aortic constriction showed comparable increases in fibrotic gene expressions and ROS production but promoted inductions of inflammatory cytokines, compared to wild type hearts. Treatment of TRPC6-deficient mice with streptozotocin caused severe reduction of cardiac contractility with enhancing urinary and cardiac lipid peroxide levels, compared to wild type and TRPC3-deficient mice. Knockdown of TRPC6, but not TRPC3, enhanced basal expression levels of cytokines in rat cardiomyocytes. TRPC6 could interact with Nox2, but the abundance of TRPC6 was inversely correlated with that of Nox2. These results strongly suggest that Nox2 destabilization through disrupting TRPC3-Nox2 complex underlies attenuation of hyperglycemia-induced heart failure by TRPC6.
Conflict of interest statement
The authors declare that they have no competing interests.
Figures
Figure 1
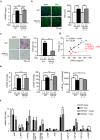
TRPC6 deletion attenuates pressure overload-induced cardiac fibrosis but not fibrotic gene expression in mice. (a) Heart weight (HW) /body weight (BW) ratio in WT and TRPC6(−/−) mice 6 weeks after TAC. WT- TAC(−) (sham) (n = 6), TRPC6(−/−)-sham (n = 6), WT-TAC (n = 13), TRPC6(−/−)-TAC (n = 11). (b) Representative images of wheat germ agglutinin (WGA) staining for cross-sectional areas (CSA) measurement 6 weeks after TAC (left). Green; WGA, blue; DAPI. Quantitative results are shown in right panel. WT-sham (n = 6), TRPC6(−/−)-sham (n = 6), WT-TAC (n = 13), TRPC6(−/−)-TAC (n = 11). (c,d) TRPC6 contributes to TAC induced cardiac fibrosis. (c) Representative images of picrosirius red staining 6 weeks after TAC and results of interstitial fibrosis 6 weeks after TAC. WT-sham (n = 6), TRPC6(−/−)-sham (n = 6), WT-TAC (n = 13), TRPC6(−/−)-TAC (n = 11). (d) Relationship between fibrosis and hypertrophy 6 weeks after TAC. WT-sham (n = 6), TRPC6(−/−)-sham (n = 6), WT-TAC (n = 13), TRPC6(−/−)-TAC (n = 11). (e) Absence of TRPC6 does not affect pressure overload-induced LV dysfunction. LV end-diastolic pressure (LVEDP; left), LV end-systolic pressure (LVESP; middle) and LV dP/dtmax (right) in mice 6 weeks after TAC. WT-sham (n = 6), TRPC6(−/−)-sham (n = 6), WT-TAC (n = 13), TRPC6(−/−)-TAC (n = 11). (f) Expression levels of hypertrophy-related and fibrosis-related mRNAs in mouse hearts 1 week after TAC. WT-sham (n = 3), other groups (n = 4 each). Error bars, s.e.m. *P < 0.05, **P < 0.01. Results of WT mice were the same as those reported previously, .
Figure 2
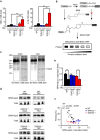
TRPC6 deletion enhances pressure overload-induced expressions of inflammatory cytokine mRNAs in mouse hearts. (a) Expression levels of TNFα and IL1β mRNAs in mouse hearts 1 week after TAC. WT sham (n = 3), other groups (n = 4 each). (b) Schema for the principle of BPM labeling assay. (c) Representative images of western blotting using anti-biotin-HRP and coomassie brilliant blue (CBB) staining of gels loaded with plasma samples from mice 6 weeks after TAC. Full-length blots and gels are presented in Supplementary Fig. 2a. (d,e) Representative western blot (d) and quantification (e) of BPM-modified and total Gpx3 in mouse plasma 6 weeks after TAC. WT-sham (n = 6), TRPC3(−/−)-sham (n = 6), TRPC6(−/−)-sham (n = 6), WT-TAC (n = 13), TRPC6(−/−)-TAC (n = 12), TRPC6(−/−)-TAC (n = 11). Full-length blots of all samples are presented in Supplementary Fig. 2b. (f) Relationship between fibrosis and levels of BPM-modified Gpx3. WT-sham (n = 6), TRPC3(−/−)-sham (n = 6), TRPC6(−/−)-sham (n = 6), WT-TAC (n = 13), TRPC3(−/−)-TAC (n = 12), TRPC6(−/−)-TAC (n = 11). Error bars, s.e.m. *P < 0.05, **P < 0.01.
Figure 3
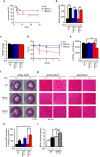
Deletion of TRPC6 but not TRPC3 promotes streptozotocin(STZ)-induced cardiac dysfunction in mice. (a) Survival rate of STZ-treated mice (n = 10 each). (b) Concentration of blood glucose (n = 3 each). (c) HW/BW ratio of mice with or without STZ treatment for 4 weeks (n = 3 each). (d,e) Absence of TRPC6 exacerbates STZ-induced LV dysfunction. Time courses of fractional shortening (FS) (d) and LVdP/dtmax at the end of 4-week STZ treatment (e) (n = 3 each). (f,g) Representative images of hematoxylin & eosin-stained LV sections to visualize cross sectional area of cardiomyocytes (f) and magnified endocardial (left) and epicardial (right) regions of LV sections stained with Masson Trichrome (g). (h,i) Absence of TRPC6 enhances hyperglycemia-induced ROS production. Accumulation of malondialdehyde (MDA) in urine (h) and heart (i) (n = 3 each). Error bars, s.e.m. *P < 0.05,**P < 0.01.
Figure 4
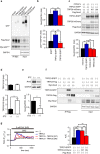
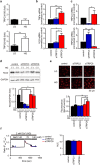
Involvement of TRPC6 in hyperglycemia-induced Nox2 downregulation through inhibition of the TRPC3-Nox2 complex formation. (a) Interaction of TRPC6-EGFP with Flag-Nox2 and Myc-p22phox in HEK293 cells. Immunoprecipitation (IP) was performed using an anti-Myc antibody. Full-length blots are presented in Supplementary Fig. 3a. (b) Quantitative results of Nox2 and p22phox protein abundances in input samples. (n = 4 each) (c) Effects of expression of TRPC6 (WT or DN) on Nox2 stability in TRPC3-EGFP and Flag-Nox2-expressing HEK293 cells (n = 3 each). Full-length blots are presented in Supplementary Fig. 3b. (d) Expression levels of TRPC3 and TRPC6 mRNAs in mouse hearts with or without STZ treatment (n = 3 each). (e) Nox2 protein abundance in mouse hearts with or without STZ (n = 3 each). Full-length blots are presented in Supplementary Fig. 3c. (f) Formation of protein complex among TRPC3-EGFP, Myc-Nox2 and TRPC6-Flag. IP was performed using anti-Flag antibody. Full-length blots are presented in Supplementary Fig. 3d. (g) OAG (90 µM)-induced Ca2+ responses in HEK293 cells expressing EGFP (−), TRPC3-EGFP (TRPC3), TRPC3-EGFP and TRPC6-WT-mCherry (TRPC3 + TRPC6(WT)), and TRPC3-EGFP and TRPC6-DN-mCherry (TRPC3 + TRPC6(DN)). Averaged time courses (left) and [Ca2+]i increases shown as area under the curve (AUC, right) (n = 30 cells). Error bars, s.e.m. *P < 0.05, **P < 0.01.
Figure 5
Involvement of TRPC6 in TRPC3/Nox2-mediated ROS production. (a) Expression levels of TRPC3 and TRPC6 mRNAs in NRCMs cultured in low (LG, 5.5 mM) or high (HG, 25 mM) glucose-containing medium (n = 3 each). (b) Expression levels of TNFα or IL1β in NRCMs cultured in LG or HG medium (n = 7 each). (c) Expression levels of TRPC3 and TRPC6 mRNAs in NRCMs transfected with siRNAs. (n = 5 each). (d,e) Abundance of Nox2 protein (d) and ROS production (e) in siRNA-transfected NRCMs cultured in LG or HG medium (n = 3 each). Full-length blots are presented in Supplementary Fig. 4. (f) Ca2+ responses induced by hypotonic stress (70 mM NaCl) in siRNA-transfected NRCMs. Averaged time courses (left) and [Ca2+]i increases shown as AUC (right) (n = 45–46 cells). Error bars, s.e.m.*P < 0.05, **P < 0.01.
Figure 6
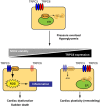
Schema of negative crosstalk between TRPC6 and TRPC3-Nox2 complex in cardiomyocytes. In resting condition, TRPC3 and TRPC6 channels function independently or coordinately in cardiomyocytes. Once hearts are exposed to environmental stresses such as hemodynamic load and hyperglycemia, TRPC3 forms stable protein complex with Nox2, which evokes aberrant ROS production in cardiomyocytes. In contrast, environmental stresses also upregulate TRPC6, which can counteract formation of the TRPC3-Nox2 complex in cardiomyocytes, leading to Nox2 destabilization, and resulting in negative regulation of ROS signaling in heart.
Similar articles
- TRPC3 positively regulates reactive oxygen species driving maladaptive cardiac remodeling.
Kitajima N, Numaga-Tomita T, Watanabe M, Kuroda T, Nishimura A, Miyano K, Yasuda S, Kuwahara K, Sato Y, Ide T, Birnbaumer L, Sumimoto H, Mori Y, Nishida M. Kitajima N, et al. Sci Rep. 2016 Nov 11;6:37001. doi: 10.1038/srep37001. Sci Rep. 2016. PMID: 27833156 Free PMC article. - TRPC3-Nox2 axis mediates nutritional deficiency-induced cardiomyocyte atrophy.
Sudi SB, Tanaka T, Oda S, Nishiyama K, Nishimura A, Sunggip C, Mangmool S, Numaga-Tomita T, Nishida M. Sudi SB, et al. Sci Rep. 2019 Jul 5;9(1):9785. doi: 10.1038/s41598-019-46252-2. Sci Rep. 2019. PMID: 31278358 Free PMC article. - TRPC3-Based Protein Signaling Complex as a Therapeutic Target of Myocardial Atrophy.
Nishiyama K, Tanaka T, Nishimura A, Nishida M. Nishiyama K, et al. Curr Mol Pharmacol. 2021;14(2):123-131. doi: 10.2174/1874467213666200407090121. Curr Mol Pharmacol. 2021. PMID: 32264816 Review. - NOX2 interacts with podocyte TRPC6 channels and contributes to their activation by diacylglycerol: essential role of podocin in formation of this complex.
Kim EY, Anderson M, Wilson C, Hagmann H, Benzing T, Dryer SE. Kim EY, et al. Am J Physiol Cell Physiol. 2013 Nov 1;305(9):C960-71. doi: 10.1152/ajpcell.00191.2013. Epub 2013 Aug 15. Am J Physiol Cell Physiol. 2013. PMID: 23948707 - Role of TRPC3 and TRPC6 channels in the myocardial response to stretch: Linking physiology and pathophysiology.
Yamaguchi Y, Iribe G, Nishida M, Naruse K. Yamaguchi Y, et al. Prog Biophys Mol Biol. 2017 Nov;130(Pt B):264-272. doi: 10.1016/j.pbiomolbio.2017.06.010. Epub 2017 Jun 20. Prog Biophys Mol Biol. 2017. PMID: 28645743 Review.
Cited by
- Trpc6 Promotes Doxorubicin-Induced Cardiomyopathy in Male Mice With Pleiotropic Differences Between Males and Females.
Norton N, Bruno KA, Di Florio DN, Whelan ER, Hill AR, Morales-Lara AC, Mease AA, Sousou JM, Malavet JA, Dorn LE, Salomon GR, Macomb LP, Khatib S, Anastasiadis ZP, Necela BM, McGuire MM, Giresi PG, Kotha A, Beetler DJ, Weil RM, Landolfo CK, Fairweather D. Norton N, et al. Front Cardiovasc Med. 2022 Jan 13;8:757784. doi: 10.3389/fcvm.2021.757784. eCollection 2021. Front Cardiovasc Med. 2022. PMID: 35096991 Free PMC article. - Channelling the Force to Reprogram the Matrix: Mechanosensitive Ion Channels in Cardiac Fibroblasts.
Stewart L, Turner NA. Stewart L, et al. Cells. 2021 Apr 23;10(5):990. doi: 10.3390/cells10050990. Cells. 2021. PMID: 33922466 Free PMC article. Review. - TRPC Channels in Cardiac Plasticity.
Numaga-Tomita T, Nishida M. Numaga-Tomita T, et al. Cells. 2020 Feb 17;9(2):454. doi: 10.3390/cells9020454. Cells. 2020. PMID: 32079284 Free PMC article. Review. - Moderate Aerobic Training Inhibits Middle-Aged Induced Cardiac Calcineurin-NFAT Signaling by Improving TGF-ß, NPR-A, SERCA2, and TRPC6 in Wistar Rats.
Baghaiee B, Bayatmakoo R, Karimi P, Shannon Pescatello L. Baghaiee B, et al. Cell J. 2021 Dec;23(7):756-762. doi: 10.22074/cellj.2021.7531. Epub 2021 Dec 29. Cell J. 2021. PMID: 34979065 Free PMC article. - Enhanced TRPC3 transcription through AT1R/PKA/CREB signaling contributes to mitochondrial dysfunction in renal tubular epithelial cells in D-galactose-induced accelerated aging mice.
Wang B, Yu W, Zhang W, Zhang M, Niu Y, Jin X, Zhang J, Sun D, Li H, Zhang Z, Luo Q, Cheng X, Niu J, Cai G, Chen X, Chen Y. Wang B, et al. Aging Cell. 2024 Jun;23(6):e14130. doi: 10.1111/acel.14130. Epub 2024 Feb 28. Aging Cell. 2024. PMID: 38415902 Free PMC article.
References
- Zhang, M. & Shah, A. M. Reactive oxygen species in heart failure. Acute Heart Failure, 118-123 (2008).
Publication types
MeSH terms
Substances
LinkOut - more resources
Full Text Sources
Other Literature Sources
Medical
Molecular Biology Databases
Miscellaneous
