Visualization of cytosolic ribosomes on the surface of mitochondria by electron cryo-tomography - PubMed (original) (raw)
Visualization of cytosolic ribosomes on the surface of mitochondria by electron cryo-tomography
Vicki Am Gold et al. EMBO Rep. 2017 Oct.
Abstract
We employed electron cryo-tomography to visualize cytosolic ribosomes on the surface of mitochondria. Translation-arrested ribosomes reveal the clustered organization of the TOM complex, corroborating earlier reports of localized translation. Ribosomes are shown to interact specifically with the TOM complex, and nascent chain binding is crucial for ribosome recruitment and stabilization. Ribosomes are bound to the membrane in discrete clusters, often in the vicinity of the crista junctions. This interaction highlights how protein synthesis may be coupled with transport. Our work provides unique insights into the spatial organization of cytosolic ribosomes on mitochondria.
Keywords: TOM complex; electron cryo‐tomography; mitochondrial protein import; ribosomes; translation.
© 2017 The Authors. Published under the terms of the CC BY 4.0 license.
Conflict of interest statement
The authors declare that they have no conflict of interest.
Figures
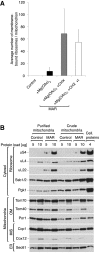
Figure 1. Mitochondria are enriched with ribosomes after CHX treatment
- A
Average number of ribosomes bound to mitochondria for control (−Mg(OAc)2 −CHX), +Mg(OAc)2 only, and two +Mg(OAc)2 +CHX (MAR) samples, from a crude isolation and iodixanol purification (+I). Data are plotted as the mean number of ribosomes ± SEM. n = 28 mitochondria, combined from > 10 independent sample preparations. - B
The steady‐state protein levels of isolated crude mitochondria are shown for control (−Mg(OAc)2 −CHX) and MAR (+Mg(OAc)2 +CHX) samples. Ribosomal proteins co‐isolate with mitochondria under ribosome‐stabilizing conditions (+Mg(OAc)2 +CHX). IMS, intermembrane space; OM, outer membrane. - C
Fractionation of MAR samples in a 0–27% iodixanol step gradient. Iodixanol gradient‐purified MAR (MAR, +I) were isolated from 15 to 21% iodixanol layers. Co‐sedimentation of a group of 80S ribosomes with mitochondria indicates their stable interaction. - D–K
Corresponding example tomographic slices for the data shown in (A). (D) Control (−Mg(OAc)2 −CHX) mitochondria are not associated with ribosomes. Scale bar, 0.2 μm. (E) Samples treated with +Mg(OAc)2 only show ribosomes (boxed) bound to mitochondria in a few cases. Scale bar, 0.3 μm. (F–H) Enlargement of the boxes shown in (E). Scale bars, 20 nm. (I) Crude preparation of a MAR (+Mg(OAc)2 +CHX) sample shows many ribosomes bound to mitochondria, but also in (J), a high background of free cytosolic ribosomes that distort accurate analysis. Scale bars, 0.2 μm and 0.1 μm, respectively. (K) Analysis of the iodixanol gradient‐purified MAR sample (MAR, +I) shows that ribosomes remain stably bound to mitochondria after centrifugation. The background level of free ribosomes and ER membranes is reduced. Scale bar, 0.2 μm.
Data information: In (B, C), samples were analyzed by SDS–PAGE followed by immunodecoration with specific antisera. ER, endoplasmic reticulum.
Figure EV1. Step gradient purification reduces cytosolic and ER contamination but does not alter ribosome content in MAR samples
- Average number of ribosomes bound to mitochondria for control (−Mg(OAc)2 −CHX), +Mg(OAc)2 only, and two MAR (+Mg(OAc)2 +CHX) samples, from a crude isolation and iodixanol purification (+I). Data are plotted as the mean number of ribosomes per mitochondrion ± SEM. n = 28 mitochondria, combined from > 10 independent sample preparations.
- The steady‐state protein levels of crude or step gradient‐purified mitochondria and MAR isolated from cells. Step gradient‐purified samples are enriched with mitochondrial marker proteins in contrast to cytosolic protein Pgk1. Cellular protein extract (4 μg) was loaded as a reference. Samples were analyzed by SDS–PAGE followed by immunodecoration with specific antisera. OM, outer membrane; IMS, intermembrane space; ER, endoplasmic reticulum.
Figure 2. Cytosolic ribosomes interact with the mitochondrial TOM translocase via the nascent chain
- A, B
Cytosolic ribosomes co‐purify with the TOM complex. (A) Immuno‐affinity purification of Tom22HIS from digitonin‐solubilized MAR. MAR were pre‐treated with 25 mM EDTA and washed before solubilization. Load 2%; eluate 100%. (B) Immuno‐affinity purification of Tom40HA from digitonin‐solubilized HMW membranes. Load 1%; eluate 100%. - C, D
Dissipation of the electrochemical inner membrane potential inhibits ribosome recruitment to the mitochondrial surface. (C) The steady‐state protein levels of HMW membranes isolated from cells that were either untreated, or treated with 10 μM CCCP for 3, 2 or 1 h prior to harvesting. Translation was inhibited with 50 μg/ml CHX for 30 min prior to harvesting. For analysis of protein levels after shorter CCCP treatment times see Fig EV2C and D. (D) Quantification of the ribosomal protein levels from samples shown in (C). The protein levels of uS4 and uL22 in MAR were set to 100%. Data are presented as the mean ± SEM. n = 3 biological replicates. - E–G
Ribosomes dissociate from mitochondria upon nascent chain release. (E) Protein levels in MAR samples upon treatment with nascent chain releasing agents: hydroxylamine and 3 mM puromycin. 25 mM EDTA was used as reference for ribosome clearance from MAR samples. (F) Quantification of the ribosomal protein levels from untreated MAR and after treatment with 1.5 M hydroxylamine shown in (E, lanes 2 and 5). The protein levels of uS4 and uL22 in untreated MAR were set to 100%. Data are presented as the mean ± SEM. n = 3 biological replicates. (G) TAP‐tag affinity purification of ribosomes from the cytoplasmic fraction after hydroxylamine treatment from the uL13TAP strain. Hydroxylamine causes nascent chain release together with chaperone Ssb1/2, without affecting 80S ribosome structure. Load 4%; elution 100%.
Data information: In (A–C, E, G), samples were analyzed by SDS–PAGE and Western blotting using specific antisera.Source data are available online for this figure.
Figure EV2. Cytosolic ribosomes are stabilized on mitochondria via the nascent chain
- A
Immuno‐affinity purification of Tom40HA from digitonin‐solubilized MAR. Protein uL22 co‐purifies with the TOM complex. Load 4%; eluate 100%. - B
The steady‐state protein level of crude mitochondria and HMW membranes indicates the presence of mitochondrial and ER membranes in both samples. Equal mass of protein (10 μg) was compared. Due to whole cell rupture, the HMW membrane fraction contains membrane proteins, but not soluble proteins, from the IMS and ER lumen. OM, outer membrane; IMS, intermembrane space; IM, inner membrane. - C, D
The steady‐state protein levels of crude mitochondria and MAR (C) or corresponding HMW membranes (D) isolated from yeast cells treated with 10 μM CCCP and 50 μg/ml CHX 30 min prior to harvest. Ribosomes are stabilized irrespective of the inner mitochondrial membrane potential. - E
[35S]‐labeled Tim9‐RNC was treated with 1.5 M hydroxylamine and analyzed by SDS–PAGE followed by autoradiography. Hydroxylamine causes polypeptide nascent chain release from RNCs. - F
Protein levels in MAR samples upon treatment with increasing concentration of hydroxylamine in SM buffer. - G
Quantification of the ribosomal protein levels from samples shown in (F). The protein levels of uS4 and uL22 in MAR were set to 100%. Data are presented as the mean ± SEM. n = 3 biological replicates. - H
Fractionation of MAR samples after incubation with 1.5 M hydroxylamine (MAR, +NH2OH) in a 0–27% iodixanol step gradient. Iodixanol gradient‐purified MAR (MAR, +NH2OH, +I) were isolated from 15 to 21% iodixanol layers. Co‐sedimentation of ribosomal markers with cytosolic protein Pgk1 indicates efficient dissociation of ribosomes from the mitochondrial outer membrane. - I
Average number of ribosomes bound to mitochondria for iodixanol‐purified MAR (MAR, +I) and hydroxylamine‐treated MAR (MAR, +NH2OH, + I) purifications. Data are presented as the mean ± SEM. n = 21 mitochondria (824 MAR, +I ribosomes from five independent sample preparations) and 126 MAR, +NH2OH, + I ribosomes from a single sample preparation).
Data information: In (A–D, F, H), samples were analyzed by SDS–PAGE and Western blotting using specific antisera. ER, endoplasmic reticulum.
Figure 3. Ribosomes form discrete clusters on mitochondria
- A
Tomographic slice showing the location of ribosomes (MAR‐M, orange arrowheads; MAR‐P, blue arrowheads), associated with a mitochondrion. Scale bar, 0.1 μm. - B
Enlargement of the box shown in (A). Scale bar, 20 nm. - C
Tomographic slice showing the arrangement of MAR‐M (orange arrowheads) and MAR‐P (blue arrowheads). Scale bar, 20 nm. - D
StA of the MAR‐M population (n = 1,215 subvolumes). The 60S subunit (yellow) and 40S subunit (orange) are shown with respect to the position of the mitochondrial membrane. The density shown within the membrane is attributable to the bilayer, not the TOM complex. - E
StA of the MAR‐P population (n = 419 subvolumes). The 60S subunit (light blue) and 40S subunit (dark blue) are shown. - F
Surface‐rendered mitochondrion as shown in (A), showing the distribution of MAR‐M and MAR‐P groups. - G
Tomographic slice showing the location of ribosomes bound to a mitochondrial outer membrane that has a partially tubular morphology. Scale bar, 0.1 μm. - H
Enlargement of the box shown in (G), showing the arrangement of MAR‐M (orange arrowheads) and MAR‐P (blue arrowheads). Scale bar, 20 nm. - I, J
Surface‐rendered mitochondrion as shown in (H), showing the MAR‐M distribution (I) and with the MAR‐P group included (J).
Figure 4. Ribosomes are orientated for import on the mitochondrial surface
- Enlargement of a MAR‐M cluster from the mitochondrion shown in Fig 3F, depicting the position of the polypeptide exit tunnel (black arrows) with respect to the mitochondrial outer membrane (transparent) and a crista junction (CJ, purple).
- A MAR‐M cluster and associated MAR‐P group are shown with respect to the mitochondrial outer membrane (transparent) and a crista junction (CJ, purple). The potential path of polysomal mRNA is shown (red).
- The steady‐state protein levels of gradient‐purified MAR (MAR, +I) upon ribonuclease A treatment shows that the amounts of ribosomal proteins and Ssb1/2 are reduced compared to the non‐digested sample. Samples were analyzed by SDS–PAGE followed by immunodecoration with specific antisera. OM, outer membrane; IMS, intermembrane space.
- Quantification of the ribosomal protein levels from untreated MAR and after treatment with ribonuclease A, as shown in (C). The protein levels of uS4, uL22, and Ssb1/2 in untreated MAR were set to 100%. Data are presented as the mean ± SEM. n = 3 biological replicates.
- Surface‐rendered mitochondrion as shown in Fig 3F, showing the distribution of MAR‐M only. The MAR‐P population is not shown.
Figure EV3. Fourier shell correlation (FSC) curves for subtomogram averages
Resolution estimates were based on conventional FSC measurements and the 0.5 criterion in IMOD. Calculations for MAR‐M (orange, 38 Å), MAR‐P (blue, 46 Å), and ER‐R (green, 44 Å) are shown.
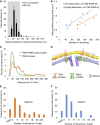
Figure 5. Ribosomes bind to mitochondria in discrete clusters near CJs
- Histogram showing closest‐neighbor distribution distances between individual ribosomes in the MAR‐M group, expressed in percent. Error bars indicate the standard deviation of the frequency distribution for each minimal distance. n = 6 mitochondria (910 ribosomes), combined from two independent sample preparations.
- Scatter plot showing the number of ribosomes (MAR‐M, orange; MAR‐P, blue) correlated with the surface area of individual mitochondria.
- Distribution plot showing the number of import sites (expressed in percent) measured for TOM‐TIM23 supercomplexes (green, n = 9 mitochondria (836 import sites)) and ribosome‐labeled TOM complexes (orange, n = 6 mitochondria (397 ribosomes)), correlated with their distance from the nearest CJ. Data are plotted as a moving average in order to reduce the appearance of short‐term fluctuations.
- Schematic showing the distribution of TOM and TIM23 complexes in the mitochondrial membranes based on data shown in (C). The mitochondrial contact site and cristae organizing system (MICOS), responsible for formation and maintenance of the crista junction, is shown with respect to the TOM and TIM23 complexes.
- Histogram showing the number of MAR‐M per cluster expressed in percent. n = 6 mitochondria (923 ribosomes), combined from two independent sample preparations.
- Histogram showing the number of MAR‐P per cluster expressed in percent. n = 6 mitochondria (532 ribosomes), combined from two independent sample preparations.
Figure EV4. Ribosomes cluster around the CJ
Histogram showing closest‐neighbor distribution distances between MAR‐M and the nearest CJ, expressed in percent. Error bars indicate the standard deviation of the frequency distribution for each minimal distance. Data are obtained from two independent sample preparations.
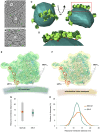
Figure 6. Ribosomes are tethered to mitochondria through the strength of the nascent chain interaction
- A, B
Reconstructed tomographic slices showing the location of ribosomes (green arrowheads) bound to rough ER membrane vesicles (marked E) that co‐purify with mitochondria (marked M). Scale bars, 20 nm. - C
Surface‐rendered rough ER membrane (sea green) showing the position of associated ER‐R (60S bright green/40S dark green). n = 230 subvolumes. - D
Enlargement of the box shown in (C). ER‐R attachment to the membrane via eS7La is shown (red). - E, F
Docked X‐ray structures show the positions of ribosomal proteins (teal) and rRNA (gray) in comparably filtered StAs of ER‐R (green) and MAR‐M (yellow) structures. eS7La (red) and eS27L in (black) are also shown. - G
Graph showing the average distance between MAR‐M and the mitochondrial outer membrane (orange) and ER‐R and the ER membrane (teal), and the corresponding variance of tethering distances (gray bars). Calculations are made from the base of the cleft between the 60S and 40S subunits. n = 15 mitochondria/tomograms (MAR‐M) and n = 11 tomograms (ER‐R), accruing 964 ribosomes in total from five independent sample preparations. - H
Distribution plot showing the number of ribosomes (expressed in percent) in MAR‐M (orange) and ER‐R (teal) data sets, correlated with their distance from the membrane. Data are plotted as a moving average in order to reduce the appearance of short‐term fluctuations.
Figure EV5. Scatter plots showing the distance between ribosomes and the mitochondrial or ER membrane
- A, B
All individual data points are plotted to demonstrate the degree of variation in the (A) MAR‐M data series or (B) the ER‐R group.
Similar articles
- Cytoplasmic ribosomes on mitochondria alter the local membrane environment for protein import.
Chang YT, Barad BA, Hamid J, Rahmani H, Zid BM, Grotjahn DA. Chang YT, et al. J Cell Biol. 2025 Apr 7;224(4):e202407110. doi: 10.1083/jcb.202407110. Epub 2025 Mar 6. J Cell Biol. 2025. PMID: 40047641 Free PMC article. - Organization of the mitochondrial translation machinery studied in situ by cryoelectron tomography.
Pfeffer S, Woellhaf MW, Herrmann JM, Förster F. Pfeffer S, et al. Nat Commun. 2015 Jan 22;6:6019. doi: 10.1038/ncomms7019. Nat Commun. 2015. PMID: 25609543 - Cryo-EM structure of the mitochondrial protein-import channel TOM complex at near-atomic resolution.
Tucker K, Park E. Tucker K, et al. Nat Struct Mol Biol. 2019 Dec;26(12):1158-1166. doi: 10.1038/s41594-019-0339-2. Epub 2019 Nov 18. Nat Struct Mol Biol. 2019. PMID: 31740857 Free PMC article. - Coupling of import and assembly pathways in mitochondrial protein biogenesis.
Grevel A, Pfanner N, Becker T. Grevel A, et al. Biol Chem. 2019 Dec 18;401(1):117-129. doi: 10.1515/hsz-2019-0310. Biol Chem. 2019. PMID: 31513529 Review. - Localized translation near the mitochondrial outer membrane: An update.
Lesnik C, Golani-Armon A, Arava Y. Lesnik C, et al. RNA Biol. 2015;12(8):801-9. doi: 10.1080/15476286.2015.1058686. RNA Biol. 2015. PMID: 26151724 Free PMC article. Review.
Cited by
- mRNA Targeting, Transport and Local Translation in Eukaryotic Cells: From the Classical View to a Diversity of New Concepts.
Lashkevich KA, Dmitriev SE. Lashkevich KA, et al. Mol Biol. 2021;55(4):507-537. doi: 10.1134/S0026893321030080. Epub 2021 May 30. Mol Biol. 2021. PMID: 34092811 Free PMC article. - Increasing the Efficiency of the Accumulation of Recombinant Proteins in Plant Cells: The Role of Transport Signal Peptides.
Rozov SM, Deineko EV. Rozov SM, et al. Plants (Basel). 2022 Sep 28;11(19):2561. doi: 10.3390/plants11192561. Plants (Basel). 2022. PMID: 36235427 Free PMC article. Review. - Molecular Determinants of Mitochondrial Shape and Function and Their Role in Glaucoma.
Khalimonchuk O, Becker DF. Khalimonchuk O, et al. Antioxid Redox Signal. 2023 May;38(13-15):896-919. doi: 10.1089/ars.2022.0124. Epub 2023 Jan 5. Antioxid Redox Signal. 2023. PMID: 36301938 Free PMC article. Review. - Dynamic interplay between RPL3- and RPL3L-containing ribosomes modulates mitochondrial activity in the mammalian heart.
Milenkovic I, Santos Vieira HG, Lucas MC, Ruiz-Orera J, Patone G, Kesteven S, Wu J, Feneley M, Espadas G, Sabidó E, Hübner N, van Heesch S, Völkers M, Novoa EM. Milenkovic I, et al. Nucleic Acids Res. 2023 Jun 23;51(11):5301-5324. doi: 10.1093/nar/gkad121. Nucleic Acids Res. 2023. PMID: 36882085 Free PMC article. - Generation of a mitochondrial protein compendium in Dictyostelium discoideum.
Freitas AV, Herb JT, Pan M, Chen Y, Gucek M, Jin T, Xu H. Freitas AV, et al. iScience. 2022 Apr 29;25(5):104332. doi: 10.1016/j.isci.2022.104332. eCollection 2022 May 20. iScience. 2022. PMID: 35602934 Free PMC article.
References
- Mahamid J, Pfeffer S, Schaffer M, Villa E, Danev R, Cuellar LK, Förster F, Hyman AA, Plitzko JM, Baumeister W (2016) Visualizing the molecular sociology at the HeLa cell nuclear periphery. Science 351: 969–972 - PubMed
- Park E, Rapoport TA (2012) Mechanisms of Sec61/SecY‐mediated protein translocation across membranes. Annu Rev Biophys 41: 21–40 - PubMed
MeSH terms
Substances
LinkOut - more resources
Full Text Sources
Other Literature Sources


