Role for the EWS domain of EWS/FLI in binding GGAA-microsatellites required for Ewing sarcoma anchorage independent growth - PubMed (original) (raw)
Role for the EWS domain of EWS/FLI in binding GGAA-microsatellites required for Ewing sarcoma anchorage independent growth
Kirsten M Johnson et al. Proc Natl Acad Sci U S A. 2017.
Abstract
Ewing sarcoma usually expresses the EWS/FLI fusion transcription factor oncoprotein. EWS/FLI regulates myriad genes required for Ewing sarcoma development. EWS/FLI binds GGAA-microsatellite sequences in vivo and in vitro. These sequences provide EWS/FLI-mediated activation to reporter constructs, suggesting that they function as EWS/FLI-response elements. We now demonstrate the critical role of an EWS/FLI-bound GGAA-microsatellite in regulation of the NR0B1 gene as well as for Ewing sarcoma proliferation and anchorage-independent growth. Clinically, genomic GGAA-microsatellites are highly variable and polymorphic. Current data suggest that there is an optimal "sweet-spot" GGAA-microsatellite length (of 18-26 GGAA repeats) that confers maximal EWS/FLI-responsiveness to target genes, but the mechanistic basis for this remains unknown. Our biochemical studies, using recombinant Δ22 (a version of EWS/FLI containing only the FLI portion), demonstrate a stoichiometry of one Δ22-monomer binding to every two consecutive GGAA-repeats on shorter microsatellite sequences. Surprisingly, the affinity for Δ22 binding to GGAA-microsatellites significantly decreased, and ultimately became unmeasureable, when the size of the microsatellite was increased to the sweet-spot length. In contrast, a fully functional EWS/FLI mutant (Mut9, which retains approximately half of the EWS portion of the fusion) showed low affinity for smaller GGAA-microsatellites but instead significantly increased its affinity at sweet-spot microsatellite lengths. Single-gene ChIP and genome-wide ChIP-sequencing (ChIP-seq) and RNA-seq studies extended these findings to the in vivo setting. Together, these data demonstrate the critical requirement of GGAA-microsatellites as EWS/FLI activating response elements in vivo and reveal an unexpected role for the EWS portion of the EWS/FLI fusion in binding to sweet-spot GGAA-microsatellites.
Keywords: EWS/FLI fusion; Ewing sarcoma; microsatellites; transcriptional activation.
Conflict of interest statement
Conflict of interest statement: S.L.L. is the Acting Chief Medical Officer of Salarius Pharmaceuticals.
Figures
Fig. 1.
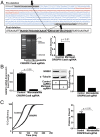
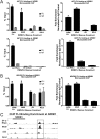
Deletion of the NR0B1 microsatellite reduces NR0B1 expression, impairs A673 cell growth, and inhibits colony formation. (A) Sequencing results validating knockout of the NR0B1 GGAA-microsatellite about 1.5 kb upstream of the NR0B1 TSS in A673 cells. The sgRNAs targeted to either side of this region are underlined. GGAA-microsatellite is highlighted red, and CRISPR/Cas9 deleted region is highlighted blue. Gel shows deletion of NR0B1 microsatellite region compared with control (nondeleted), with densitometry quantification on Right (P < 0.01). Data are represented as mean ± SEM (n = 2). (B) NR0B1 mRNA (P < 0.05) and protein expression levels in control and CRISPR/Cas9-mediated knockout of NR0B1 microsatellite in A673 Ewing sarcoma cells, with Western blot densitometry quantification on Right. Control CRISPR/Cas9 plasmids do not contain sgRNAs. Data are represented as mean ± SEM (n = 3). (C) Growth and colony formation assay quantification of CRISPR/Cas9 control vs. NR0B1 microsatellite knockout in A673 cells (P < 0.05). Data are represented as mean ± SEM (n = 3).
Fig. S1.
Sequencing results of the NR0B1 microsatellite deletion. Shown is the Sanger sequencing chromatogram of genomic DNA demonstrating deletion of the NR0B1 GGAA-microsatellite region in A673 cells.
Fig. S2.
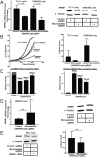
Deletion of the NR0B1 microsatellite in other cell lines. (A) NR0B1 mRNA and protein expression levels in control and CRISPR/Cas9-mediated knockout of the NR0B1 microsatellite in TC-71 and EWS/502 Ewing sarcoma cells (P < 0.05). Data are represented as mean ± SEM (n = 3). (B) Growth curves and soft agar assay quantification for NR0B1 microsatellite deletion in two other Ewing sarcoma cell lines (TC-71 cells and EWS/502 cells). Growth curve data are represented as mean ± SEM (n = 4). Control vs. CRISPR for TC-71 and EWS/502 cells are each statistically significant (P < 0.05). Soft agar data are represented as mean ± SEM (n = 2). (C) Densitometry quantification of PCR-amplified _NR0B1-_microsatellite–containing region for A673 control (wild-type _NR0B1-_microsatellite) allele vs. CRISPR-Cas9 knockout (deleted _NR0B1-_microsatellite) allele at different time points for up to 3 wk postlentiviral infection. (D) NR0B1 mRNA and protein expression levels in control and CRISPR/Cas9-mediated knockout of the NR0B1 microsatellite in non-Ewing sarcoma HEK293 cells. Data are represented as mean ± SEM (n = 3). n.s., not statistically significant. (E) NR0B1 protein levels and colony formation assay quantification for A673 cells with NR0B1 cDNA rescue in CRISPR/Cas9 control vs. microsatellite knockout. n.s., not statistically significant. Data are represented as mean ± SEM (n = 2).
Fig. 2.
Characterization of Δ22 binding on DNA sequences of increasing GGAA-microsatellite numbers. (A) Fluorescence polarization (FP) was used to determine the stoichiometry of recombinant Δ22 protein binding fluorescein-labeled DNA probes from 2 to 16 consecutive GGAA-repeats. Data represent mean of two independent experiments (each with three technical replicates) for each GGAA-repeat length. _R_2 = 0.9881. (B) FP was used to assay binding affinity of recombinant Δ22 protein bound to fluorescein-labeled oligonucleotide probes of 4–16 consecutive GGAA-motifs. KD was determined to be ∼70 nM. Data represent mean ± SEM (n = 3). (C) Summary of KD (binding affinity) determined by fluorescence anisotropy for recombinant Δ22 vs. Mut9 proteins binding to fluorescein-labeled DNA oligonucleotides of increasing GGAA-microsatellite numbers. Data represent the mean of two independent experiments for each GGAA-repeat length. _R_2 = 0.9425 and 0.8795 for Δ22 and Mut9, respectively.
Fig. S3.
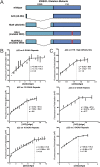
Stoichiometry of Δ22 binding on DNA sequences of increasing GGAA-microsatellite numbers. (A) Schematic of EWS/FLI constructs used in these studies. (B) Fluorescent anisotropy results of recombinant Δ22 protein binding to fluorescein-labeled DNA probes containing 8, 12, and 16 consecutive GGAA-repeats. The inflection points represent stoichiometric ratios and are indicated by dashed lines (exact values indicated on graphs as n = 3.9 for eight repeats, n = 5.8 for 12 repeats, etc.). Data are represented as mean ± SEM (n = 3). (C) Stoichiometry of recombinant Δ22 protein binding at the conserved ETS high-affinity sequence (one GGAA), two, and three consecutive GGAA-repeats to characterize minimal binding of Δ22. Dashed lines and n values on graphs represent inflection points or stoichiometric ratios. Data are represented as mean ± SEM (n = 3).
Fig. S4.
Mut9 vs. Δ22 binding at increasing GGAA-microsatellite lengths. Fluorescence anisotropy binding of recombinant (A) Δ22 or (B) Mut9 proteins on fluorescein-labeled DNA oligonucleotides containing 12 vs. 22 (sweet-spot) consecutive GGAA-repeats. Data are represented as mean ± SEM (n = 3).
Fig. S5.
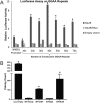
Mut9 transcriptional activation of increasing consecutive GGAA-repeats. (A) Luciferase assay results showing transcriptional activity of Mut9 and Mut9/R2L2 vs. empty vector at microsatellites of increasing GGAA-repeat numbers. Mut9-induced activity is significantly greater than Mut9/R2L2 and the empty vector control (P < 0.01) and are denoted by asterisks. Data are represented as mean ± SEM (n = 3). (B) Quantification of colony formation assays for EWS/FLI knockdown and rescue cells used in RNA-seq experiments. Data represent mean ± SD (n = 2). Paired two-tailed t tests were performed between constructs that rescue anchorage-independent growth (Luc-RNAi, EWS/FLI, and Mut9) and those that do not (iEF-2–RNAi, Δ22, and R2L2). Asterisks denote statistical significance (P < 0.05).
Fig. 3.
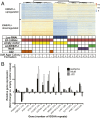
EWS/FLI-mediated differential gene expression in Mut9 vs. Δ22 rescue of EWS/FLI knockdown in A673 cells at different microsatellite lengths. (A) Heat map of hierarchical clustering of the 500 most EWS/FLI up- and down-regulated genes across cells expressing varying knockdown/rescue constructs. Each row represents one gene, and each column represents one biological sample. Values used to determine differential expression were normalized count matrices (scale represents normalized counts). (B) Results comparing differential gene expression from RNA-seq data (A) of EWS/FLI-regulated genes in the context of rescue with wild-type, Mut9, and Δ22 constructs. The number of GGAA-motifs (according to UCSC hg19 reference genome) contained in their respective gene-associated microsatellites is indicated. Data represent mean ± SD (n = 3).
Fig. S6.
Mut9 and Δ22 binding at NR0B1 microsatellite. qPCR shows binding enrichment expressed as percent input and fold-change normalized to IgG mock control at the NR0B1 microsatellite following ChIP using an antibody against FLI vs. IgG in (A) A673 cells with control (Luc-RNAi) or EWS/FLI knockdown (“iEF-2–RNAi”) rescued with the indicated EWS/FLI mutant constructs or empty vector (“EF-2–RNAi”) and (B) non-Ewing sarcoma HEK 293 EBNA cells infected with mutant EWS/FLI constructs. Data are represented as mean ± SEM (n = 3). Asterisks denote statistical significance (P < 0.05) as assessed by paired two-tailed t tests, between EWS/FLI wild-type, Mut9, and Luc-RNAi vs. iEF-2-RNAi, Δ22, and R2L2, respectively. (C) A representative example from ChIP-seq data, showing FLI binding enrichment at the NR0B1 microsatellite in EWS/FLI-depleted cells and A673 cells rescued with empty vector, Mut9, or Δ22.
Fig. 4.
Genome-wide FLI ChIP binding of Mut9 vs. Δ22. Shown is a heat map of genome-wide FLI ChIP-seq data from A673 cells with EWS/FLI knockdown vs. Mut9 or Δ22 rescue compared with input and A673 wild-type EWS/FLI cells. See SI Materials and Methods for additional supporting information.
Similar articles
- Clinical and biochemical function of polymorphic NR0B1 GGAA-microsatellites in Ewing sarcoma: a report from the Children's Oncology Group.
Monument MJ, Johnson KM, McIlvaine E, Abegglen L, Watkins WS, Jorde LB, Womer RB, Beeler N, Monovich L, Lawlor ER, Bridge JA, Schiffman JD, Krailo MD, Randall RL, Lessnick SL. Monument MJ, et al. PLoS One. 2014 Aug 5;9(8):e104378. doi: 10.1371/journal.pone.0104378. eCollection 2014. PLoS One. 2014. PMID: 25093581 Free PMC article. - Identification of two types of GGAA-microsatellites and their roles in EWS/FLI binding and gene regulation in Ewing sarcoma.
Johnson KM, Taslim C, Saund RS, Lessnick SL. Johnson KM, et al. PLoS One. 2017 Nov 1;12(11):e0186275. doi: 10.1371/journal.pone.0186275. eCollection 2017. PLoS One. 2017. PMID: 29091716 Free PMC article. - EWS-FLI1 regulates a transcriptional program in cooperation with Foxq1 in mouse Ewing sarcoma.
Shimizu R, Tanaka M, Tsutsumi S, Aburatani H, Yamazaki Y, Homme M, Kitagawa Y, Nakamura T. Shimizu R, et al. Cancer Sci. 2018 Sep;109(9):2907-2918. doi: 10.1111/cas.13710. Epub 2018 Jul 18. Cancer Sci. 2018. PMID: 29945296 Free PMC article. - Therapeutic opportunities in Ewing sarcoma: EWS-FLI inhibition via LSD1 targeting.
Theisen ER, Pishas KI, Saund RS, Lessnick SL. Theisen ER, et al. Oncotarget. 2016 Apr 5;7(14):17616-30. doi: 10.18632/oncotarget.7124. Oncotarget. 2016. PMID: 26848860 Free PMC article. Review. - Recent advances in targeted therapy for Ewing sarcoma.
Pishas KI, Lessnick SL. Pishas KI, et al. F1000Res. 2016 Aug 25;5:F1000 Faculty Rev-2077. doi: 10.12688/f1000research.8631.1. eCollection 2016. F1000Res. 2016. PMID: 27635231 Free PMC article. Review.
Cited by
- Liquid-liquid phase separation drives cellular function and dysfunction in cancer.
Mehta S, Zhang J. Mehta S, et al. Nat Rev Cancer. 2022 Apr;22(4):239-252. doi: 10.1038/s41568-022-00444-7. Epub 2022 Feb 11. Nat Rev Cancer. 2022. PMID: 35149762 Free PMC article. Review. - Molecular mechanisms underpinning sarcomas and implications for current and future therapy.
Damerell V, Pepper MS, Prince S. Damerell V, et al. Signal Transduct Target Ther. 2021 Jun 30;6(1):246. doi: 10.1038/s41392-021-00647-8. Signal Transduct Target Ther. 2021. PMID: 34188019 Free PMC article. Review. - Structure and cooperative formation of a FLI1 filament on contiguous GGAA DNA sites.
Hou C, Tsodikov OV. Hou C, et al. Nucleic Acids Res. 2025 Mar 20;53(6):gkaf205. doi: 10.1093/nar/gkaf205. Nucleic Acids Res. 2025. PMID: 40131773 Free PMC article. - Fusion protein EWS-FLI1 is incorporated into a protein granule in cells.
Ahmed NS, Harrell LM, Wieland DR, Lay MA, Thompson VF, Schwartz JC. Ahmed NS, et al. RNA. 2021 May 25;27(8):920-32. doi: 10.1261/rna.078827.121. Online ahead of print. RNA. 2021. PMID: 34035145 Free PMC article. - Mapping the Structure-Function Relationships of Disordered Oncogenic Transcription Factors Using Transcriptomic Analysis.
Showpnil IA, Miller KR, Taslim C, Pishas KI, Lessnick SL, Theisen ER. Showpnil IA, et al. J Vis Exp. 2020 Jun 27;(160):10.3791/61564. doi: 10.3791/61564. J Vis Exp. 2020. PMID: 32658189 Free PMC article.
References
- Delattre O, et al. Gene fusion with an ETS DNA-binding domain caused by chromosome translocation in human tumours. Nature. 1992;359:162–165. - PubMed
- Lessnick SL, Braun BS, Denny CT, May WA. Multiple domains mediate transformation by the Ewing’s sarcoma EWS/FLI-1 fusion gene. Oncogene. 1995;10:423–431. - PubMed
Publication types
MeSH terms
Substances
LinkOut - more resources
Full Text Sources
Other Literature Sources
Molecular Biology Databases
