Phylogeographic and genome-wide investigations of Vietnam ethnic groups reveal signatures of complex historical demographic movements - PubMed (original) (raw)
doi: 10.1038/s41598-017-12813-6.
S Pischedda 1 2 3 4, R Barral-Arca 1 2 3 4, A Gómez-Carballa 1 2 3 4, J Pardo-Seco 1 2 3 4, V Álvarez-Iglesias 1 2, J M Cárdenas 1 2 6, N D Nguyen 7, H H Ha 7, A T Le 7, F Martinón-Torres 3 4, C Vullo 5, A Salas 8 9
Affiliations
- PMID: 28974757
- PMCID: PMC5626762
- DOI: 10.1038/s41598-017-12813-6
Phylogeographic and genome-wide investigations of Vietnam ethnic groups reveal signatures of complex historical demographic movements
S Pischedda et al. Sci Rep. 2017.
Abstract
The territory of present-day Vietnam was the cradle of one of the world's earliest civilizations, and one of the first world regions to develop agriculture. We analyzed the mitochondrial DNA (mtDNA) complete control region of six ethnic groups and the mitogenomes from Vietnamese in The 1000 Genomes Project (1000G). Genome-wide data from 1000G (~55k SNPs) were also investigated to explore different demographic scenarios. All Vietnamese carry South East Asian (SEA) haplotypes, which show a moderate geographic and ethnic stratification, with the Mong constituting the most distinctive group. Two new mtDNA clades (M7b1a1f1 and F1f1) point to historical gene flow between the Vietnamese and other neighboring countries. Bayesian-based inferences indicate a time-deep and continuous population growth of Vietnamese, although with some exceptions. The dramatic population decrease experienced by the Cham 700 years ago (ya) fits well with the Nam tiến ("southern expansion") southwards from their original heartland in the Red River Delta. Autosomal SNPs consistently point to important historical gene flow within mainland SEA, and add support to a main admixture event occurring between Chinese and a southern Asian ancestral composite (mainly represented by the Malay). This admixture event occurred ~800 ya, again coinciding with the Nam tiến.
Conflict of interest statement
The authors declare that they have no competing interests.
Figures
Figure 1
(A) Frequencies of main haplogroup and sub-haplogroups by ethnic groups. (B) Map showing the location of the main Vietnamese regions analyzed in the present study. The pie charts display the frequency values for the main haplogroup categories. Maps were generated using R Project for Statistical Computing v. 3.3.1 (
) and the package autoMap v. 1.0–14 (
https://cran.r-project.org/web/packages/automap/index.html
). Packages sp v. 1.2–5, rgdal v. 1.2–8, gstat v. 1.1–5, raster v. 2.5–8 and latticeExtra v. 0.6–28 were also used to improve visual appearance of the maps.
Figure 2
(A) Interpolated geographic maps of haplotype diversity (crosses indicate sample points) and nucleotide diversity values. (B) and (C) Interpolated maps of main haplogroup frequencies across the territory of Vietnam. Maps were created as in Fig. 1.
Figure 3
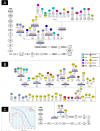
Maximum parsimony trees based on mitogenomes representing haplogroup M7b1a1f (A) and F1f (B). The revised Cambridge reference sequence (rCRS) is shown as reference for nomenclature. Genetic variants are indicated along the branches of phylogeny as follows: all of them are transitions unless a suffix A, C, G, or T indicates a transversion, and a prefix ‘@’ indicates a back mutation. As per common practice, the trees do not consider hotspot mutations at positions 16182, 16183, and 16519, nor variation around position 310 and length or point heteroplasmies. The ID numbers in the tips of the phylogeny identify mitogenomes as indicated in Table S2; this table also show details of the geographic or ethnic origin of all the samples. (C) EBSPs of haplogroup F1f and M7b1a1f obtained from complete mitogenomes. EBSPs with 95% HPD (highest posterior density) intervals are provided in Figure S3.
Figure 4
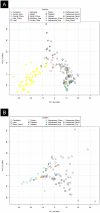
PCA of Vietnamese populations analyzed in the present article versus other Asian populations (A) and versus SEA/Southern China populations (B). Haplogroup frequencies from the reference populations were taken from Zhang et al.. Note that there are two Vietnam_Kinh samples in the plot, one represents our sample from Kinh and another one that was taken from the literature.
Figure 5
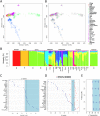
Analysis carried out on autosomal SNPs. (A) MDS of population samples from the Indochinese Peninsula and neighboring samples. Both plots were built using the same sample sets, but the one to the right aims at highlighting the center of each population sample points in order to easy interpretation (B) Admixture analysis including reference samples from Europe (CEU) and Africa (YRI). (C) Analysis of _f3_-statistics of Vietnamese (KHV) versus different neighboring population samples. (D) _D_-statistics of Vietnamese built as follows D(CHS, KHV; Y, OUTGROUP) and D(Y, KHV; CHS OUTGROUP). (E) Estimates of admixture between Chinese and Malay, using the samples CHS and Malay as subrogates of those that contributed to the present genomic architecture of present-day Vietnamese. Estimates were statistically significant according to the ad hoc z test from ALDER.
Similar articles
- Dissecting the genetic structure and admixture of four geographical Malay populations.
Deng L, Hoh BP, Lu D, Saw WY, Twee-Hee Ong R, Kasturiratne A, Janaka de Silva H, Zilfalil BA, Kato N, Wickremasinghe AR, Teo YY, Xu S. Deng L, et al. Sci Rep. 2015 Sep 23;5:14375. doi: 10.1038/srep14375. Sci Rep. 2015. PMID: 26395220 Free PMC article. - Genetic History of Xinjiang's Uyghurs Suggests Bronze Age Multiple-Way Contacts in Eurasia.
Feng Q, Lu Y, Ni X, Yuan K, Yang Y, Yang X, Liu C, Lou H, Ning Z, Wang Y, Lu D, Zhang C, Zhou Y, Shi M, Tian L, Wang X, Zhang X, Li J, Khan A, Guan Y, Tang K, Wang S, Xu S. Feng Q, et al. Mol Biol Evol. 2017 Oct 1;34(10):2572-2582. doi: 10.1093/molbev/msx177. Mol Biol Evol. 2017. PMID: 28595347 - Complete human mtDNA genome sequences from Vietnam and the phylogeography of Mainland Southeast Asia.
Duong NT, Macholdt E, Ton ND, Arias L, Schröder R, Van Phong N, Thi Bich Thuy V, Ha NH, Thi Thu Hue H, Thi Xuan N, Thi Phuong Oanh K, Hien LTT, Hoang NH, Pakendorf B, Stoneking M, Van Hai N. Duong NT, et al. Sci Rep. 2018 Aug 3;8(1):11651. doi: 10.1038/s41598-018-29989-0. Sci Rep. 2018. PMID: 30076323 Free PMC article. - Indian signatures in the westernmost edge of the European Romani diaspora: new insight from mitogenomes.
Gómez-Carballa A, Pardo-Seco J, Fachal L, Vega A, Cebey M, Martinón-Torres N, Martinón-Torres F, Salas A. Gómez-Carballa A, et al. PLoS One. 2013 Oct 15;8(10):e75397. doi: 10.1371/journal.pone.0075397. eCollection 2013. PLoS One. 2013. PMID: 24143169 Free PMC article. - Origin of ethnic groups, linguistic families, and civilizations in China viewed from the Y chromosome.
Yu X, Li H. Yu X, et al. Mol Genet Genomics. 2021 Jul;296(4):783-797. doi: 10.1007/s00438-021-01794-x. Epub 2021 May 26. Mol Genet Genomics. 2021. PMID: 34037863 Review.
Cited by
- Under the name of "Lua": revisiting genetic heterogeneity and population ancestry of Austroasiatic speakers in northern Thailand through genomic analysis.
Kampuansai J, Seetaraso T, Dansawan M, Sathupak S, Kutanan W, Srikummool M, Inta A. Kampuansai J, et al. BMC Genomics. 2024 Oct 14;25(1):956. doi: 10.1186/s12864-024-10865-3. BMC Genomics. 2024. PMID: 39402436 Free PMC article. - Genetic diversity and ancestry of the Khmuic-speaking ethnic groups in Thailand: a genome-wide perspective.
Kampuansai J, Wongkomonched R, Kutanan W, Srikummool M, Seetaraso T, Sathupak S, Thongkumkoon P, Sangphukieo A. Kampuansai J, et al. Sci Rep. 2023 Sep 21;13(1):15710. doi: 10.1038/s41598-023-43060-7. Sci Rep. 2023. PMID: 37735611 Free PMC article. - The Analysis of Genetic Polymorphism on Mitochondrial Hypervariable Region III in Thai Population.
Vanichanukulyakit J, Khacha-Ananda S, Monum T, Mahawong P, Moophayak K, Penkhrue W, Khumpook T, Thongsahuan S. Vanichanukulyakit J, et al. Genes (Basel). 2023 Mar 9;14(3):682. doi: 10.3390/genes14030682. Genes (Basel). 2023. PMID: 36980954 Free PMC article. - The endemic Helicobacter pylori population in Southern Vietnam has both South East Asian and European origins.
Nguyen TH, Ho TTM, Nguyen-Hoang TP, Qumar S, Pham TTD, Bui QN, Bulach D, Nguyen TV, Rahman M. Nguyen TH, et al. Gut Pathog. 2021 Sep 30;13(1):57. doi: 10.1186/s13099-021-00452-2. Gut Pathog. 2021. PMID: 34593031 Free PMC article. - Genotypes of informative loci from 1000 Genomes data allude evolution and mixing of human populations.
Padakanti S, Tiong KL, Chen YB, Yeang CH. Padakanti S, et al. Sci Rep. 2021 Sep 7;11(1):17741. doi: 10.1038/s41598-021-97129-2. Sci Rep. 2021. PMID: 34493766 Free PMC article.
References
- Hall, G. & Patrinos, H. A. Indigenous peoples, poverty, and development. 304–343 (Cambridge University Press, 2012).
- Harris, D. R. The origins and spread of agriculture and pastoralism in Eurasia: an overview. In: Harris, D. R., editor. The origins and spread of agriculture and pastoralism in Eurasia. 552–573 (UCL Press, 1996).
Publication types
MeSH terms
LinkOut - more resources
Full Text Sources
Other Literature Sources


