NKL homeobox gene MSX1 acts like a tumor suppressor in NK-cell leukemia - PubMed (original) (raw)
NKL homeobox gene MSX1 acts like a tumor suppressor in NK-cell leukemia
Stefan Nagel et al. Oncotarget. 2017.
Abstract
NKL homeobox gene MSX1 is physiologically expressed in lymphoid progenitors and subsequently downregulated in developing T- and B-cells. In contrast, elevated expression levels of MSX1 persist in mature natural killer (NK)-cells, indicating a functional role in this compartment. While T-cell acute lymphoblastic leukemia (T-ALL) subsets exhibit aberrant overexpression of MSX1, we show here that in malignant NK-cells the level of MSX1 transcripts is aberrantly downregulated. Chromosomal deletions at 4p16 hosting the MSX1 locus have been described in NK-cell leukemia patients. However, NK-cell lines analyzed here showed normal MSX1 gene configurations, indicating that this aberration might be uncommon. To identify alternative MSX1 regulatory mechanisms we compared expression profiling data of primary normal NK-cells and malignant NK-cell lines. This procedure revealed several deregulated genes including overexpressed IRF4, MIR155HG and MIR17HG and downregulated AUTS2, EP300, GATA3 and HHEX. As shown recently, chromatin-modulator AUTS2 is overexpressed in T-ALL subsets where it mediates aberrant transcriptional activation of MSX1. Here, our data demonstrate that in malignant NK-cell lines AUTS2 performed MSX1 activation as well, but in accordance with downregulated MSX1 transcription therein we detected reduced AUTS2 expression, a small genomic deletion at 7q11 removing exons 3 and 4, and truncating mutations in exon 1. Moreover, genomic profiling and chromosomal analyses of NK-cell lines demonstrated amplification of IRF4 at 6p25 and deletion of PRDM1 at 6q21, highlighting their potential oncogenic impact. Functional analyses performed via knockdown or forced expression of these genes revealed regulatory network disturbances effecting downregulation of MSX1 which may underlie malignant development in NK-cells.
Keywords: NKL-code; T-ALL; homeobox.
Conflict of interest statement
CONFLICTS OF INTEREST The authors declare they have no known conflicts of interest in this work.
Figures
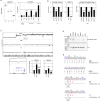
Figure 1. MSX1 in NK-cells
(A) Expression profiling data for MSX1 of CD56+ NK-cells, CD4+ T-cells, CD8+ T-cells and CD19+ B-cells obtained from dataset GSE72642 are depicted in a boxplot. The expression level in NK-cells is significantly higher when compared to the other lymphocytes (p=0.040, Mann-Whitney U Test). (B) RQ-PCR analysis of MSX1 expression in samples of primary NK-cells of two different donors and of HSCs, and in 6 NK-cell lines, 5 T-cell lines and 5 B-cell lines. Data demonstrate aberrantly reduced MSX1 levels in malignant NK-cells. The values and statistics are given in relation to primary NK-cells. (C) Expression data for MSX1 of 4 NK-cell lines and 19 primary NK/T-cell lymphoma patient samples (GSE19067). The data show no significant statistical difference, indicating similar expression levels. (D) Copy number analysis of the MSX1 locus in NK-cell lines NK-92, NKL and YT by genomic profiling (left). Please note, NK-92 possesses a hypo-tetraploid karyotype, therefore, elevated copy numbers at 4p16 reflects the whole genome of this cell line. Copy number analysis of the MSX1 locus was performed in comparison to the control-locus of MEF2C at 5q14 in NK-cell lines by RQ-PCR (right). (E) Quantification of MSX1 transcription by RQ-PCR after treatment of NK-cell lines NK-92 and YT with BMP4, demonstrating an inhibitory impact of BMP-signalling on MSX1 expression.
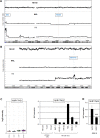
Figure 2. Analysis of AUTS2 in NK-cell lines
(A) Expression profiling data for AUTS2 of CD56+ NK-cells, CD4+ T-cells, CD8+ T-cells and CD19+ B-cells obtained from dataset GSE72642 are depicted as a boxplot (left). RQ-PCR analysis of AUTS2 expression in primary NK-cells and T-cells and 5 NK-cell lines and T-cell line LOUCY which has been shown to express aberrantly enhanced AUTS2 (right). The values and statistics are given in relation to primary NK-cells. (B) RQ-PCR analysis of MSX1 expression after siRNA-mediated knockdown of AUTS2 in YT cells (left), after forced expression of PCGF5 (middle), and RQ-PCR analysis of AUTS2 and MSX1 expression after siRNA-mediated knockdown of STAT5A in NKL cells (right). (C) Copy number analysis of the AUTS2 locus in NK-cell lines by genomic profiling (above) and RQ-PCR (below). Data indicate a small deletion targeting exons 3 and 4 of AUTS2 in YT cells. RQ-PCR data indicate genomic deletion of exon 3 in KHYG-1 cells as well. (D) RT-PCR analysis of AUTS2 exons 1 to 5 (above) and of YY1 for control (below). Note an additional smaller PCR product in KHYG-1 and YT cells. (E) Sequence analysis of RT-PCR products revealed particular AUTS2 mutations in the NK-cell lines IMC-1, KHYG-1, NKL and YT.
Figure 3. Genomic aberrations at chromosomes 6 and 13 in NK-cell lines
(A) Copy number analysis by genomic profiling of NK-cell lines NK-92, NKL and YT revealed aberrations at chromosome 6 in NKL and YT. Conspicuous loci are highlighted, including amplification of IRF4 at 6p25 and deletion of PRDM1 at 6q21. Of note, NK-92 is a hypo-tetraploid cell line. (B) Genomic profiling of NK-cell lines NK-92, NKL and YT revealed an amplicon in YT containing the locus for MIR17HG at 13q31. (C) Expression profiling data for MIR17HG of CD56+ NK-cells, CD4+ T-cells, CD8+ T-cells and CD19+ B-cells obtained from dataset GSE72642 are depicted in a boxplot (left). RQ-PCR analysis of MIR17HG expression in primary NK-, T- and B-cells and 6 NK-cell lines (right). (D) Forced expression of MSX1 in SNK-6 cells resulted in reduced expression of MIR17HG.
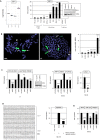
Figure 4. Analysis of PRDM1: expression, genomics and target gene regulation
(A) Expression profiling data for PRDM1 of CD56+ NK-cells, CD4+ T-cells, CD8+ T-cells and CD19+ B-cells obtained from dataset GSE72642 are depicted in a boxplot. (B) FISH analysis of the PRDM1 locus in NKL (left) and YT cells (right). The PRDM1 probe was labelled green (appearing yellow) and the probe for the whole chromosome 6 red. PRDM1 loci are indicated by an arrow. Both cell lines exhibit a loss of one PRDM1 allele at 6q21. (C) Copy number analysis of the PRDM1 locus in NK-cell lines by RQ-PCR indicates a loss of PRDM1 in KHYG-1, NKL, SNK-6 and YT but not in IMC-1 and NK-92. The values and statistics are given in relation to IMC-1. (D) RQ-PCR analysis of PRDM1 expression in primary NK- and T-cells and six NK-cell lines revealed suppressed transcript levels in malignant NK-cells. The values and statistics are given in relation to primary NK-cells. (E) RQ-PCR analysis of PRDM1, MSX1 and AUTS2 expression after siRNA-mediated knockdown of PRDM1 in NK-92 cells (left), and RQ-PCR analysis of PRDM1 and MSX1 expression after siRNA-mediated knockdown of PRDM1 in YT cells (middle). RQ-PCR analysis of MSX1 expression after forced expression of PRDM1 in YT cells (left). The data indicate that PRDM1 activates MSX1 transcription.
Figure 5. Analysis of IRF4: expression, genomics and target gene regulation
(A) Expression profiling data for IRF4 of CD56+ NK-cells, CD4+ T-cells, CD8+ T-cells and CD19+ B-cells obtained from dataset GSE72642 are depicted in a boxplot (left). RQ-PCR analysis of IRF4 expression in primary NK- and T-cells and 6 NK-cell lines revealed enhanced transcript levels in NK-cell lines NK-92, NKL, SNK-6 and YT (right). The values and statistics are given in relation to primary NK-cells. Western blot analysis demonstrates elevated IRF4 expression at the protein level in NK-92 and YT cells (insert), correlating with transcription data. T-cell lines JURKAT and LOUCY served as controls. (B) FISH analysis in NKL (left) and YT (middle), demonstrating amplification and translocation of the IFR4 locus. The IRF4 probe was labelled red and the probe for the whole chromosome 6 was labelled green. Arrows indicate normal IRF4 loci and arrowheads translocated/amplified IRF4 loci. Copy number analysis of the IRF4 locus in NK-cell lines was performed by RQ-PCR (right). (C) RQ-PCR analysis of IRF4, MSX1, AUTS2 and PRDM1 expression after siRNA-mediated knockdown of IRF4 in YT cells (left) and in NK-92 cells (middle). Knockdown of IRF4 expression was additionally shown at the protein level by Western blot in YT cells (box). Forced expression of IRF4 in NK-92 cells resulted in repression of MSX1 as analyzed by RQ-PCR (right). (D) Reporter gene assay of the intronic MSX1 region (left) indicates direct regulation of MSX1 by IRF4 demonstrating the repressive activity in NIH-3T3 cells (right). (E) RQ-PCR analysis of IRF4, MIR155HG, and PRDM1 expression after siRNA-mediated knockdown of IRF4 in NK-92 cells.
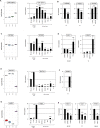
Figure 6. Analysis of MIR155HG, EP300, GATA3 and HHEX
(A) Expression profiling data for MIR155HG of CD56+ NK-cells, CD4+ T-cells, CD8+ T-cells and CD19+ B-cells obtained from dataset GSE72642 are depicted in a boxplot (left). RQ-PCR analysis of MIR155HG expression in primary NK- and T-cells and five NK-cell lines (right). The values and statistics are given in relation to primary NK-cells. (B) RQ-PCR analysis of JARID2, PRDM1 and AUTS2 expression in YT cells after transfection with a microRNA-mimic for miR155 shows an inhibitory impact of miR155 on JARID2 and PRDM1 but not on AUTS2. (C) Expression profiling data for EP300 of CD56+ NK-cells, CD4+ T-cells, CD8+ T-cells and CD19+ B-cells obtained from dataset GSE72642 are depicted in a boxplot (left). RQ-PCR analysis of EP300 expression in primary NK- and T-cells and 5 NK-cell lines (right). The values and statistics are given in relation to primary NK-cells. (D) RQ-PCR analysis of MSX1 after treatment of NK-92 cells (left) and YT cells (right) with histone acetyltransferase inhibitor ICBP112 and histone deacetylase inhibitor TSA. The values and statistics are given in relation to the DMSO-control. (E) Expression profiling data for GATA3 of CD56+ NK-cells, CD4+ T-cells, CD8+ T-cells and CD19+ B-cells obtained from dataset GSE72642 are depicted in a boxplot (left). RQ-PCR analysis of GATA3 expression in primary NK- and T-cells and six NK-cell lines (right). The values and statistics are given in relation to primary NK-cells. (F) RQ-PCR analysis of HHEX after forced expression of GATA3 in NK-92 cells showing induction of HHEX expression. (G) Expression profiling data for HHEX of CD56+ NK-cells, CD4+ T-cells, CD8+ T-cells and CD19+ B-cells obtained from dataset GSE72642 are depicted in a boxplot (left). RQ-PCR analysis of HHEX expression in primary NK- and T-cells and six NK-cell lines (right). The values and statistics are given in relation to primary NK-cells. (H) RQ-PCR analysis of MSX1 after forced expression of GATA3 and HHEX in NK-92 and YT cells (left and middle), and of HHEX after forced expression of MSX1 in SNK-6 cells (right).
Figure 7. Deregulated gene regulatory network in NK-cell leukemia
This figure summarizes the results obtained in this study. NKL homeobox gene MSX1 represents a TS in NK-cell malignancies, mediates NK-cell differentiation and inhibits T-cell differentiation as described previously [35]. Deletions at 4p16 which might target the MSX1 locus have been described in NK-cell leukemia patients [11, 13]. Aberrantly expressed upstream factors involved in MSX1 deregulation include IL7R, AUTS2, IRF4, MIR155HG and PRDM1. Deregulated MIR17HG has been described to suppress apoptosis in T-cells [23]. Overexpressed genes are indicated in red, downregulated genes in green.
Similar articles
- Deregulated expression of NKL homeobox genes in T-cell lymphomas.
Nagel S, Pommerenke C, MacLeod RAF, Meyer C, Kaufmann M, Fähnrich S, Drexler HG. Nagel S, et al. Oncotarget. 2019 May 14;10(35):3227-3247. doi: 10.18632/oncotarget.26929. eCollection 2019 May 14. Oncotarget. 2019. PMID: 31143370 Free PMC article. - NKL homeobox gene NKX2-2 is aberrantly expressed in Hodgkin lymphoma.
Nagel S, MacLeod RAF, Pommerenke C, Meyer C, Kaufmann M, Drexler HG. Nagel S, et al. Oncotarget. 2018 Dec 25;9(101):37480-37496. doi: 10.18632/oncotarget.26459. eCollection 2018 Dec 25. Oncotarget. 2018. PMID: 30680064 Free PMC article. - Repressed BMP signaling reactivates NKL homeobox gene MSX1 in a T-ALL subset.
Nagel S, Ehrentraut S, Meyer C, Kaufmann M, Drexler HG, MacLeod RA. Nagel S, et al. Leuk Lymphoma. 2015 Feb;56(2):480-91. doi: 10.3109/10428194.2014.924119. Epub 2014 Jun 12. Leuk Lymphoma. 2015. PMID: 24844359 - Deregulated NKL Homeobox Genes in B-Cell Lymphoma.
Nagel S, Drexler HG. Nagel S, et al. Cancers (Basel). 2019 Nov 26;11(12):1874. doi: 10.3390/cancers11121874. Cancers (Basel). 2019. PMID: 31779217 Free PMC article. Review. - The Role of NKL Homeobox Genes in T-Cell Malignancies.
Nagel S. Nagel S. Biomedicines. 2021 Nov 12;9(11):1676. doi: 10.3390/biomedicines9111676. Biomedicines. 2021. PMID: 34829904 Free PMC article. Review.
Cited by
- The LL-100 panel: 100 cell lines for blood cancer studies.
Quentmeier H, Pommerenke C, Dirks WG, Eberth S, Koeppel M, MacLeod RAF, Nagel S, Steube K, Uphoff CC, Drexler HG. Quentmeier H, et al. Sci Rep. 2019 Jun 3;9(1):8218. doi: 10.1038/s41598-019-44491-x. Sci Rep. 2019. PMID: 31160637 Free PMC article. - NKL-Code in Normal and Aberrant Hematopoiesis.
Nagel S. Nagel S. Cancers (Basel). 2021 Apr 19;13(8):1961. doi: 10.3390/cancers13081961. Cancers (Basel). 2021. PMID: 33921702 Free PMC article. Review. - Aberrant expression of NKL homeobox gene HLX in Hodgkin lymphoma.
Nagel S, Pommerenke C, Meyer C, Kaufmann M, MacLeod RAF, Drexler HG. Nagel S, et al. Oncotarget. 2018 Feb 16;9(18):14338-14353. doi: 10.18632/oncotarget.24512. eCollection 2018 Mar 6. Oncotarget. 2018. PMID: 29581848 Free PMC article. - A narrative review of the roles of muscle segment homeobox transcription factor family in cancer.
Liu C, Huang M, Han C, Li H, Wang J, Huang Y, Chen Y, Zhu J, Fu G, Yu H, Lei Z, Chu X. Liu C, et al. Ann Transl Med. 2021 May;9(9):810. doi: 10.21037/atm-21-220. Ann Transl Med. 2021. PMID: 34268423 Free PMC article. Review. - The NKL-code for innate lymphoid cells reveals deregulated expression of NKL homeobox genes HHEX and HLX in anaplastic large cell lymphoma (ALCL).
Nagel S, Pommerenke C, MacLeod RAF, Meyer C, Kaufmann M, Drexler HG. Nagel S, et al. Oncotarget. 2020 Aug 25;11(34):3208-3226. doi: 10.18632/oncotarget.27683. eCollection 2020 Aug 25. Oncotarget. 2020. PMID: 32922661 Free PMC article.
References
- Huntington ND, Vosshenrich CA, Di Santo JP. Developmental pathways that generate natural-killer-cell diversity in mice and humans. Nat Rev Immunol. 2007(7):703–714. - PubMed
- De Obaldia ME, Bhandoola A. Transcriptional regulation of innate and adaptive lymphocyte lineages. Annu Rev Immunol. 2015(33):607–642. - PubMed
LinkOut - more resources
Full Text Sources
Other Literature Sources
Research Materials
Miscellaneous


