Optimization of Experimental Parameters in Data-Independent Mass Spectrometry Significantly Increases Depth and Reproducibility of Results - PubMed (original) (raw)
Optimization of Experimental Parameters in Data-Independent Mass Spectrometry Significantly Increases Depth and Reproducibility of Results
Roland Bruderer et al. Mol Cell Proteomics. 2017 Dec.
Abstract
Comprehensive, reproducible and precise analysis of large sample cohorts is one of the key objectives of quantitative proteomics. Here, we present an implementation of data-independent acquisition using its parallel acquisition nature that surpasses the limitation of serial MS2 acquisition of data-dependent acquisition on a quadrupole ultra-high field Orbitrap mass spectrometer. In deep single shot data-independent acquisition, we identified and quantified 6,383 proteins in human cell lines using 2-or-more peptides/protein and over 7100 proteins when including the 717 proteins that were identified on the basis of a single peptide sequence. 7739 proteins were identified in mouse tissues using 2-or-more peptides/protein and 8121 when including the 382 proteins that were identified based on a single peptide sequence. Missing values for proteins were within 0.3 to 2.1% and median coefficients of variation of 4.7 to 6.2% among technical triplicates. In very complex mixtures, we could quantify 10,780 proteins and 12,192 proteins when including the 1412 proteins that were identified based on a single peptide sequence. Using this optimized DIA, we investigated large-protein networks before and after the critical period for whisker experience-induced synaptic strength in the murine somatosensory cortex 1-barrel field. This work shows that parallel mass spectrometry enables proteome profiling for discovery with high coverage, reproducibility, precision and scalability.
© 2017 by The American Society for Biochemistry and Molecular Biology, Inc.
Conflict of interest statement
Competing financial interests: The authors R.B., T.G., O.M.B., and L.R. are employees of Biognosys AG (Zurich, Switzerland). Spectronaut is a trademark of Biognosys AG
Figures
Fig. 1.
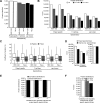
Systematic optimization of the DIA method on a Q Exactive HF instrument using a HeLa lysate and 2 h gradients. Triplicate analyses of HeLa digest for DIA method development were performed. A, Illustration of the relationship of data points per peak and number of DIA-MS2 segments at constant MS1 and MS2 resolutions. Relative axes were used. B, The average identifications of triplicate DIA and the number of peptides with CVs below defined thresholds were calculated. C, Illustration of the relationship of the number of DIA-MS2 segments at different MS1 resolutions maintaining a constant cycle time. Relative axes were used. D, The average identifications of triplicate DIA and the number of peptides with CVs below defined thresholds were calculated. E, Illustration of the relationship of the number DIA-MS2 segments at different MS2 resolutions maintaining a constant cycle time. Relative axes were used. F, The average identifications of triplicate DIA and the number of peptides with CVs below defined thresholds were calculated. The error bars display the standard deviations. The asterisk indicates the highest number of peptides with CVs below 20%.
Fig. 2.
Parallel acquisition and targeted identification of DIA surpasses serial MS2 acquisition of DDA on the Q Exactive HF. A, The identifications and MS2 spectrum acquisitions were compared at different gradient lengths for a HeLa lysate. The DIA method was optimized for different gradient lengths (red). The theoretical maximal number of MS2 spectra was calculated for a Top15 method (gray, see Methods section). For DDA, empirically derived MS2 spectra (light blue) and number of identifications (dark blue). Additionally, the DDA identifications are shown from Scheltema et al. (orange) B, A mixed-organism sample was recorded in DIA mode and DDA using a 4h gradient. The peptide and stripped sequence identifications of the DIA single shots were calculated. C, The protein identifications were calculated for the mixed-organism acquisitions.
Fig. 3.
Controlled quantitative experiment. Box plot visualization of percent change (based on MS1 and MS2 quantification for DIA and MS1 for DDA) of all identified proteins of the low fold change two sample mixed proteome experiment (comparison S2/S1 for H. sapiens, C. elegans and S. cerevisiae and S1/S2 for E. coli). Only overlapping identifications are shown. The theoretical fold changes are indicated for the organisms.
Fig. 4.
4 h single shot maximized DIA on 1 m column setup. A, Triplicate DIA of HeLa and HEK-293 lysates were recorded using a 1 m x 75 μm column with Reprosil Pur chromatography with 4 μg loading using a 4 h gradient. The targeted analysis of the DIA was performed using three spectral libraries: a project specific, a library generated from the MS data of the published repository (11 common cell lines, see methods) and the pan human spectral library of Rosenberger et al. The average protein identifications were calculated. B, The average peptide identifications of a DIA triplicate analysis of HeLa and the number of peptides with CVs below defined thresholds were calculated. C, The CVs on peptide and protein level were calculated for the three analyses. Lowest median indicated by the dotted line (HEK-293 project specific). D, Triplicate DIAs was performed using a mouse cerebellum lysate and targeted analysis was performed using a project specific and a spectral library generated from the MS data of a published repository (see Methods section). Average identifications were calculated. E, The cumulative and shared identifications were calculated for the project specific library analysis. F, The average identifications of triplicate DIA and the number of proteins with CVs below defined thresholds were calculated. The error bars display the standard deviations.
Fig. 5.
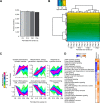
S1BF sensory development proteome profiling. A, Four important stages of sensory development of the mouse perinatal period were profiled in the S1BF using block randomized DIA and a project specific spectral library. The average protein identifications were plotted for the individual developmental stages with standard deviations. B, For exploratory data analysis, a heat map based on normalized intensities was generated using unsupervised clustering. C, Fuzzy c-means clustering analysis was performed and visualized with enriched GO terms. The black line in the membership bar shows the threshold above which proteins belong to the cluster. D, IPA Pathway activation comparison of the S1BF with normal sensory development and a study with sensory deprivation by postnatal bilateral whisker trimming (Butko et al.). Blue color indicates pathway inactivation and orange depicts its activation.
Similar articles
- An IonStar Experimental Strategy for MS1 Ion Current-Based Quantification Using Ultrahigh-Field Orbitrap: Reproducible, In-Depth, and Accurate Protein Measurement in Large Cohorts.
Shen X, Shen S, Li J, Hu Q, Nie L, Tu C, Wang X, Orsburn B, Wang J, Qu J. Shen X, et al. J Proteome Res. 2017 Jul 7;16(7):2445-2456. doi: 10.1021/acs.jproteome.7b00061. Epub 2017 May 25. J Proteome Res. 2017. PMID: 28412812 Free PMC article. - Rapid and deep proteomes by faster sequencing on a benchtop quadrupole ultra-high-field Orbitrap mass spectrometer.
Kelstrup CD, Jersie-Christensen RR, Batth TS, Arrey TN, Kuehn A, Kellmann M, Olsen JV. Kelstrup CD, et al. J Proteome Res. 2014 Dec 5;13(12):6187-95. doi: 10.1021/pr500985w. Epub 2014 Nov 10. J Proteome Res. 2014. PMID: 25349961 - Synergistic optimization of Liquid Chromatography and Mass Spectrometry parameters on Orbitrap Tribrid mass spectrometer for high efficient data-dependent proteomics.
Huang P, Liu C, Gao W, Chu B, Cai Z, Tian R. Huang P, et al. J Mass Spectrom. 2021 Apr;56(4):e4653. doi: 10.1002/jms.4653. Epub 2020 Sep 13. J Mass Spectrom. 2021. PMID: 32924238 - Multiplexed and data-independent tandem mass spectrometry for global proteome profiling.
Chapman JD, Goodlett DR, Masselon CD. Chapman JD, et al. Mass Spectrom Rev. 2014 Nov-Dec;33(6):452-70. doi: 10.1002/mas.21400. Epub 2013 Nov 26. Mass Spectrom Rev. 2014. PMID: 24281846 Review. - Quantitative liquid chromatography tandem mass spectrometry analysis of macromolecules using signature peptides in biological fluids.
Halquist MS, Thomas Karnes H. Halquist MS, et al. Biomed Chromatogr. 2011 Jan;25(1-2):47-58. doi: 10.1002/bmc.1545. Epub 2010 Dec 10. Biomed Chromatogr. 2011. PMID: 21154882 Review.
Cited by
- Systems biology reveals anatabine to be an NRF2 activator.
Messinis DE, Poussin C, Latino DARS, Eb-Levadoux Y, Dulize R, Peric D, Guedj E, Titz B, Ivanov NV, Peitsch MC, Hoeng J. Messinis DE, et al. Front Pharmacol. 2022 Nov 16;13:1011184. doi: 10.3389/fphar.2022.1011184. eCollection 2022. Front Pharmacol. 2022. PMID: 36467029 Free PMC article. - Sirt2 Regulates Liver Metabolism in a Sex-Specific Manner.
Schmidt AV, Bharathi SS, Solo KJ, Bons J, Rose JP, Schilling B, Goetzman ES. Schmidt AV, et al. Biomolecules. 2024 Sep 15;14(9):1160. doi: 10.3390/biom14091160. Biomolecules. 2024. PMID: 39334926 Free PMC article. - Phosphoproteomic analysis of metformin signaling in colorectal cancer cells elucidates mechanism of action and potential therapeutic opportunities.
Salovska B, Gao E, Müller-Dott S, Li W, Cordon CC, Wang S, Dugourd A, Rosenberger G, Saez-Rodriguez J, Liu Y. Salovska B, et al. Clin Transl Med. 2023 Feb;13(2):e1179. doi: 10.1002/ctm2.1179. Clin Transl Med. 2023. PMID: 36781298 Free PMC article. - Region-Resolved Quantitative Proteome Profiling Reveals Molecular Dynamics Associated With Chronic Pain in the PNS and Spinal Cord.
Barry AM, Sondermann JR, Sondermann JH, Gomez-Varela D, Schmidt M. Barry AM, et al. Front Mol Neurosci. 2018 Aug 14;11:259. doi: 10.3389/fnmol.2018.00259. eCollection 2018. Front Mol Neurosci. 2018. PMID: 30154697 Free PMC article. - Prediction of LC-MS/MS Properties of Peptides from Sequence by Deep Learning.
Guan S, Moran MF, Ma B. Guan S, et al. Mol Cell Proteomics. 2019 Oct;18(10):2099-2107. doi: 10.1074/mcp.TIR119.001412. Epub 2019 Jun 27. Mol Cell Proteomics. 2019. PMID: 31249099 Free PMC article.
References
- Aebersold R., and Mann M. (2003) Mass spectrometry-based proteomics. Nature 422, 198–207 - PubMed
MeSH terms
Substances
LinkOut - more resources
Full Text Sources
Other Literature Sources
Molecular Biology Databases


