PARP1-produced poly-ADP-ribose causes the PARP12 translocation to stress granules and impairment of Golgi complex functions - PubMed (original) (raw)
PARP1-produced poly-ADP-ribose causes the PARP12 translocation to stress granules and impairment of Golgi complex functions
Giuliana Catara et al. Sci Rep. 2017.
Abstract
Poly-ADP-ribose-polymerases (PARPs) 1 and 2 are nuclear enzymes that catalyze the poly-ADP-ribosylation of nuclear proteins transferring poly-ADP-ribose (PAR) polymers to specific residues. PARPs and PAR intervene in diverse functions, including DNA repair in the nucleus and stress granule assembly in the cytoplasm. Stress granules contribute to the regulation of translation by clustering and stabilizing mRNAs as well as several cytosolic PARPs and signaling proteins to modulate cell metabolism and survival. Our study is focused on one of these PARPs, PARP12, a Golgi-localized mono-ADP-ribosyltransferase that under stress challenge reversibly translocates from the Golgi complex to stress granules. PARP1 activation and release of nuclear PAR drive this translocation by direct PAR binding to the PARP12-WWE domain. Thus, PAR formation functionally links the activity of the nuclear and cytosolic PARPs during stress response, determining the release of PARP12 from the Golgi complex and the disassembly of the Golgi membranes, followed by a block in anterograde-membrane traffic. Notably, these functions can be rescued by reverting the stress condition (by drug wash-out). Altogether these data point at a novel, reversible nuclear signaling that senses stress to then act on cytosolic PARP12, which in turn converts the stress response into a reversible block in intracellular-membrane traffic.
Conflict of interest statement
The authors declare that they have no competing interests.
Figures
Figure 1
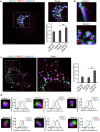
PARP12 is a _trans_-Golgi localized protein. (a) Representative confocal microscopy images of HeLa cells untreated (a,b) or treated with Nocodazole (33 μM, 3 h) (c,d), fixed and labeled with anti-PARP12 (red), anti-GM130 (a _cis_-Golgi marker, green) and anti-Golgin-97 (a TGN-Golgi marker, blue) antibodies. (a) Zoom: enlarged view of Golgi area. Quantification of Manders’ colocalization coefficient (MCC) of PARP12/GM130, PARP12/Golgin-97 and GM130/Golgin-97 (as internal control) are shown in the graph. Data are mean ± SD from n = 20. Statistical significance was calculated by unpaired Student’s _t_-test; ***p < 0.001. (b) Zoom 1 and 2: higher magnification images of Golgi area shown in a. (c) Clear separation of GM130 (green) and Golgin-97 (blue) markers in ministacks under Nocodazole treatment. Zoom: enlarged view of ministacks. Far right graph: quantification of Manders’ colocalization coefficient (MCC) under Nocodazole treatment. Data are mean ± SD from n = 20. Statistical significance was calculated by unpaired Student’s _t_-test; ***p < 0.001. (d) Zoom 1–6: enlarged view of single isolated mini stacks numbered in c. White arrow across the stack was used for line-scan analyses and the fluorescence intensity distribution of markers along this line was quantified and normalized to their respective peak values. The images shown are representative of three independent experiments. Scale bars, 10 μm.
Figure 2
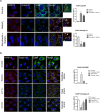
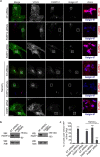
Redistribution of PARP12 from the Golgi complex to the stress granules under stress condition and in a microtubule independent manner. (a) Representative confocal microscopy images of HeLa cells untreated (Control) or treated with NaAsO2 alone (250 μM, 2 h; NaAsO2), or after Nocodazole treatment (33 μM, 3 h; Nocodazole + NaAsO2, Methods), fixed and labeled with anti-PARP12 (red), anti-Golgin-97 (green) and anti-G3BP (a stress granules marker; cyan) antibodies. Insets: enlarged view of merged signals. (b) Representative confocal microscopy images of HeLa cells untreated (Control) or exposed to oxidative stress (NaAsO2), heat shock (43 °C) or osmotic shock (sorbitol) (Methods), fixed and labeled as in a. (a,b) Far right graphs: quantification of Manders’ colocalization coefficient (MCC) of PARP12/G3BP and PARP12/Golgin-97 under the indicated treatments. Data are mean ± SD from three independent experiments. Statistical significance was calculated by unpaired Student’s t-test; *p < 0.05; **p < 0.01. No statistically significant difference was observed in the presence or in the absence of Nocodazole in NaAsO2 –treated cells. Scale bars, 10 μm.
Figure 3
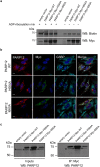
Overexpressed PARP12 induces stress granule assembly and interacts with its endogenous counterpart. (a) Representative in vitro ADP-ribosylation assay of total membranes from HeLa cells transfected with empty vector or Myc-tagged PARP12 wild-type (PARP12 Myc-WT) or different Myc-tagged PARP12 mutants (PARP12 Myc-H564A, PARP12 Myc-I660A) (Methods and Supplementary Table 1). The incorporated biotin-labeled ADP-ribose (black asterisk) was detected by Western blotting with anti-biotin antibody and the expression levels of PARP12 wild-type and mutants were monitored in membrane fractions with anti-Myc antibody. (b) Representative confocal microscopy images of HeLa cells transfected with empty vector or Myc-tagged PARP12 WT (PARP12 WT) or with the catalytically inactive mutants (PARP12 H564A, PARP12 I660A, as indicated) fixed and labeled with anti-PARP12 (red), anti-Myc (green) and anti-G3BP (cyan) antibodies. Scale bars, 10 μm. (c) Representative immunoprecipitation with anti-Myc antibody (IP: Myc) of total cell lysates from HeLa cells transfected with empty vector or PARP12 Myc-WT, PARP12 Myc-H564A or PARP12 Myc-I660A. Western blotting (WB) with anti-PARP12 antibody of eluted proteins (IP: Myc) and of total cell lysate (Inputs, 30 μg/lane). Black asterisks indicate endogenous PARP12. Molecular weight standards (kDa) in (a and c) are indicated on the left of each panel. Uncropped images of blots are shown in Supplementary Fig. 19.
Figure 4
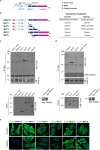
Recruitment of PARP12 deletion mutants to stress granules. (a) Structural domain organization of human PARP12, with functional annotation. The ZN-fingers (CCCH-type; light blue), the two WWE (blue) and the catalytic domains (magenta) are indicated. (b) Schematic representation of the PARP12 FLAG-tagged full-length (PARP12) and mutants (MUT1–5) used in this study and table summary of their subcellular localization in HeLa cells untreated (Control) or exposed to oxidative stress (NaAsO2). The FLAG-tag is indicated in red. (c,d) Immunoprecipitation with anti-Myc antibody (IP: Myc) of total cell lysates transfected with Myc-tagged PARP12 full-length followed by incubation with total cell lysates overexpressing FLAG empty vector, FLAG-tagged PARP12 full-length (PARP12) or the different PARP12-deletion mutants (as indicated). See Methods for details of lysis buffers used. The bound proteins were eluted and detected by Western blotting (WB) with anti-FLAG and anti-PARP12 antibodies (upper panels). Asterisks indicate the FLAG-tagged PARP12 proteins co-immunoprecipitated with Myc-tagged PARP12 protein. Total cell lysates (Inputs, 30 μg/lane) were also checked for overexpression levels with anti-FLAG antibody (lower panels; left) and with anti-Myc antibody (lower panels; right). Molecular weight standards (kDa) are indicated on the left of each panel. Uncropped images of blots are shown in Supplementary Fig. 19. (e) Representative confocal microscopy images of HeLa cells transfected with the FLAG-tagged PARP12 full-length (PARP12) or PARP12 deletion mutants (MUT1-5) for 24 h and then untreated (Control) or treated with NaAsO2 (250 μM, 2 h), fixed and labeled with anti-FLAG antibody (green). Scale bars, 10 μm.
Figure 5
Homology model of the _iso_-ADP-ribose–PARP12 complex. (a) Homology model of PARP12 WWE1 using RNF146 crystal structure as template [(PMID: 25327252) PDBcode: 4QPL] with the _iso_-ADP-ribose molecules. The _iso_-ADP-ribose, in solid stick, is coloured per atom type, while the protein is schematized in a secondary-structure cartoon: alpha and 3.10 helices are in purple and blue, respectively; beta sheets are yellow arrows, beta turns are cyan ribbons and irregular structure are white ribbons. (b) Magnification of the ligand-binding site in PARP12 in presence of the _iso_-ADP-ribose as for the homology model in a. Engaged water molecules and key residue side chains are illustrated; main interactions stabilizing the complex are highlighted (dotted lines). Non-polar hydrogens are hidden. The _iso_-ADP-ribose and the interacting-residue side chains are coloured per atom type, while protein backbone is represented per secondary structure. Helices are in red, strands are in yellow, turns are in blue and ribbon loops are in white. (c,d) Far-Western blotting with purified His-PARP12-MUT1 and His-PARP12-MUT2 immobilized on a nitrocellulose membrane and incubated with PARP1-bound polymers as described under “Methods” (+automodified PARP1; c) or with biotinylated-PAR (+Biotinylated PAR; d) and revealed by Western Blotting with anti-PAR antibody [WB: PAR (10 H); c] or with anti-biotin antibody (WB: Biotin; d). Af1521 macro domain and BSA proteins were used as internal positive and negative controls, respectively. Ponceau Red staining was used to visualize the amount of proteins. Uncropped images of blots are shown in Supplementary Fig. 20.
Figure 6
PAR triggers PARP12 translocation to stress granules. (a) Representative confocal microscopy images of HeLa cells transfected with FLAG-tagged PARP12-MUT3 (FLAG-MUT3) for 20 h and then untreated (Control) or treated with NaAsO2 (250 μM, 1 h) alone (NaAsO2), or with PJ34 pre-treatment (30 μM, 16 h; PJ34 + NaAsO2, Methods), before fixation and labeling with anti-FLAG antibody (green). Far right graph: quantification of cell percentage with FLAG-PARP12-MUT3 localization at stress granules (SGs). (b) Representative confocal microscopy image of HeLa cells untreated (Control) or treated with NaAsO2 alone (NaAsO2), or with PJ34 pre-treatment (PJ34 + NaAsO2; as above), fixed and labeled with anti-PAR antibody (green). Of note, the nuclear PAR staining is not detectable because the experiments were performed in the absence of PARG inhibitor (PDD00017238, 500 nM, 12 h). Far right graph: quantification of PAR positive stress granules/cell in NaAsO2- and (PJ34 + NaAsO2)-treated cells. Data are mean ± SD from three independent experiments. Statistical significance was calculated by unpaired Student’s t-test; *p < 0.05. Scale bars, 10 μm.
Figure 7
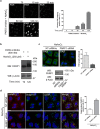
PARP1 activation drives PARP12 translocation to stress granules. (a) Representative confocal microscopy images of HeLa cells treated with PARG inhibitor (PDD00017238, 500 nM, 12 h) and then exposed to NaAsO2 (250 μM) for the indicated times, fixed and labeled with anti-PAR antibody (gray). Far right graph: quantification of cell percentage with nuclear PAR staining at the indicated times. Of note, in the absence of the oxidative stress, the nuclear PAR staining was not detectable at the analyzed times (from T0 to T120 min), even in the presence of the PARG inhibitor. (b) Western blotting (WB) with anti-PARP1 antibody of total cell lysate (20 μg/lane) from HeLa cells treated as in a. Uncropped images of blots are shown in Supplementary Fig. 20. (c) Representative confocal microscopy images of HeLa cells transfected with 150 nM non-targeting siRNAs (NT siRNAs) or with PARP1 siRNA for 72 h and then exposed to NaAsO2 (250 μM, 2 h), fixed and labeled with anti-PAR antibody (green). Far-right graph: quantification of PAR positive stress granules (SGs)/cell. Panel: efficiency of interference by Western blotting (WB) of total cell lysates (25 μg/lane) with anti-PARP1 antibody. (b,c) Actin is shown for the internal protein levels. Molecular weight standards (kDa) are indicated on the right of each panel. (d) Representative confocal microscopy images of HeLa cells treated as in c, fixed and labeled with anti-PARP12 (red), anti-Golgin-97 (green) and anti-G3BP (cyan) antibodies. Far right graph: quantification of cell percentage with PARP12 localization at the Golgi complex. Data are mean ± SD from three independent experiments. Statistical significance was calculated by unpaired Student’s t-test; *p < 0.05; **p < 0.01; ***p < 0.001. Scale bars, 10 μm.
Figure 8
Oxidative stress impairs intracellular trafficking. (a) Representative confocal microscopy images of VSVG transport in HeLa cells transfected with 150 nM non-targeting siRNAs (NT siRNAs) or 100 nM PARP12 siRNAs or 150 nM PARP1 siRNA before co-transfection for the last 16 h with VSVG-YFP (Methods). During the TGN-exit assay, after 90 min at 20 °C, the cells were untreated or treated with 250 μM NaAsO2 (NaAsO2) and incubated for a further 90 min at 20 °C. Cells were fixed after 120 min of the 32 °C temperature-block release and labeled with anti-PARP12 (red) and anti-Golgin-97 (blue) antibodies. Insets: magnification of Golgi area. (b) Efficiency of interference by Western blotting (WB) of total cell lysates (25 μg/lane) with anti-PARP12 and anti-PARP1 antibodies, as indicated. Actin is shown for the internal protein levels and molecular weight standards (kDa) are indicated on the right of each panel. Uncropped images of blots are shown in Supplementary Fig. 20. (c) Quantification of VSVG-YFP in the Golgi area after 120 min of the 32 °C temperature-block release in cells treated as in a. Data are mean ± SD from three independent experiments. Statistical significance was calculated by unpaired Student’s t-test; ***p < 0.001 Scale bar, 10 μm. See also Supplementary Fig. 15 for cells fixed after the 20 °C temperature-block.
Similar articles
- PKD-dependent PARP12-catalyzed mono-ADP-ribosylation of Golgin-97 is required for E-cadherin transport from Golgi to plasma membrane.
Grimaldi G, Filograna A, Schembri L, Lo Monte M, Di Martino R, Pirozzi M, Spano D, Beccari AR, Parashuraman S, Luini A, Valente C, Corda D. Grimaldi G, et al. Proc Natl Acad Sci U S A. 2022 Jan 4;119(1):e2026494119. doi: 10.1073/pnas.2026494119. Proc Natl Acad Sci U S A. 2022. PMID: 34969853 Free PMC article. - ADP-ribosylation and intracellular traffic: an emerging role for PARP enzymes.
Grimaldi G, Corda D. Grimaldi G, et al. Biochem Soc Trans. 2019 Feb 28;47(1):357-370. doi: 10.1042/BST20180416. Epub 2019 Feb 1. Biochem Soc Trans. 2019. PMID: 30710058 Review. - PARPs and PAR as novel pharmacological targets for the treatment of stress granule-associated disorders.
Grimaldi G, Catara G, Palazzo L, Corteggio A, Valente C, Corda D. Grimaldi G, et al. Biochem Pharmacol. 2019 Sep;167:64-75. doi: 10.1016/j.bcp.2019.05.019. Epub 2019 May 15. Biochem Pharmacol. 2019. PMID: 31102582 Review. - The poly(ADP-ribose) polymerases (PARPs): new roles in intracellular transport.
Abd Elmageed ZY, Naura AS, Errami Y, Zerfaoui M. Abd Elmageed ZY, et al. Cell Signal. 2012 Jan;24(1):1-8. doi: 10.1016/j.cellsig.2011.07.019. Epub 2011 Aug 5. Cell Signal. 2012. PMID: 21840394 Review. - Characterization of DNA ADP-ribosyltransferase activities of PARP2 and PARP3: new insights into DNA ADP-ribosylation.
Zarkovic G, Belousova EA, Talhaoui I, Saint-Pierre C, Kutuzov MM, Matkarimov BT, Biard D, Gasparutto D, Lavrik OI, Ishchenko AA. Zarkovic G, et al. Nucleic Acids Res. 2018 Mar 16;46(5):2417-2431. doi: 10.1093/nar/gkx1318. Nucleic Acids Res. 2018. PMID: 29361132 Free PMC article.
Cited by
- Functional roles of ADP-ribosylation writers, readers and erasers.
Li P, Lei Y, Qi J, Liu W, Yao K. Li P, et al. Front Cell Dev Biol. 2022 Aug 11;10:941356. doi: 10.3389/fcell.2022.941356. eCollection 2022. Front Cell Dev Biol. 2022. PMID: 36035988 Free PMC article. Review. - Modulation of the secretory pathway by amino-acid starvation.
van Leeuwen W, van der Krift F, Rabouille C. van Leeuwen W, et al. J Cell Biol. 2018 Jul 2;217(7):2261-2271. doi: 10.1083/jcb.201802003. Epub 2018 Apr 18. J Cell Biol. 2018. PMID: 29669743 Free PMC article. Review. - Proteomic Analysis of the Downstream Signaling Network of PARP1.
Zhen Y, Yu Y. Zhen Y, et al. Biochemistry. 2018 Jan 30;57(4):429-440. doi: 10.1021/acs.biochem.7b01022. Epub 2018 Jan 19. Biochemistry. 2018. PMID: 29327913 Free PMC article. Review. - Functional Roles of Poly(ADP-Ribose) in Stress Granule Formation and Dynamics.
Jin X, Cao X, Liu S, Liu B. Jin X, et al. Front Cell Dev Biol. 2021 Apr 26;9:671780. doi: 10.3389/fcell.2021.671780. eCollection 2021. Front Cell Dev Biol. 2021. PMID: 33981709 Free PMC article. Review. - PARP enzymes and mono-ADP-ribosylation: advancing the connection from interferon-signalling to cancer biology.
Morone B, Grimaldi G. Morone B, et al. Expert Rev Mol Med. 2024 Aug 27;26:e17. doi: 10.1017/erm.2024.13. Expert Rev Mol Med. 2024. PMID: 39189367 Free PMC article. Review.
References
Publication types
MeSH terms
Substances
LinkOut - more resources
Full Text Sources
Other Literature Sources
Miscellaneous
