Identification of two types of GGAA-microsatellites and their roles in EWS/FLI binding and gene regulation in Ewing sarcoma - PubMed (original) (raw)
Identification of two types of GGAA-microsatellites and their roles in EWS/FLI binding and gene regulation in Ewing sarcoma
Kirsten M Johnson et al. PLoS One. 2017.
Abstract
Ewing sarcoma is a bone malignancy of children and young adults, frequently harboring the EWS/FLI chromosomal translocation. The resulting fusion protein is an aberrant transcription factor that uses highly repetitive GGAA-containing elements (microsatellites) to activate and repress thousands of target genes mediating oncogenesis. However, the mechanisms of EWS/FLI interaction with microsatellites and regulation of target gene expression is not clearly understood. Here, we profile genome-wide protein binding and gene expression. Using a combination of unbiased genome-wide computational and experimental analysis, we define GGAA-microsatellites in a Ewing sarcoma context. We identify two distinct classes of GGAA-microsatellites and demonstrate that EWS/FLI responsiveness is dependent on microsatellite length. At close range "promoter-like" microsatellites, EWS/FLI binding and subsequent target gene activation is highly dependent on number of GGAA-motifs. "Enhancer-like" microsatellites demonstrate length-dependent EWS/FLI binding, but minimal correlation for activated and none for repressed targets. Our data suggest EWS/FLI binds to "promoter-like" and "enhancer-like" microsatellites to mediate activation and repression of target genes through different regulatory mechanisms. Such characterization contributes valuable insight to EWS/FLI transcription factor biology and clarifies the role of GGAA-microsatellites on a global genomic scale. This may provide unique perspective on the role of non-coding DNA in cancer susceptibility and therapeutic development.
Conflict of interest statement
Competing Interests: SLL declares a conflict of interest as a member of the advisory board for Salarius Pharmaceuticals. SLL is also a listed inventor on United States Patent No. US 7,939,253 B2, “Methods and compositions for the diagnosis and treatment of Ewing’s Sarcoma,” and United States Patent No. US 8,557,532, “Diagnosis and treatment of drug-resistant Ewing’s sarcoma.” This does not alter our adherence to PLOS ONE policies on sharing data and materials.
Figures
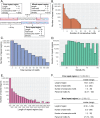
Fig 1. Schema and characteristics of repeat regions across genome.
(A) Schema of repeat regions. Regions with only one type of motif are called pure repeat region while those with both GGAA and TTCC are called mixed repeat regions. Each repeat region (purple box) is separated by at least 20-bp consecutive non-motifs. (B) Histogram of maximum number of consecutive motifs. (C) Histogram of total number of motifs. (D) Histogram of motif density of repeat regions. Density=(totalnumberofmotifs×4lengthofregions)×100%. Bin width is 5%. (E) Histogram of length of repeat regions. Each bin is 100bp width (e.g., first bin is 0-100bp length). Bins with zero repeat regions are not shown. (F) The characteristics of repeat regions for pure and mixed repeat regions across the genome. Red line indicates the mean for each characteristic.
Fig 2. Nearest gene schema and genomic location of repeat regions.
(A) Schema showing the nearest gene (orange) which is the gene with the shortest distance calculated from its TSS to the middle of the repeat region. (B) Distribution of distances to nearest genes for each repeat region grouped by number of consecutive motifs. The sum of percentages for each consecutive motif is 100%. (C) Comparisons of distance-to-nearest-gene for longer consecutive motifs to repeat regions with one to two consecutive motifs (i.e. ‘1–2’). * indicates the repeat regions are significantly closer to a gene than repeat regions with 1–2 consecutive motifs (p < 0.05). Red line represents the median distance-to-nearest gene for repeat regions with 1–2 consecutive motifs. (D) Feature distribution for each consecutive motif category. (E) Proportions of repeat regions in each chromosome grouped by the number of consecutive motifs.
Fig 3. Characteristics of EWS/FLI-bound microsatellites.
(A) Permutation test shows that the number of EWS/FLI binding sites that overlap with repeat regions (n = 8,256) with minimum of 3 consecutive motifs is significantly higher than random chance (p < 0.001). Red line denotes the significance limit (α = 0.05). Gray bars represent the number of overlaps in the random regions with EWS/FLI binding sites in 1,000 permutations. The black line represents the mean of overlaps in random regions (EVperm) and the green bar is the actual number of overlaps observed in repeat regions (Obs). (B) Boxplot of EWS/FLI fold-enrichment (relative to genomic background) and number of consecutive motifs in EWS/FLI-bound microsatellites showing statistically significant increasing trend (p < 2.2 × 10⁻¹⁶). The blue line is the estimated LOESS regression line of the mean with the estimated 95% confidence bands (shaded region). (C) Boxplot of EWS/FLI fold-enrichment and total number of motifs in EWS/FLI-bound microsatellites showing a positive correlation (p = 1.9 × 10⁻¹⁰) and a non-linear trend (p < 0.05). The blue line is the estimated LOESS regression line of the mean with the estimated 95% confidence bands (shaded region). (D) Boxplot of EWS/FLI fold-enrichment and Density (=totalmotif×4lengthofmicrosatellite×100%) showing statistically significant positive correlation (p < 2.2 × 10⁻¹⁶). The blue line is the estimated LOESS regression line of the mean with the estimated 95% confidence bands (shaded region).
Fig 4. Correlation between EWS/FLI-bound microsatellites, GGAA-motif and gene expression.
(A) Scatter plot of expression of activated genes and EWS/FLI fold-enrichment at promoter-like microsatellites showing a positive correlation (r = 0.46, p = 3.35 × 10⁻⁷). (B) Boxplot of EWS/FLI fold-enrichment and number of consecutive motifs of EWS/FLI-bound at promoter-like microsatellites for activated genes showing a non-linear trend. Blue line is the estimated LOESS regression line of the mean with the estimated 95% confidence interval (shaded region). Overall, there is statistically significant positive correlation (r = 0.43, p = 1.5 × 10⁻⁶). (C) Boxplot of EWS/FLI-activated gene expression and number of consecutive motifs at promoter-like EWS/FLI-bound microsatellites for gene activation showing a non-linear trend as seen in EWS/FLI binding intensities and a statistically significant positive correlation (r = 0.23, p = 0.01). The blue line is the estimated LOESS regression line of the mean with the estimated 95% confidence bands (shaded region). (D) Scatter plot of expression of activated genes and EWS/FLI fold-enrichment at enhancer-like microsatellites showing a positive correlation (r = 0.15, p = 3.5 × 10⁻⁴). (E) Boxplot of EWS/FLI fold-enrichment and number of consecutive motifs at EWS/FLI-bound enhancer-like microsatellites showing a positive correlation (r = 0.53, p = 2.2 × 10⁻¹⁶). Blue line is the estimated LOESS regression line of the mean and the standard error of the prediction shown as shaded region. (F) Boxplot of EWS/FLI fold-enrichment and number of consecutive motifs at EWS/FLI-bound enhancer-like microsatellites associated with gene repression showing positive correlation (r = 0.40, p < 2.2 × 10⁻¹⁶). The blue line is the estimated LOESS regression line of the mean with the estimated 95% confidence bands (shaded region).
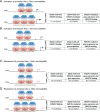
Fig 5. Schema of correlative associations between GGAA motifs in EWS/FLI-bound microsatellites for gene activation and repression.
Schematic illustrating EWS/FLI responsiveness at given loci across the genome. (A) Promoter-like (close-range) GGAA-microsatellites positively correlate with EWS/FLI binding and activation of genes in a length dependent manner. (B) Enhancer-like (long-range) GGAA-microsatellites positively correlate with EWS/FLI binding but correlation with transcriptional regulation is only minimal for activated genes. (C) Promoter-like GGAA-microsatellites display no correlation with EWS/FLI binding and transcriptional repression. (D) Enhancer-like GGAA-microsatellites positively correlate with EWS/FLI binding; however, they do not confer gene expression.
Similar articles
- Role for the EWS domain of EWS/FLI in binding GGAA-microsatellites required for Ewing sarcoma anchorage independent growth.
Johnson KM, Mahler NR, Saund RS, Theisen ER, Taslim C, Callender NW, Crow JC, Miller KR, Lessnick SL. Johnson KM, et al. Proc Natl Acad Sci U S A. 2017 Sep 12;114(37):9870-9875. doi: 10.1073/pnas.1701872114. Epub 2017 Aug 28. Proc Natl Acad Sci U S A. 2017. PMID: 28847958 Free PMC article. - Clinical and biochemical function of polymorphic NR0B1 GGAA-microsatellites in Ewing sarcoma: a report from the Children's Oncology Group.
Monument MJ, Johnson KM, McIlvaine E, Abegglen L, Watkins WS, Jorde LB, Womer RB, Beeler N, Monovich L, Lawlor ER, Bridge JA, Schiffman JD, Krailo MD, Randall RL, Lessnick SL. Monument MJ, et al. PLoS One. 2014 Aug 5;9(8):e104378. doi: 10.1371/journal.pone.0104378. eCollection 2014. PLoS One. 2014. PMID: 25093581 Free PMC article. - Microsatellites as EWS/FLI response elements in Ewing's sarcoma.
Gangwal K, Sankar S, Hollenhorst PC, Kinsey M, Haroldsen SC, Shah AA, Boucher KM, Watkins WS, Jorde LB, Graves BJ, Lessnick SL. Gangwal K, et al. Proc Natl Acad Sci U S A. 2008 Jul 22;105(29):10149-54. doi: 10.1073/pnas.0801073105. Epub 2008 Jul 14. Proc Natl Acad Sci U S A. 2008. PMID: 18626011 Free PMC article. - Therapeutic opportunities in Ewing sarcoma: EWS-FLI inhibition via LSD1 targeting.
Theisen ER, Pishas KI, Saund RS, Lessnick SL. Theisen ER, et al. Oncotarget. 2016 Apr 5;7(14):17616-30. doi: 10.18632/oncotarget.7124. Oncotarget. 2016. PMID: 26848860 Free PMC article. Review. - EWS-FLI1 in Ewing's sarcoma: real targets and collateral damage.
Ban J, Siligan C, Kreppel M, Aryee D, Kovar H. Ban J, et al. Adv Exp Med Biol. 2006;587:41-52. doi: 10.1007/978-1-4020-5133-3_4. Adv Exp Med Biol. 2006. PMID: 17163154 Review.
Cited by
- Global chromatin landscapes identify candidate noncoding modifiers of cardiac rhythm.
Bhattacharyya S, Kollipara RK, Orquera-Tornakian G, Goetsch S, Zhang M, Perry C, Li B, Shelton JM, Bhakta M, Duan J, Xie Y, Xiao G, Evers BM, Hon GC, Kittler R, Munshi NV. Bhattacharyya S, et al. J Clin Invest. 2023 Feb 1;133(3):e153635. doi: 10.1172/JCI153635. J Clin Invest. 2023. PMID: 36454649 Free PMC article. - Targeting the undruggable: exploiting neomorphic features of fusion oncoproteins in childhood sarcomas for innovative therapies.
Knott MML, Hölting TLB, Ohmura S, Kirchner T, Cidre-Aranaz F, Grünewald TGP. Knott MML, et al. Cancer Metastasis Rev. 2019 Dec;38(4):625-642. doi: 10.1007/s10555-019-09839-9. Cancer Metastasis Rev. 2019. PMID: 31970591 Free PMC article. Review. - Cooperation of cancer drivers with regulatory germline variants shapes clinical outcomes.
Musa J, Cidre-Aranaz F, Aynaud MM, Orth MF, Knott MML, Mirabeau O, Mazor G, Varon M, Hölting TLB, Grossetête S, Gartlgruber M, Surdez D, Gerke JS, Ohmura S, Marchetto A, Dallmayer M, Baldauf MC, Stein S, Sannino G, Li J, Romero-Pérez L, Westermann F, Hartmann W, Dirksen U, Gymrek M, Anderson ND, Shlien A, Rotblat B, Kirchner T, Delattre O, Grünewald TGP. Musa J, et al. Nat Commun. 2019 Sep 11;10(1):4128. doi: 10.1038/s41467-019-12071-2. Nat Commun. 2019. PMID: 31511524 Free PMC article. - Analysis of Regulatory DNA Sequences by Dual-Luciferase Reporter Assays in Ewing Sarcoma.
Hölting TLB, Knott MML. Hölting TLB, et al. Methods Mol Biol. 2021;2226:139-149. doi: 10.1007/978-1-0716-1020-6_10. Methods Mol Biol. 2021. PMID: 33326098 - Loci-specific phase separation of FET fusion oncoproteins promotes gene transcription.
Zuo L, Zhang G, Massett M, Cheng J, Guo Z, Wang L, Gao Y, Li R, Huang X, Li P, Qi Z. Zuo L, et al. Nat Commun. 2021 Mar 5;12(1):1491. doi: 10.1038/s41467-021-21690-7. Nat Commun. 2021. PMID: 33674598 Free PMC article.
References
- Bailly RA, Bosselut R, Zucman J, Cormier F, Delattre O, Roussel M, et al. DNA-binding and transcriptional activation properties of the EWS-FLI-1 fusion protein resulting from the t(11;22) translocation in Ewing sarcoma. Mol Cell Biol. 1994;14: 3230–41. Available: http://www.pubmedcentral.nih.gov/articlerender.fcgi?artid=358690&tool=pm... - PMC - PubMed
- Lamber EP, Vanhille L, Textor LC, Kachalova GS, Sieweke MH, Wilmanns M. Regulation of the transcription factor Ets-1 by DNA-mediated homo-dimerization. EMBO J. 2008;27: 2006–17. doi: 10.1038/emboj.2008.117 - DOI - PMC - PubMed
- Ohno T, Rao VN, Shyam E, Reddy P. EWS/Fli-1 Chimeric Protein Is a Transcriptional Activator. Cancer Res. 1993;53: 5859–5863. - PubMed
- Sorensen PH, Triche TJ. Gene fusions encoding chimaeric transcription factors in solid tumours. Semin Cancer Biol. 1996;7: 3–14. doi: 10.1006/scbi.1996.0002 - DOI - PubMed
MeSH terms
Substances
LinkOut - more resources
Full Text Sources
Other Literature Sources
Molecular Biology Databases


