The Stress Granule Transcriptome Reveals Principles of mRNA Accumulation in Stress Granules - PubMed (original) (raw)
The Stress Granule Transcriptome Reveals Principles of mRNA Accumulation in Stress Granules
Anthony Khong et al. Mol Cell. 2017.
Abstract
Stress granules are mRNA-protein assemblies formed from nontranslating mRNAs. Stress granules are important in the stress response and may contribute to some degenerative diseases. Here, we describe the stress granule transcriptome of yeast and mammalian cells through RNA-sequencing (RNA-seq) analysis of purified stress granule cores and single-molecule fluorescence in situ hybridization (smFISH) validation. While essentially every mRNA, and some noncoding RNAs (ncRNAs), can be targeted to stress granules, the targeting efficiency varies from <1% to >95%. mRNA accumulation in stress granules correlates with longer coding and UTR regions and poor translatability. Quantifying the RNA-seq analysis by smFISH reveals that only 10% of bulk mRNA molecules accumulate in mammalian stress granules and that only 185 genes have more than 50% of their mRNA molecules in stress granules. These results suggest that stress granules may not represent a specific biological program of messenger ribonucleoprotein (mRNP) assembly, but instead form by condensation of nontranslating mRNPs in proportion to their length and lack of association with ribosomes.
Keywords: RNA localization; RNA-seq; RNP granules; amyotrophic lateral sclerosis; eCLIP; mRNP assemblies; neurodegenerative diseases; single molecule FISH; stress granules.
Copyright © 2017 Elsevier Inc. All rights reserved.
Figures
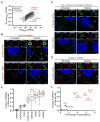
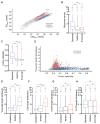
Figure 1. mRNAs differ in degree of recruitment to SGs
(A) Scatter plot depicting RNA abundance (FPKM) in SG purified RNA vs Total RNA. Red dots indicate RNAs that are significantly enriched (Fold change > 2 and p < .01) in SG purified RNA compared to Total RNA. Blue dots indicate RNAs that are significantly depleted (Fold change <.05 and p >.01) in SG purified RNA compared to TotalRNA. Dark gray dots indicate RNAs that are either not significantly enriched or fail to meet the fold change requirement. Light gray dots indicate mRNAs below <1FPKM. (B) smFISH validation of mRNAs enriched in SGs (AHNAK and DYNC1H1). (C) smFISH validation of RNAs that are neither enriched nor depleted from SGs (POLR2A and TFRC). (D) smFISH validation of a mRNA that is depleted from SGs (GAPDH). Scale bar = 2μm. (E) Quantification of the fraction of each indicated transcript in SGs per cell. 20 cells were counted. (F) Scatterplot depicting fraction of each indicated transcript in Sgs vs. FPKM ratios of SGcoreRNA-Seq: TotalRNA-Seq data (Fold-change). Twenty cells were counted for each experiment.
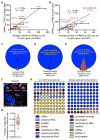
Figure 2. Quantitative analysis of SG composition
(A) Scatterplot depicting an average number of mRNAs per cell by smFISH vs. FPKM values from TotalRNA-Seq data. (B) Scatterplot depicting an average number of mRNAs in SGs per cell by smFISH vs. FPKM values from SGcoreRNA-Seq data. Error bars indicate 1 strandard deviation. (C) Pie chart depicting the fraction of total RNA inside and outside SGs. (D) Pie chart depicting the fraction of ncRNAs inside and outside SGs. (E) Pie chart depicting the fraction of mRNAs inside and outside SGs. (F) Oligo(dT) staining of sodium arsenite induced SGs. Scale bar = 2μm. (G) Quantitation of the fraction of oligo(dT) staining within SGs per cell. (H) RNA composition of the U2-OS transcriptome and the SGs transcriptome. RNA designations are from ensemble release 90.
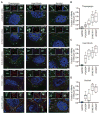
Figure 3. mRNA localization is conserved during multiple stresses
(A) smFISH images acquired for five transcripts (AHNAK, DYNC1H1, TFRC, POLR2A and GAPDH) during three different types of stresses (thapsigargin, heat shock, and sorbitol). (B) Quantitation of each transcript’s enrichment in SGs. Ten or more cells were counted for each experiment.
Figure 4. Physical basis of differential mRNA recruitment to mammalian SGs
(A–E) Boxplots depicting (A) translational efficiency, (B) total transcript length, (C) CDS length, (D) 5’ UTR length, and (E) 3’UTR length for each of the three classes of mRNA localization during stress: SG enriched mRNAs, SG depleted mRNAs, or neither. (F) Scatter plot depicting the mRNA transcript length vs. translational efficiency for SG enriched (red) and SG depleted (blue) mRNAs. n.s. (not significant) = p > .05 and *** = p value ≤0.001 (Student’s t-test).
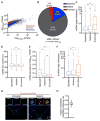
Figure 5. Physical basis of differential ncRNA recruitment to mammalian SGs
(A) Scatter plot depicting ncRNA abundance (FPKM) in SG purified RNA vs. Total RNA. Red dots indicate ncRNAs that are significantly enriched (Fold change > 2 and p < .01) in SG purified RNA compared to Total RNA. Blue dots indicate ncRNAs that are significantly depleted (Fold change <.05 and p >.01) in SG purified RNA compared to Total RNA. Gray dots indicate ncRNAs that are either not significantly enriched or fail to meet the fold change requirement. (B) Pie chart depicting the relative contribution of each class of ncRNA (SG-enriched, SG-depleted, or neither) to the total transcriptome SG transcriptome (right). (C–F) Boxplot depicting the (C) transcript length, (D) GC content, (E) abundance of ncRNA, and (F) length of lincRNAs for the three classes of localization: SG enriched mRNAs, SG depleted mRNAs, or neither. n.s., *, **, and *** = p value (Student’s t-test) > 0.05, ≤0.05, ≤0.01, and ≤0.001 respectively. (G) smFISH images of an SG enriched lincRNA, NORAD, during no stress and sodium arsenite induced stress. Scale bar = 2μm. (H) Quantitation of the fraction of NORAD RNAs in SGs. Twenty cells were counted.
Figure 6. The physical basis of mRNA localization to SGs is conserved from mammals to yeast
(A) Scatterplot depicting normalized RNA-Seq reads from libraries made from yeast SG purified RNA vs. total RNA. (B and C) Boxplots depicting two metrics of translatability, (B) ribosome density and (C) codon optimality, are correlated with altered localization during stress. (D) Boxplot depicting how transcript length correlates with altered localization. (E) Scatterplot of transcript length vs. fraction optimal codons for SG enriched (red) and SG depleted mRNAs (blue). (F–H) Boxplots depicting how length correlates with localization for (F) the CDS, (G) the 5’UTR, and (H) the 3’ UTR. n.s., **, and *** = p value (Student’s t-test) > 0.05, ≤0.01, and ≤0.001 respectively.
Figure 7. SG-enriched mRNAs are enriched for SG-resident proteins
(A) Survey of RNA binding proteins from Nostrand et al. (2016)) plotted against the fraction of eCLIP sites found in SG-enriched mRNAs. Green dots are SG-resident RBPs. Black dots are non-SG resident RBPs. Green dots with a red diagonal line are SG-resident RBPs with PrLD domain. Green dots with a red X are SG-resident RBPs with PrLD domain and are associated with ALS/FTD. Box plot illustrating the fraction of eCLIP sites found in (B) SG-enriched mRNAs or (C) SG-depleted mRNAs from SG-resident RBPs or non-SG RBPs. Box plot depicting the fraction of eCLIP sites found in SG-depleted mRNAs from SG-RBPs or non-SG RBPs. Box plot illustrating the fraction of eCLIP sites found in SG-enriched RNAs from (D) SG-RBPs containing PrLD and (E) RBPs associated with ALS/FTD. * and ** = p value (Student’s t-test) ≤0.05, and ≤0.01 respectively.
Similar articles
- RNA self-assembly contributes to stress granule formation and defining the stress granule transcriptome.
Van Treeck B, Protter DSW, Matheny T, Khong A, Link CD, Parker R. Van Treeck B, et al. Proc Natl Acad Sci U S A. 2018 Mar 13;115(11):2734-2739. doi: 10.1073/pnas.1800038115. Epub 2018 Feb 26. Proc Natl Acad Sci U S A. 2018. PMID: 29483269 Free PMC article. - P bodies promote stress granule assembly in Saccharomyces cerevisiae.
Buchan JR, Muhlrad D, Parker R. Buchan JR, et al. J Cell Biol. 2008 Nov 3;183(3):441-55. doi: 10.1083/jcb.200807043. J Cell Biol. 2008. PMID: 18981231 Free PMC article. - Analyzing P-bodies and stress granules in Saccharomyces cerevisiae.
Buchan JR, Nissan T, Parker R. Buchan JR, et al. Methods Enzymol. 2010;470:619-40. doi: 10.1016/S0076-6879(10)70025-2. Epub 2010 Mar 1. Methods Enzymol. 2010. PMID: 20946828 - mRNP granules. Assembly, function, and connections with disease.
Buchan JR. Buchan JR. RNA Biol. 2014;11(8):1019-30. doi: 10.4161/15476286.2014.972208. RNA Biol. 2014. PMID: 25531407 Free PMC article. Review. - mRNPs meet stress granules.
Sheinberger J, Shav-Tal Y. Sheinberger J, et al. FEBS Lett. 2017 Sep;591(17):2534-2542. doi: 10.1002/1873-3468.12765. Epub 2017 Aug 8. FEBS Lett. 2017. PMID: 28746974 Review.
Cited by
- m6A RNA demethylase AtALKBH9B promotes mobilization of a heat-activated long terminal repeat retrotransposon in Arabidopsis.
Fan W, Wang L, Lei Z, Li H, Chu J, Yan M, Wang Y, Wang H, Yang J, Cho J. Fan W, et al. Sci Adv. 2023 Dec;9(48):eadf3292. doi: 10.1126/sciadv.adf3292. Epub 2023 Nov 29. Sci Adv. 2023. PMID: 38019921 Free PMC article. - Aging RNA granule dynamics in neurodegeneration.
Rhine K, Al-Azzam N, Yu T, Yeo GW. Rhine K, et al. Front Mol Biosci. 2022 Sep 16;9:991641. doi: 10.3389/fmolb.2022.991641. eCollection 2022. Front Mol Biosci. 2022. PMID: 36188213 Free PMC article. Review. - N4-acetylcytidine (ac4C) promotes mRNA localization to stress granules.
Kudrin P, Singh A, Meierhofer D, Kuśnierczyk A, Ørom UAV. Kudrin P, et al. EMBO Rep. 2024 Apr;25(4):1814-1834. doi: 10.1038/s44319-024-00098-6. Epub 2024 Feb 27. EMBO Rep. 2024. PMID: 38413733 Free PMC article. - A guide to membraneless organelles and their various roles in gene regulation.
Hirose T, Ninomiya K, Nakagawa S, Yamazaki T. Hirose T, et al. Nat Rev Mol Cell Biol. 2023 Apr;24(4):288-304. doi: 10.1038/s41580-022-00558-8. Epub 2022 Nov 23. Nat Rev Mol Cell Biol. 2023. PMID: 36424481 Review. - Expression of miRNA-Targeted and Not-Targeted Reporter Genes Shows Mutual Influence and Intercellular Specificity.
Hudy D, Rzeszowska-Wolny J. Hudy D, et al. Int J Mol Sci. 2022 Dec 1;23(23):15059. doi: 10.3390/ijms232315059. Int J Mol Sci. 2022. PMID: 36499386 Free PMC article.
References
MeSH terms
Substances
LinkOut - more resources
Full Text Sources
Other Literature Sources
Molecular Biology Databases
