Identification of unique neoantigen qualities in long-term survivors of pancreatic cancer - PubMed (original) (raw)
. 2017 Nov 23;551(7681):512-516.
doi: 10.1038/nature24462. Epub 2017 Nov 8.
Vinod P Balachandran 1 2 3, Julia N Zhao 1 2 3, Vladimir Makarov 5 6, John Alec Moral 1 2 3, Romain Remark 7, Brian Herbst 2, Gokce Askan 2 8, Umesh Bhanot 8, Yasin Senbabaoglu 9, Daniel K Wells 10, Charles Ian Ormsby Cary 10, Olivera Grbovic-Huezo 2, Marc Attiyeh 1 2, Benjamin Medina 1, Jennifer Zhang 1, Jennifer Loo 1, Joseph Saglimbeni 2, Mohsen Abu-Akeel 9, Roberta Zappasodi 9, Nadeem Riaz 6 11, Martin Smoragiewicz 12, Z Larkin Kelley 13 14, Olca Basturk 8; Australian Pancreatic Cancer Genome Initiative; Garvan Institute of Medical Research; Prince of Wales Hospital; Royal North Shore Hospital; University of Glasgow; St Vincent’s Hospital; QIMR Berghofer Medical Research Institute; University of Melbourne, Centre for Cancer Research; University of Queensland, Institute for Molecular Bioscience; Bankstown Hospital; Liverpool Hospital; Royal Prince Alfred Hospital, Chris O’Brien Lifehouse; Westmead Hospital; Fremantle Hospital; St John of God Healthcare; Royal Adelaide Hospital; Flinders Medical Centre; Envoi Pathology; Princess Alexandria Hospital; Austin Hospital; Johns Hopkins Medical Institutes; ARC-Net Centre for Applied Research on Cancer; Mithat Gönen 15, Arnold J Levine 4, Peter J Allen 1 2, Douglas T Fearon 13 14, Miriam Merad 7, Sacha Gnjatic 7, Christine A Iacobuzio-Donahue 2 5 8, Jedd D Wolchok 3 9 16 17 18, Ronald P DeMatteo 1 2, Timothy A Chan 3 5 6 11, Benjamin D Greenbaum 19, Taha Merghoub 3 9 18, Steven D Leach 1 2 5 20
Collaborators, Affiliations
- PMID: 29132146
- PMCID: PMC6145146
- DOI: 10.1038/nature24462
Identification of unique neoantigen qualities in long-term survivors of pancreatic cancer
Vinod P Balachandran et al. Nature. 2017.
Abstract
Pancreatic ductal adenocarcinoma is a lethal cancer with fewer than 7% of patients surviving past 5 years. T-cell immunity has been linked to the exceptional outcome of the few long-term survivors, yet the relevant antigens remain unknown. Here we use genetic, immunohistochemical and transcriptional immunoprofiling, computational biophysics, and functional assays to identify T-cell antigens in long-term survivors of pancreatic cancer. Using whole-exome sequencing and in silico neoantigen prediction, we found that tumours with both the highest neoantigen number and the most abundant CD8+ T-cell infiltrates, but neither alone, stratified patients with the longest survival. Investigating the specific neoantigen qualities promoting T-cell activation in long-term survivors, we discovered that these individuals were enriched in neoantigen qualities defined by a fitness model, and neoantigens in the tumour antigen MUC16 (also known as CA125). A neoantigen quality fitness model conferring greater immunogenicity to neoantigens with differential presentation and homology to infectious disease-derived peptides identified long-term survivors in two independent datasets, whereas a neoantigen quantity model ascribing greater immunogenicity to increasing neoantigen number alone did not. We detected intratumoural and lasting circulating T-cell reactivity to both high-quality and MUC16 neoantigens in long-term survivors of pancreatic cancer, including clones with specificity to both high-quality neoantigens and predicted cross-reactive microbial epitopes, consistent with neoantigen molecular mimicry. Notably, we observed selective loss of high-quality and MUC16 neoantigenic clones on metastatic progression, suggesting neoantigen immunoediting. Our results identify neoantigens with unique qualities as T-cell targets in pancreatic ductal adenocarcinoma. More broadly, we identify neoantigen quality as a biomarker for immunogenic tumours that may guide the application of immunotherapies.
Figures
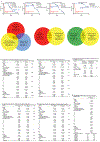
Extended Data Figure 1|. Clinicopathologic characteristics of the MSKCC cohort.
a, Overall survival and patient overlap of short and long term survivors in tissue microarray, whole exome sequencing, TCRVβ sequencing, and bulk tumor transcriptomic profiling cohorts. b-g, Clinicopathologic characteristics of patients in tissue microarray, transcriptome, TCR sequencing, whole exome sequencing, matched primary-metastatic, and very long term survivor cohorts. In b-e, *= three patients with metastases noted on final pathology (one liver metastasis, one metastasis to small bowel/mesentery, one splenic metastasis). n=biologically independent samples in individual patients. P values were determined using log-rank test (a), and two-sided Fisher’s exact test (gender, tumor location, pN, pM, margin, chemotherapy), two-sided Chi-square test (procedure, pathological stage, pT, adjuvant treatment) and unpaired, two-tailed student’s t test (age) (b-g).
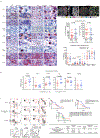
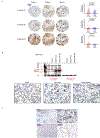
Extended Data Figure 2|. Long term PDAC survivors display enhanced intratumoral T cell immunity.
a, Representative sequential immunohistochemical staining of a single short term and a single long term core tumor section (left). Sections bounded by black rectangles (100X) are magnified to 275X (right) for each core section. (top right) Representative merged images of multiplexed immunohistochemistry are shown. Red rectangular sections are enlarged to 50X. CK19 stains tumor cells. Arrows indicate CD3+CD8+Granzyme-B+ T cells. (middle right) Immunofluorescent quantification of CD8+ and CD4+cells in tumor tissue microarrays of short and long term survivors. Slides used were cut from separate sections of the block as those used for sequential immunohistochemistry (Figure 1b, Extended Data Figure 2a). (bottom right) Quantification of multiplexed immunophenotyping as shown in Extended Figure 2a (left, and top right). All immunofluorescent and immunohistochemical staining was repeated independently in triplicates for each patient. In (a), short term n=45, long term n=51. b, Bulk tumor transcriptomic immune profiling in short and long term survivors. DC signature genes include CCL13, 17, 22, PPFIBP2, NPR1, HSD11B1, CD209/DC-SIGN103. c, Flow cytometric gating strategy to phenotype human T cells (n=7). First plot is pre-gated on live cells, followed by CD45+, and CD3+CD56- cells. Values indicate percentage of cells within the red boxes, and are gated based on isotype controls. d, Top: Overall survival of patients who did or did not receive adjuvant chemotherapy (adjuvant chemotherapy+/− respectively, top left), and of patients with tumors harboring greater or less than the median number of CD3-CD8-GranzymeB triple positive cells (CD3-CD8-GranzymeBHi/Low respectively, top right). Overall survival of all four groups shown in bottom. Table shows univariate and multivariate Cox regression analysis of clinicopathologic features, adjuvant chemotherapy, and CD3-CD8-GranzymeB density associations with overall survival. Horizontal bars, median values; error bars, mean ± SEM. n=biologically independent samples in individual patients. P values were determined two-tailed Mann Whitney test (a, b), one-way ANOVA (c), and log-rank test (d).
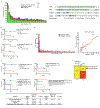
Extended Data Figure 3|. Neoantigen quantity and CD8+ T cell infiltrate identify long term pancreatic cancer survivors.
a, (left) Number of nonsynonymous, missense, and neoantigenic mutations per patient in the MSKCC cohort. Tick marks on the x-axis correspond to individual tumors. (right) Oncoprint demonstrating the frequency of oncogenic driver gene mutations in the MSKCC cohort. b, Overall survival of patients with tumors harboring greater than the median number of neoantigens (NeoantigenHi), and greater than the median intratumoral T cell repertoire polyclonality (PolyclonalHi), compared to all other patients (Rest). Neoantigens were determined using the MSKCC (top) and the pVAC-Seq (bottom) neoantigen prediction pipelines. c. Number of neoantigens per tumor as determined by the MSKCC and pVAC-Seq neoantigen calling pipelines (left). Tick marks on the x-axis correspond to individual tumors. Correlation matrix of neoantigens as determined by the MSKCC and pVAC-Seq neoantigen calling pipelines (right).Solid red line indicates line of best fit, dotted lines indicate 95% confidence intervals. d, Top: Overall survival of patients with tumors harboring greater or lesser than the median number of neoantigens (NeoantigenHi/Low) and CD3-CD8 double positive cells (CD3-CD8Hi/Low), compared to all other patients (Rest) (top left). Patients who did or did not receive adjuvant chemotherapy (adjuvant chemotherapy+/−, respectively) (top right), and all four groups (bottom) are also shown. Table shows univariate and multivariate Cox regression analysis of the associations of clinicopathologic features, adjuvant chemotherapy, and neoantigen-CD3-CD8 number with overall survival. e Distribution of tumors with high and low quality neoantigens in NeoantigenHi CD3-CD8Hi long term pancreatic cancer survivors compared to all other patients (Rest). n = biologically independent samples in individual patients. P-values were determined using log-rank (b, d), and Chi-square (e) tests.
Extended Data Figure 4|. Unique genomic features alone do not identify long term survivors.
a, Overall survival of patients with tumors harboring greater or lesser than the median number of neoantigens (NeoantigenHi/Low), CD3-CD8 double positive cells (CD3-CD8Hi/Low), polyclonality (PolyclonalHi/Low), mutations (MutationHi/Low), and CD4 single positive cells (CD4Hi/Low). b, Oncoprint demonstrating no difference in the frequency of oncogenic driver mutations in short and long term tumors. c, No difference in the number of nonsynonymous, missense, and immunogenic mutations (neoantigens) in short and long term PDAC tumors. d, Overall survival stratified by mutations in ARID1A, KRASQ61H, RBM10, and MLL-related genes (MLL, MLL2, MLL3, MLL5). Horizontal bars, median values. n = biologically independent samples in individual patients. P-values were determined using log-rank test (a, d).
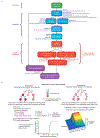
Extended Data Figure 5|. Neoantigen immune fitness models.
a, Comprehensive flowchart of neoantigen quality identification pipeline. Software programs utilized for each step are indicated in bold, colored text. Mathematical formulae for calculation of individual components of neoantigen quality are defined in Methods. All software components of the pipeline are published and/or publically available as indicated in italics above. b, (top) Schematic of neoantigen immune fitness models. Each circle represents a tumor clone in an evolutionary tree. Clones in both models are identical with respect to the number of mutations and neoantigens. Numbers represent hypothetical neoantigens gained in a successive tumor clone. Shades of red indicate immunogenicity of each clone, as ascribed by the two models, namely neoantigen quality or neoantigen quantity. (bottom) Parameters defining the quality score in the quality model (1–3). In (1), amino acid sequences of a hypothetical wild type (WT) epitope, tumor neoepitope, and a homologous microbial epitope are shown. Yellow highlights the changing amino acid between the WT and tumor sequence as a consequence of a tumor specific mutation. The amino acids in red indicate homology between the tumor neoepitope and the microbial epitope.
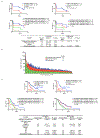
Extended Data Figure 6|. Neoantigen quality is independently prognostic of survival.
a, Overall survival of patients whose tumors displayed high compared to low neoantigen quality (Neoantigen QualityHi/Low) (top left). Overall survival of patient who did or did not receive adjuvant chemotherapy (top right). Overall survival of all four groups is shown at the bottom. Neoantigen quality defined by pipeline and schema as defined in Extended Data Figure 5a, b. Table shows univariate and multivariate Cox regression analysis of the associations of clinicopathologic features, adjuvant chemotherapy, and neoantigen quality with overall survival. Data include all patients in the whole exome sequencing MSKCC cohort. b, Number of nonsynonymous, missense, and neoantigenic mutations per patient in the ICGC cohort (n=166). c, Overall survival of patients in the ICGC cohort whose tumors displayed high compared to low neoantigen quality (Neoantigen QualityHi/Low) (top left). Overall survival of patients in the ICGC cohort stratified by adjuvant chemotherapy administration (top right). Overall survival of all four groups shown in bottom. Neoantigen quality defined by pipeline and schema as defined in Extended Data Figure 5a, b. Table shows univariate and multivariate Cox regression analysis of the associations of clinicopathologic features, adjuvant chemotherapy, and neoantigen quality with overall survival in the ICGC cohort. n = biologically independent samples in individual patients. P-values were determined using log-rank test (a, c).
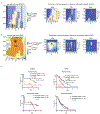
Extended Data Figure 7|. Stability of neoantigen quality model parameters on subsampled cohorts and prognostic dependence of neoantigen quality on infectious disease derived peptides.
Parameters of the neoantigen fitness quality model for a, the MSKCC cohort b, and the ICGC cohort (left). Log-rank test score landscape as a function of the model parameters, the horizontal alignment score displacement a, and the characteristic time τ, the significance of the score is denoted in the legend (right). Two dimensional histograms showing distributions of optimal parameters obtained on subsampled datasets with 50, 70, and 90% of patients left, over 500 iterations of subsampling at each frequency. c, Overall survival of patients in the MSKCC and ICGC cohort whole tumors displayed high compared to low neoantigen quality (Neoantigen QualityHi/Low) Neoantigen quality was calculated using alignment to immunogenic infectious disease-derived IEDB peptides (microbial peptides) or using alignment to immunogenic non-infectious disease-derived allergy/autoimmune peptides in the IEDB database (non-microbial peptides). n = biologically independent samples in individual patients. P-values were determined using log-rank test (c).
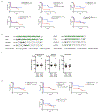
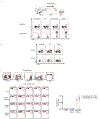
Extended Data Figure 8|. Predicted MUC16 neoantigens are recognized by the human TCR repertoire.
a, PBMCs pulsed with no peptide, control WT control peptide (WT), cross-reactive peptide (Cross Reactive), or high quality neopeptide (Mutant). Representative gating strategies for CD8+ T cell expansion, and degranulation are shown. b, PBMCs pulsed with no peptide, MUC16 neopeptides (Mutant), and control WT control peptide (WT). Representative gating strategies for CD8+ T cell expansion are shown. c, Representative gating strategy to identify CD8+ T cells in peripheral blood of healthy donors (top panel). Identification of CD8+ T cells in healthy donors reactive to unique MUC16 neoepitopes predicted to bind to the B∗0801 HLA-allele, using MUC16-neoepitope-HLA multimers. Quantification of all healthy donors (Neoepitope #1, 2 - n=5) is shown (right). Multimer staining is shown on the x-axis, CD8 is shown on the y-axis. Peptide information is provided in Supplementary Table 2. n = biologically independent samples in individual patients. Horizontal bars, median values; error bars, mean ± SEM. P-values were determined using one-way ANOVA (c).
Extended Data Figure 9|. Long term survivors do not display differences in MUC16 mutations, transcriptional regulators or downstream targets of MUC16, or differences in other mucins and tissue expression antigens.
a, The frequency of MUC16 mutations in short and long term PDAC tumors. Lollipop plot showing location of MUC16 mutations and neoantigens in short and long term pancreatic cancer survivors. b, (left) Bulk tumor MUC16 mRNA, and (middle) protein expression by immunohistochemistry. Immunohistochemical staining was repeated independently in triplicates for each patient. (right) MUC16 mutant allele frequency in non-hypermutated tumors with MUC16 mutations. c, (left) Frequency of patients with MUC16 neoantigens in MSKCC and ICGC cohorts. (middle) Frequency of patients with neoantigens in genes recurrently harboring neoantigens in >5% of patients in both MSKCC and ICGC cohorts. (right) Genes most frequently harboring neoantigens in the MSKCC cohort as determined by pVACSeq. Frequency of patients (y-axis) and raw numbers (above bar graphs) are indicated. d, mRNA expression of transcriptional activators of MUC16 (top left), mediators implicated in MUC16 dependent tumor progression (top right), and mRNA (bottom left) and protein (bottom right) of tissue expression antigens MUC1, MUC4, WT1, mesothelin, and Annexin A2 in short and long term tumors. WT1 protein was undetectable in both short and long term survivors. n=15 per group in top left, top right, and bottom left; short term n=45, long term n=51 in bottom right. e, MUC16 mRNA and protein expression in MUC16 non-mutated (WT; n=18 (top), n=20 (bottom)) and mutated (mutant; n=10 (top), n=9 (bottom)) tumors. f, TCRVβ sequencing of T cell product following peripheral blood T cells pulse with MUC16 neopeptides as in Figure 4e. Brown open circles – stable/contracted clones with mutant neopeptide; blue open circles – expanded clones with mutant neopeptide; red solid circles - expanded clones with mutant neopeptide detected in archival primary tumors. Arrows = clones in archival primary tumors with rank frequencies. Venn diagrams = clonal overlap in respective compartments. Horizontal bars, median values; error bars, mean ± SEM. n = biologically independent samples in individual patients. P-values were determined using two-tailed Mann Whitney and Students t-tests (b), Chi-square tests (c), and as described in the methods (f).
Extended Data Figure 10|. MUC16 mutations do not alter tumor cell-intrinsic MUC16 protein expression.
a, Representative immunohistochemical staining (left) and quantification (right) of MUC16 expression in tissue microarrays of short and long term pancreatic cancer survivors as assessed using three independent anti-MUC16 antibodies. Ab#1– clone EPSISR23, purchased from Abcam; Ab# 2 – polyclonal, purchased from Abcam ab133419; Ab#3 – clone 4H11. Each open circle represents the median expression of independent immunohistochemical staining performed in triplicates for each patient. b, Western blot (top) and immunocytochemistry (bottom) of untransfected (−), empty vector (vector), MUC16 wild type (MUC16 WT), and MUC16 mutant (MUC16 R15C) HEK293T cells. The top left blot was probed with anti MUC16 specific antibody (clone 4H1125) and the right blot with anti b-actin. Red rectangle indicates MUC16 specific band. All bottom cells were probed with anti MUC16 antibody (clone 4H1125). The inserted mutation was identical to a neoantigenic MUC16 mutation (Extended Data Figure 9a, Pt. 1). Data representative of two independent experiments with similar results. c, MUC16 immunohistochemistry on two long term pancreatic cancer survivors with MUC16 neoepitopes in primary resected tumors. Areas in rectangular low power fields are magnified on the right. Immunohistochemical staining was performed independently in triplicates for each patient in tissue microarrays, and confirmed with immunohistochemical staining on whole tumor sections (shown). Horizontal bars, median values; error bars, mean ± SEM. n = biologically independent samples in individual patients. P-values were determined using two-tailed Students t-tests (a).
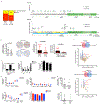
Figure 1:. Pancreatic cancer survivors display enhanced T cell immunity.
(a) Survival of MSKCC cohorts. (b) Quantification of CD8+ T cells using multiplexed immunohistochemistry. (c) T cell frequency, repertoire clonality and (d) clonal overlap in tumor and matched adjacent normal pancreatic tissues by TCR Vβ sequencing. (e) Intratumoral T cell repertoire clonality in tumors of short and long term survivors. Horizontal bars, median values. n = biologically independent samples in individual patients. P values were determined by log rank test (a), two-tailed Mann Whitney test (b), two-tailed paired (c) and two-tailed unpaired Student’s t-tests (e).
Figure 2:. Neoantigen quality is prognostic of survival.
(a) Survival of patients with tumors harboring both greater than the median number of neoantigens (NeoantigenHi), and CD3-CD8 double positive cells (CD3-CD8Hi), compared to all other patients (Rest), as determined by the MSKCC and pVAC-Seq neoantigen prediction pipelines. (b) Patient survival stratified by neoantigen quality and quantity in the MSKCC and ICGC cohorts. n = biologically independent samples in individual patients. P-values were determined using log-rank test (a, b).
Figure 3:. Neoantigen and cross reactive microbial peptide T cells detected in blood and tumors.
(a) Gene expression in the presence (red) or absence (gray) of high quality neoantigenic mutations. X axis = genes, shaded circles = biologically independent samples in individual patients (n=30). Median non-neoantigenic and neoantigenic expression (right). All high quality neoantigenic genes with available mRNA expression are shown. (b) Metastatic propagation of all clones in the primary tumor stratified by neoantigen quality. Mutant allele frequencies in matched primary-metastatic tumors (left) and metastatic tumors alone (right) are shown in biologically independent samples in one patient. (c, d) PBMCs pulsed with no (N), WT control (WT), cross reactive (CR), and high quality neo (M) peptide (n=7). (c) CD8+ T cell expansion and degranulation. (d) Clonal overlap of expanded T cell clones in (c) and archival tumors by TCR Vβ sequencing. Arrows = clones in archival primary tumors with rank frequencies. Venn diagrams show number of T cell clones expanding with mutant, and cross reactive peptides, their respective clonal overlap, and clonal overlap with archival primary tumors. Note presence of clones recognizing both neopeptides and cross reactive peptides in archival tumors. Years surviving following surgery are shown for each individual patient. NED = No Evidence of Disease, AWD = Alive with Disease. Horizontal bars, median values. Error bars, mean ± SEM. n = biologically independent samples in individual patients in a and c. P values were determined in (a) using two-tailed Student’s t test, in (b) using two-tailed Mann Whitney test, in (c) using one-way ANOVA with Tukey’s multiple comparison test, and in (d) as described in the Methods.
Figure 4:. MUC16 is a neoantigenic hotspot in pancreatic cancer survivors.
(a) Genes with neoantigens in >15% of patients. (b) MUC16 neoantigen frequency and (c) number. Short term n=32, long term n=26 in (a), (b), and (c). (d) Metastatic propagation of all clones in the primary tumor stratified by the presence/absence of MUC16 neoantigens. Mutant allele frequencies in matched primary-metastatic tumors (left) and metastatic tumors alone (far right) are shown in biologically independent samples in four patients. (e) CD8+ T cell degranulation in PBMCs pulsed with no peptide (None), MUC16 neopeptide (Mutant), and control WT peptide (WT). Data in (e) are representative of two independent experiments with similar results. n = biologically independent samples in individual patients. Horizontal bars, median values. Error bars, mean ± SEM. P values were determined in (a, b) using two-sided Chi-square test, in (c, d) using two-tailed Mann-Whitney test, and in (e) using two-way ANOVA with Tukey’s multiple comparison test.
Comment in
- How T cells spot tumour cells.
Sarkizova S, Hacohen N. Sarkizova S, et al. Nature. 2017 Nov 23;551(7681):444-446. doi: 10.1038/d41586-017-07267-9. Nature. 2017. PMID: 29168843 No abstract available. - Immunotherapy: Relying on quality over quantity.
Romero D. Romero D. Nat Rev Clin Oncol. 2018 Jan;15(1):6-7. doi: 10.1038/nrclinonc.2017.189. Epub 2017 Nov 28. Nat Rev Clin Oncol. 2018. PMID: 29182163 No abstract available. - Pancreatic cancer: Next-generation algorithms for neoantigen selection.
Hopkins A, Jaffee E. Hopkins A, et al. Nat Rev Gastroenterol Hepatol. 2018 Mar;15(3):135-136. doi: 10.1038/nrgastro.2017.184. Epub 2018 Jan 10. Nat Rev Gastroenterol Hepatol. 2018. PMID: 29317775 Free PMC article.
Similar articles
- Neoantigen quality predicts immunoediting in survivors of pancreatic cancer.
Łuksza M, Sethna ZM, Rojas LA, Lihm J, Bravi B, Elhanati Y, Soares K, Amisaki M, Dobrin A, Hoyos D, Guasp P, Zebboudj A, Yu R, Chandra AK, Waters T, Odgerel Z, Leung J, Kappagantula R, Makohon-Moore A, Johns A, Gill A, Gigoux M, Wolchok J, Merghoub T, Sadelain M, Patterson E, Monasson R, Mora T, Walczak AM, Cocco S, Iacobuzio-Donahue C, Greenbaum BD, Balachandran VP. Łuksza M, et al. Nature. 2022 Jun;606(7913):389-395. doi: 10.1038/s41586-022-04735-9. Epub 2022 May 19. Nature. 2022. PMID: 35589842 Free PMC article. - Induction of cancer neoantigens facilitates development of clinically relevant models for the study of pancreatic cancer immunobiology.
Panni UY, Chen MY, Zhang F, Cullinan DR, Li L, James CA, Zhang X, Rogers S, Alarcon A, Baer JM, Zhang D, Gao F, Miller CA, Gong Q, Lim KH, DeNardo DG, Goedegebuure SP, Gillanders WE, Hawkins WG. Panni UY, et al. Cancer Immunol Immunother. 2023 Aug;72(8):2813-2827. doi: 10.1007/s00262-023-03463-x. Epub 2023 May 13. Cancer Immunol Immunother. 2023. PMID: 37179276 Free PMC article. - Combining STING-based neoantigen-targeted vaccine with checkpoint modulators enhances antitumor immunity in murine pancreatic cancer.
Kinkead HL, Hopkins A, Lutz E, Wu AA, Yarchoan M, Cruz K, Woolman S, Vithayathil T, Glickman LH, Ndubaku CO, McWhirter SM, Dubensky TW Jr, Armstrong TD, Jaffee EM, Zaidi N. Kinkead HL, et al. JCI Insight. 2018 Oct 18;3(20):e122857. doi: 10.1172/jci.insight.122857. JCI Insight. 2018. PMID: 30333318 Free PMC article. - Neoantigen-based immunotherapy in pancreatic ductal adenocarcinoma (PDAC).
Chen H, Yang G, Xiao J, Zheng L, You L, Zhang T. Chen H, et al. Cancer Lett. 2020 Oct 10;490:12-19. doi: 10.1016/j.canlet.2020.06.011. Epub 2020 Jun 23. Cancer Lett. 2020. PMID: 32590021 Review. - Neoantigen prediction and computational perspectives towards clinical benefit: recommendations from the ESMO Precision Medicine Working Group.
De Mattos-Arruda L, Vazquez M, Finotello F, Lepore R, Porta E, Hundal J, Amengual-Rigo P, Ng CKY, Valencia A, Carrillo J, Chan TA, Guallar V, McGranahan N, Blanco J, Griffith M. De Mattos-Arruda L, et al. Ann Oncol. 2020 Aug;31(8):978-990. doi: 10.1016/j.annonc.2020.05.008. Epub 2020 Jun 28. Ann Oncol. 2020. PMID: 32610166 Free PMC article.
Cited by
- Tumor-Infiltrating Leukocyte Phenotypes Distinguish Outcomes in Related Patients With Pancreatic Adenocarcinoma.
Link JM, Liudahl SM, Betts CB, Sivagnanam S, Leis KR, McDonnell M, Pelz CR, Johnson B, Hamman KJ, Keith D, Sampson JE, Morgan TK, Lopez CD, Coussens LM, Sears RC. Link JM, et al. JCO Precis Oncol. 2021 Feb 5;5:PO.20.00287. doi: 10.1200/PO.20.00287. eCollection 2021. JCO Precis Oncol. 2021. PMID: 34036232 Free PMC article. No abstract available. - Identification and validation of viral antigens sharing sequence and structural homology with tumor-associated antigens (TAAs).
Ragone C, Manolio C, Cavalluzzo B, Mauriello A, Tornesello ML, Buonaguro FM, Castiglione F, Vitagliano L, Iaccarino E, Ruvo M, Tagliamonte M, Buonaguro L. Ragone C, et al. J Immunother Cancer. 2021 May;9(5):e002694. doi: 10.1136/jitc-2021-002694. J Immunother Cancer. 2021. PMID: 34049932 Free PMC article. - Distinct Stromal and Immune Features Collectively Contribute to Long-Term Survival in Pancreatic Cancer.
Sadozai H, Acharjee A, Eppenberger-Castori S, Gloor B, Gruber T, Schenk M, Karamitopoulou E. Sadozai H, et al. Front Immunol. 2021 Feb 19;12:643529. doi: 10.3389/fimmu.2021.643529. eCollection 2021. Front Immunol. 2021. PMID: 33679807 Free PMC article. Clinical Trial. - Regulation and modulation of antitumor immunity in pancreatic cancer.
Leinwand J, Miller G. Leinwand J, et al. Nat Immunol. 2020 Oct;21(10):1152-1159. doi: 10.1038/s41590-020-0761-y. Epub 2020 Aug 17. Nat Immunol. 2020. PMID: 32807942 Review. - The Association Between Inflammation and Immunosuppression: Implications for ICI Biomarker Development.
Sacdalan DB, Lucero JA. Sacdalan DB, et al. Onco Targets Ther. 2021 Mar 18;14:2053-2064. doi: 10.2147/OTT.S278089. eCollection 2021. Onco Targets Ther. 2021. PMID: 33776452 Free PMC article. Review.
References
- Bindea G et al. Spatiotemporal Dynamics of Intratumoral Immune Cells Reveal the Immune Landscape in Human Cancer. Immunity 39, 782–795 (2013). - PubMed
Publication types
MeSH terms
Substances
Grants and funding
- T32 CA009501/CA/NCI NIH HHS/United States
- 15678/CRUK_/Cancer Research UK/United Kingdom
- K12CA184746-01A1/CA/NCI NIH HHS/United States
- P01 CA087497/CA/NCI NIH HHS/United States
- R01DK097087-01/NH/NIH HHS/United States
- 17263/CRUK_/Cancer Research UK/United Kingdom
- K12 CA184746/CA/NCI NIH HHS/United States
- R01 CA190400/CA/NCI NIH HHS/United States
- P30 CA08748/CA/NCI NIH HHS/United States
- R01 DK097087/DK/NIDDK NIH HHS/United States
- P30 CA008748/CA/NCI NIH HHS/United States
LinkOut - more resources
Full Text Sources
Other Literature Sources
Medical
Molecular Biology Databases
Research Materials
Miscellaneous
