xCell: digitally portraying the tissue cellular heterogeneity landscape - PubMed (original) (raw)
xCell: digitally portraying the tissue cellular heterogeneity landscape
Dvir Aran et al. Genome Biol. 2017.
Abstract
Tissues are complex milieus consisting of numerous cell types. Several recent methods have attempted to enumerate cell subsets from transcriptomes. However, the available methods have used limited sources for training and give only a partial portrayal of the full cellular landscape. Here we present xCell, a novel gene signature-based method, and use it to infer 64 immune and stromal cell types. We harmonized 1822 pure human cell type transcriptomes from various sources and employed a curve fitting approach for linear comparison of cell types and introduced a novel spillover compensation technique for separating them. Using extensive in silico analyses and comparison to cytometry immunophenotyping, we show that xCell outperforms other methods. xCell is available at http://xCell.ucsf.edu/ .
Conflict of interest statement
Ethics approval and consent to participate
Not applicable.
Competing interests
The authors declare that they have no competing interests.
Publisher's Note
Springer Nature remains neutral with regard to jurisdictional claims in published maps and institutional affiliations.
Figures
Fig. 1
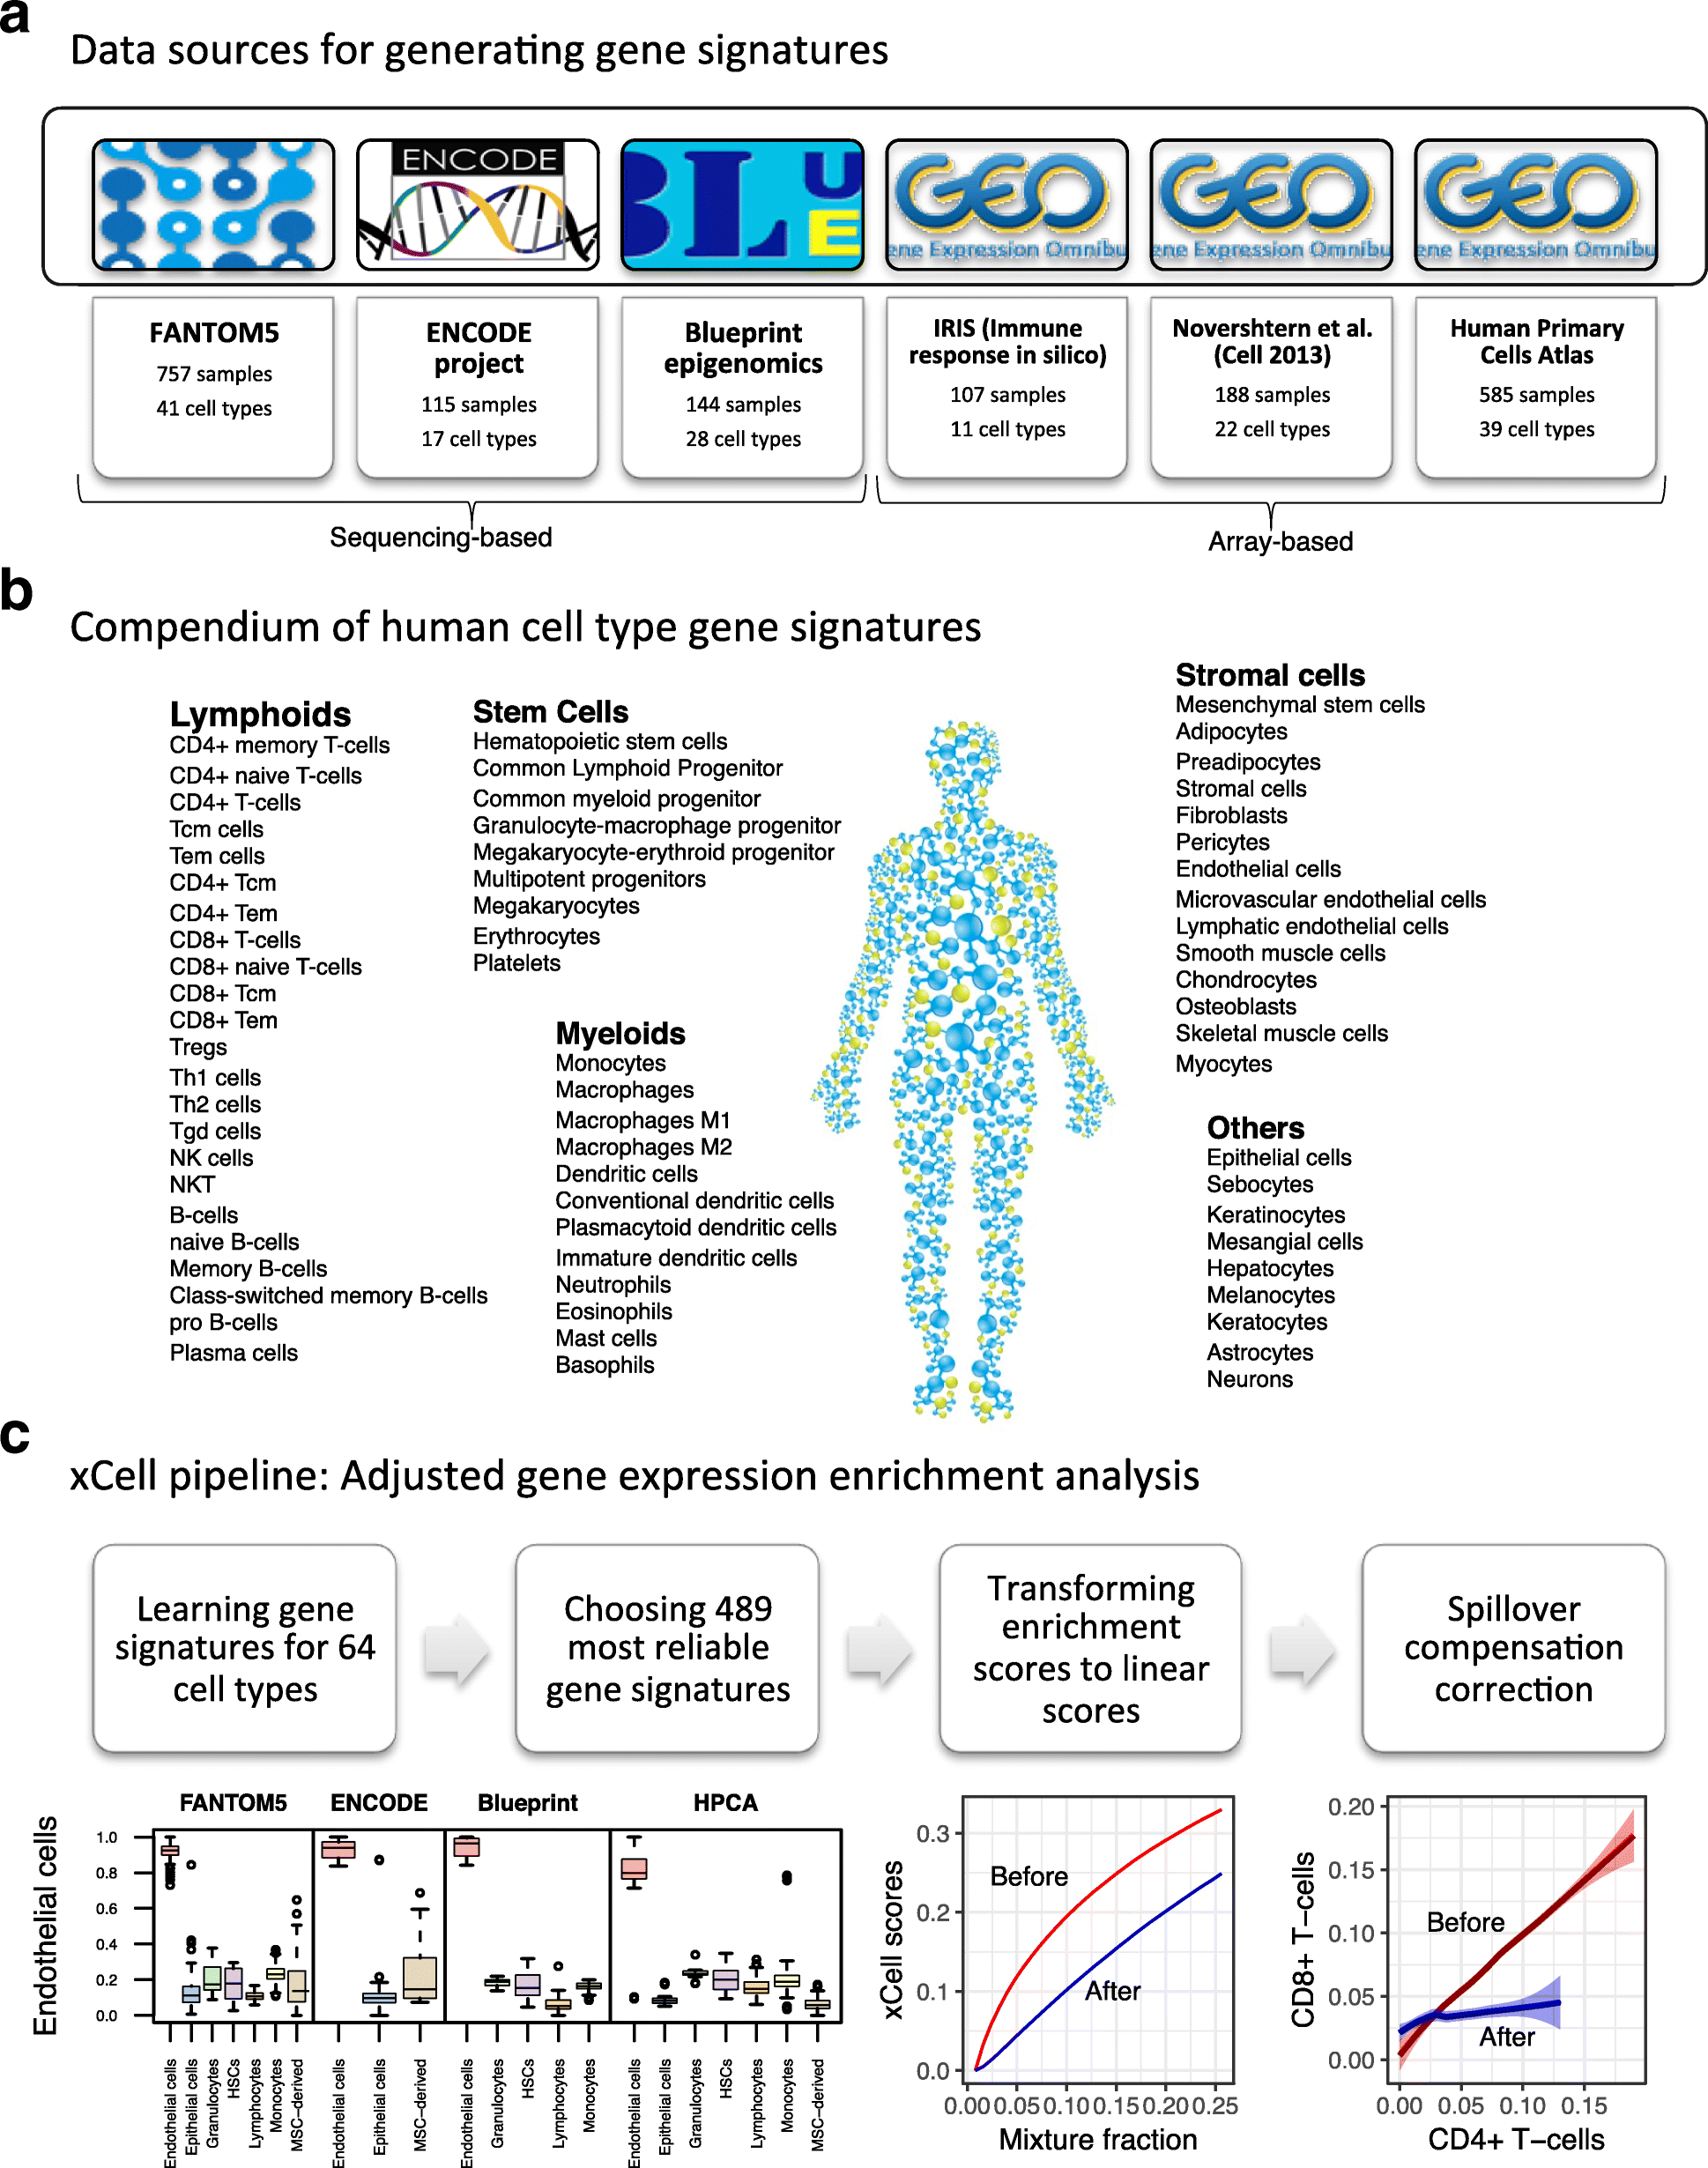
xCell study design. a A summary of the data sources used in the study to generate the gene signatures, showing the number of pure cell types and number of samples curated from them. b Our compendium of 64 human cell type gene signatures grouped into five cell type families. c The xCell pipeline. Using the data sources and based on different thresholds, we derived gene signatures for 64 cell types. Of this collection of 6573 signatures, we chose the 489 most reliable cell types, three for each cell type from each data source where available. The raw score is then the average single-sample GSEA (ssGSEA) score of all signatures corresponding to the cell type. Using simulations of gene expression for each cell type, we derived a function to transform the non-linear association between the scores to a linear scale. Using the simulations we also derive the dependencies between cell type scores and apply a spillover compensation method to adjust the scores
Fig. 2
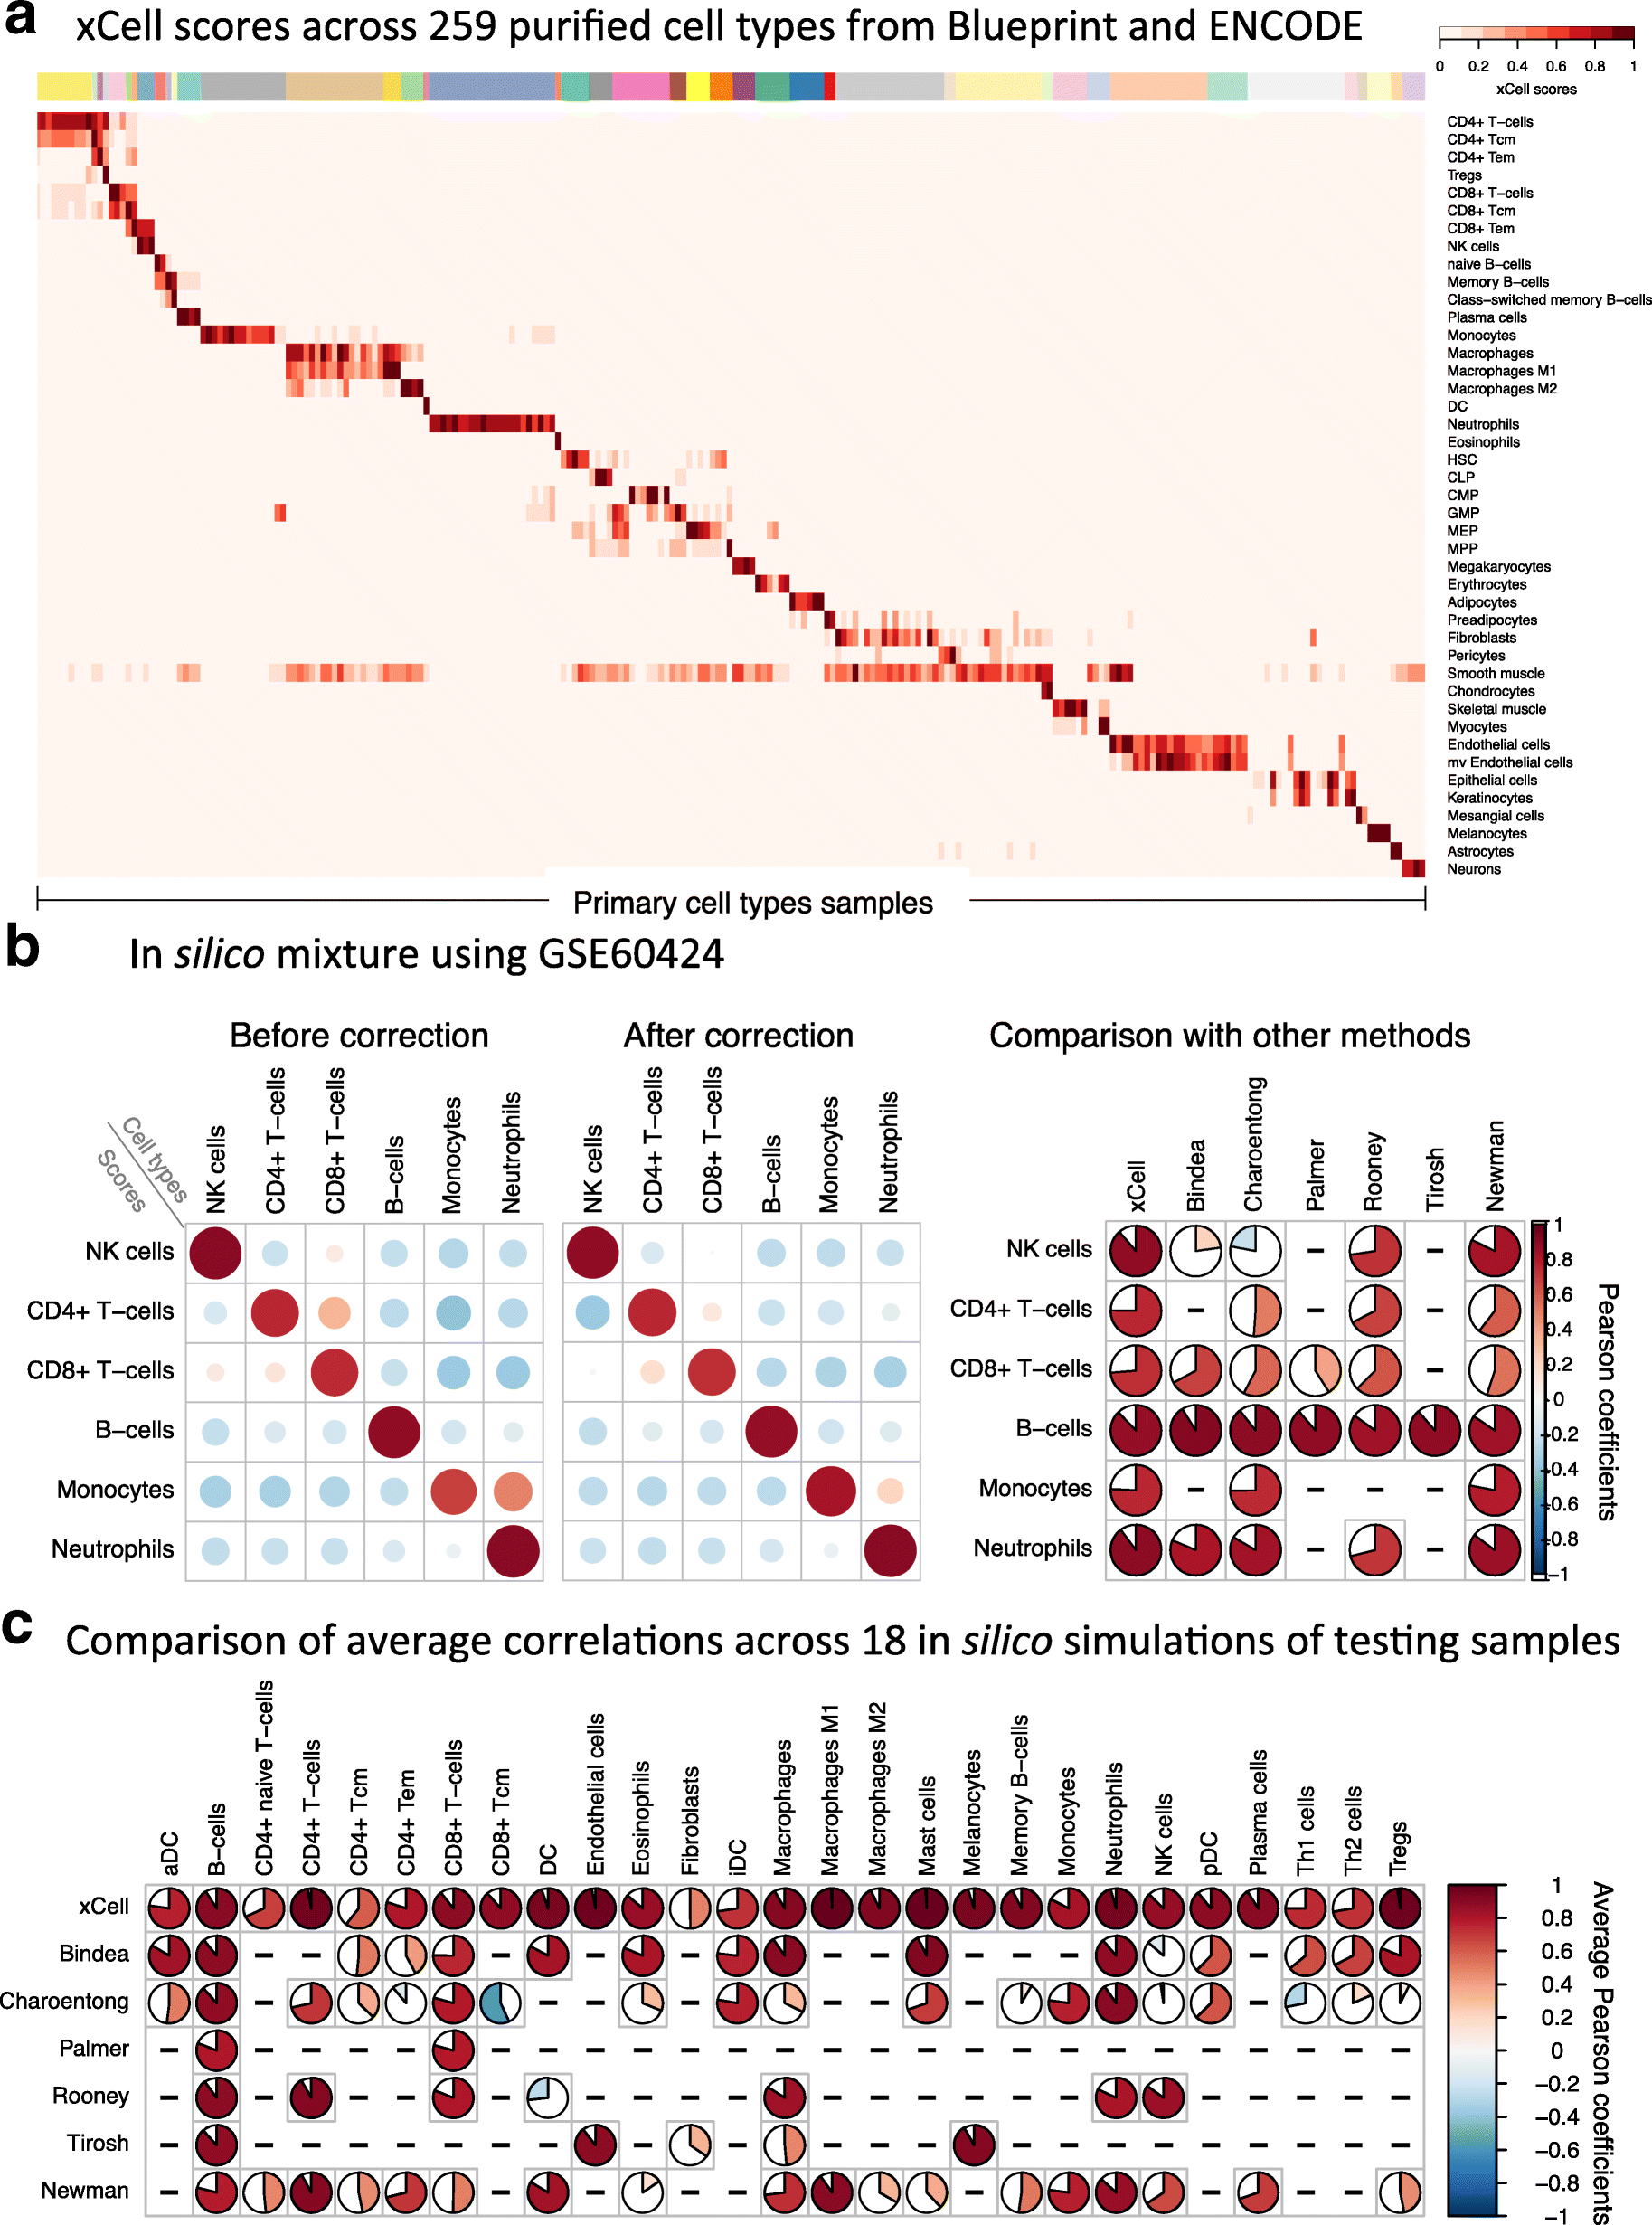
Evaluation of the performance of xCell using simulated mixtures. a An overview of adjusted scores for 43 cell types in 259 purified cell type samples from the Blueprint and ENCODE data sources (other data sources are in Additional file 2: Figure S4). Most signatures clearly distinguish the corresponding cell type from all other cell types. b A simulation analysis using GSE60424 as the data source [26], which was not used in the development of xCell. This data source contains 114 RNA-seq samples from six major immune cell types. Left: Pearson correlation coefficients using our method before spillover adjustment and after the adjustment. Dependencies between CD4+ T cells, CD8+ T cells, and NK cells were greatly reduced; spillover from monocytes to neutrophils was also removed. Right: Comparison of the correlation coefficients across the different methods. The first column corresponds to xCell’s predictions of the underlying abundances of the cell types in the simulations (both color and pie chart correspond to average Pearson coefficients). Bindea, Charoentong, Palmer, Rooney, and Tirosh represent sets of signatures for cell types from the corresponding manuscripts. Newman refers to the inferences produced using CIBERSORT on the simulations. xCell outperformed the other methods in 17 of 18 comparisons. c Comparison of the correlation coefficients across the different methods based on 18 simulations generated using the left-out testing samples. Here rows correspond to methods and columns show the average Pearson coefficient for the corresponding cell type across the simulations. Independent simulations are available in Additional file 2: Figure S6. xCell outperformed the other methods in 64 of 67 comparisons
Fig. 3
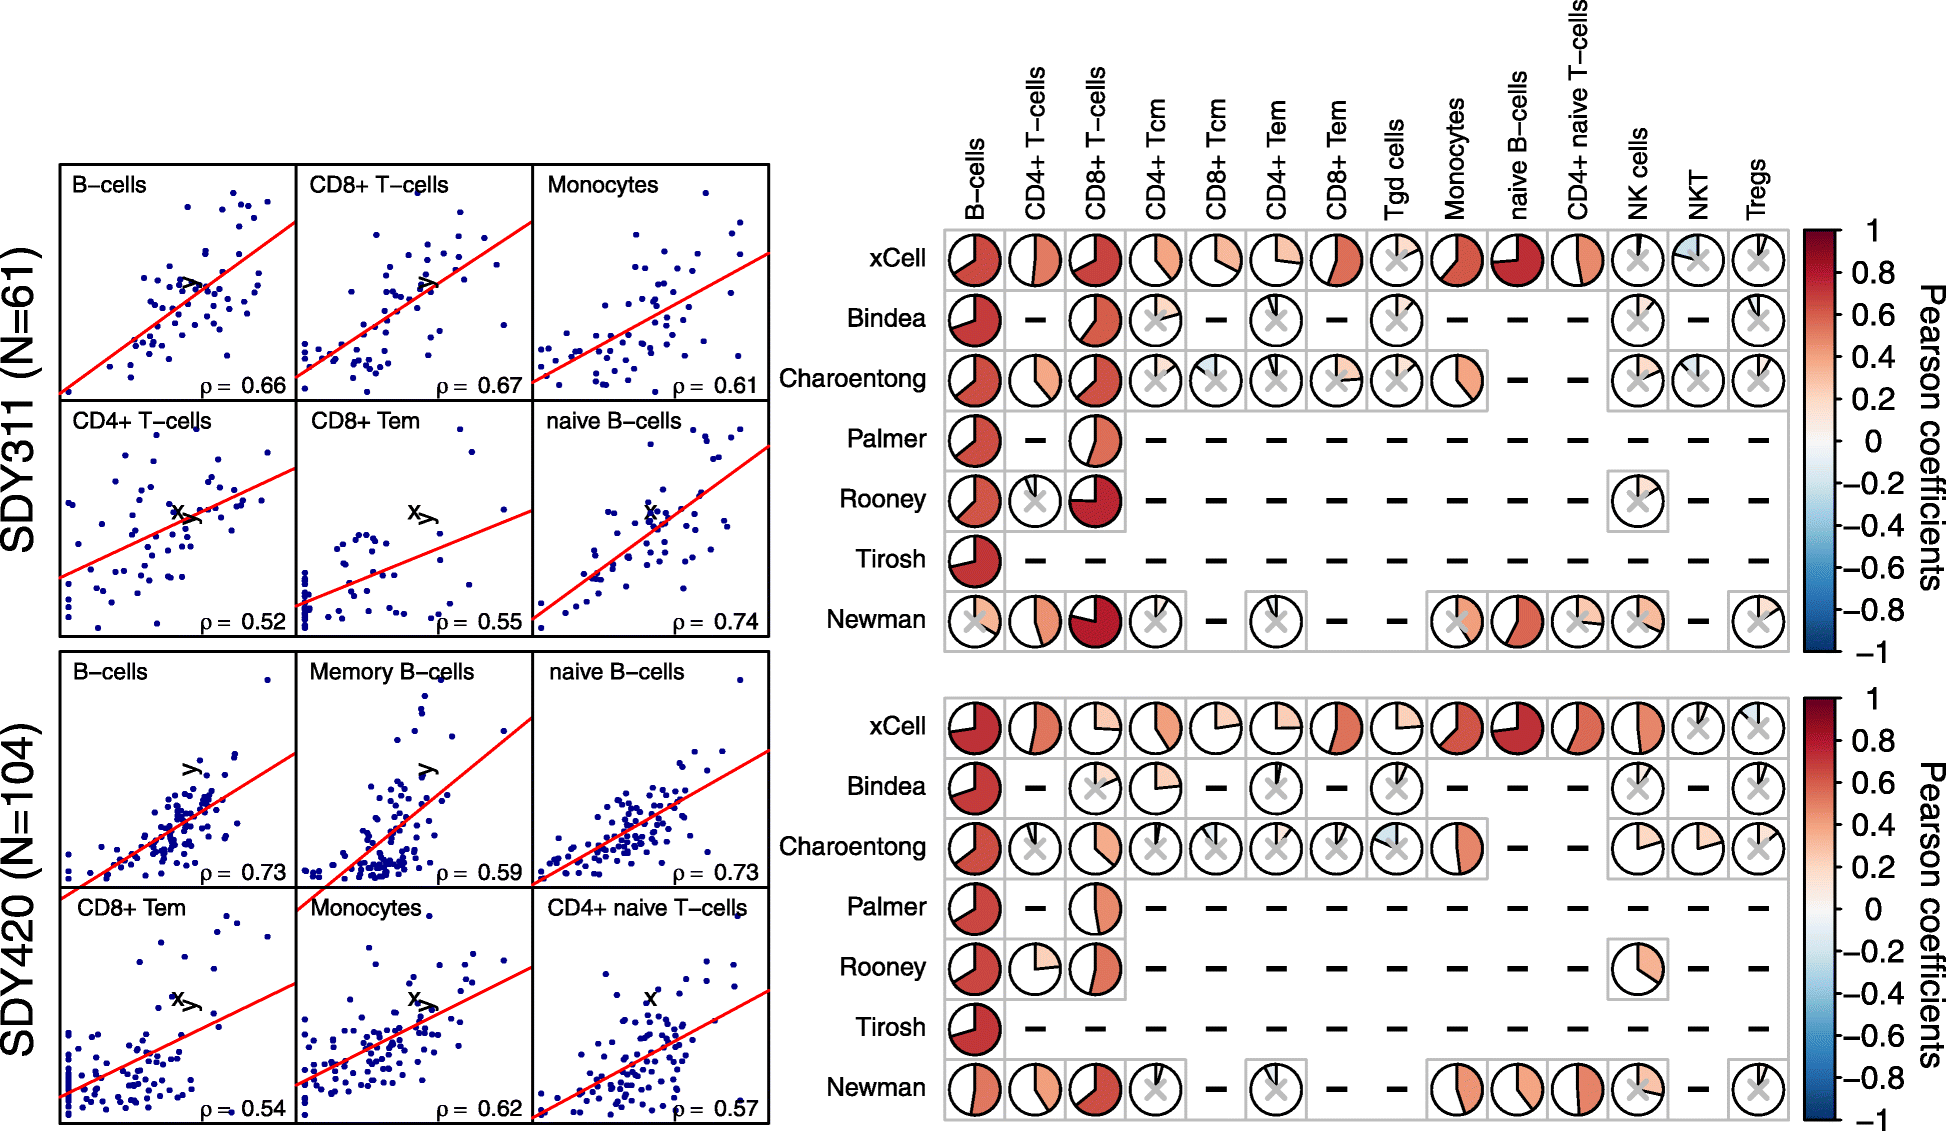
Comparison of digital dissection methods with flow cytometry counts. Left: Scatter plots of CyTOF fractions in PBMCs vs. cell type scores from whole blood of 61 samples from SDY311 (top) and 104 samples from SDY420 (bottom). Only the top correlating cell types in each study are shown. Right: Correlation coefficients produced by our method compared to other methods. Only cell types with abundance of at least 1% on average, as measured by CyTOF, are shown. Non-significant correlations (p value < 0.05) are marked with a gray “_x_”
Fig. 4
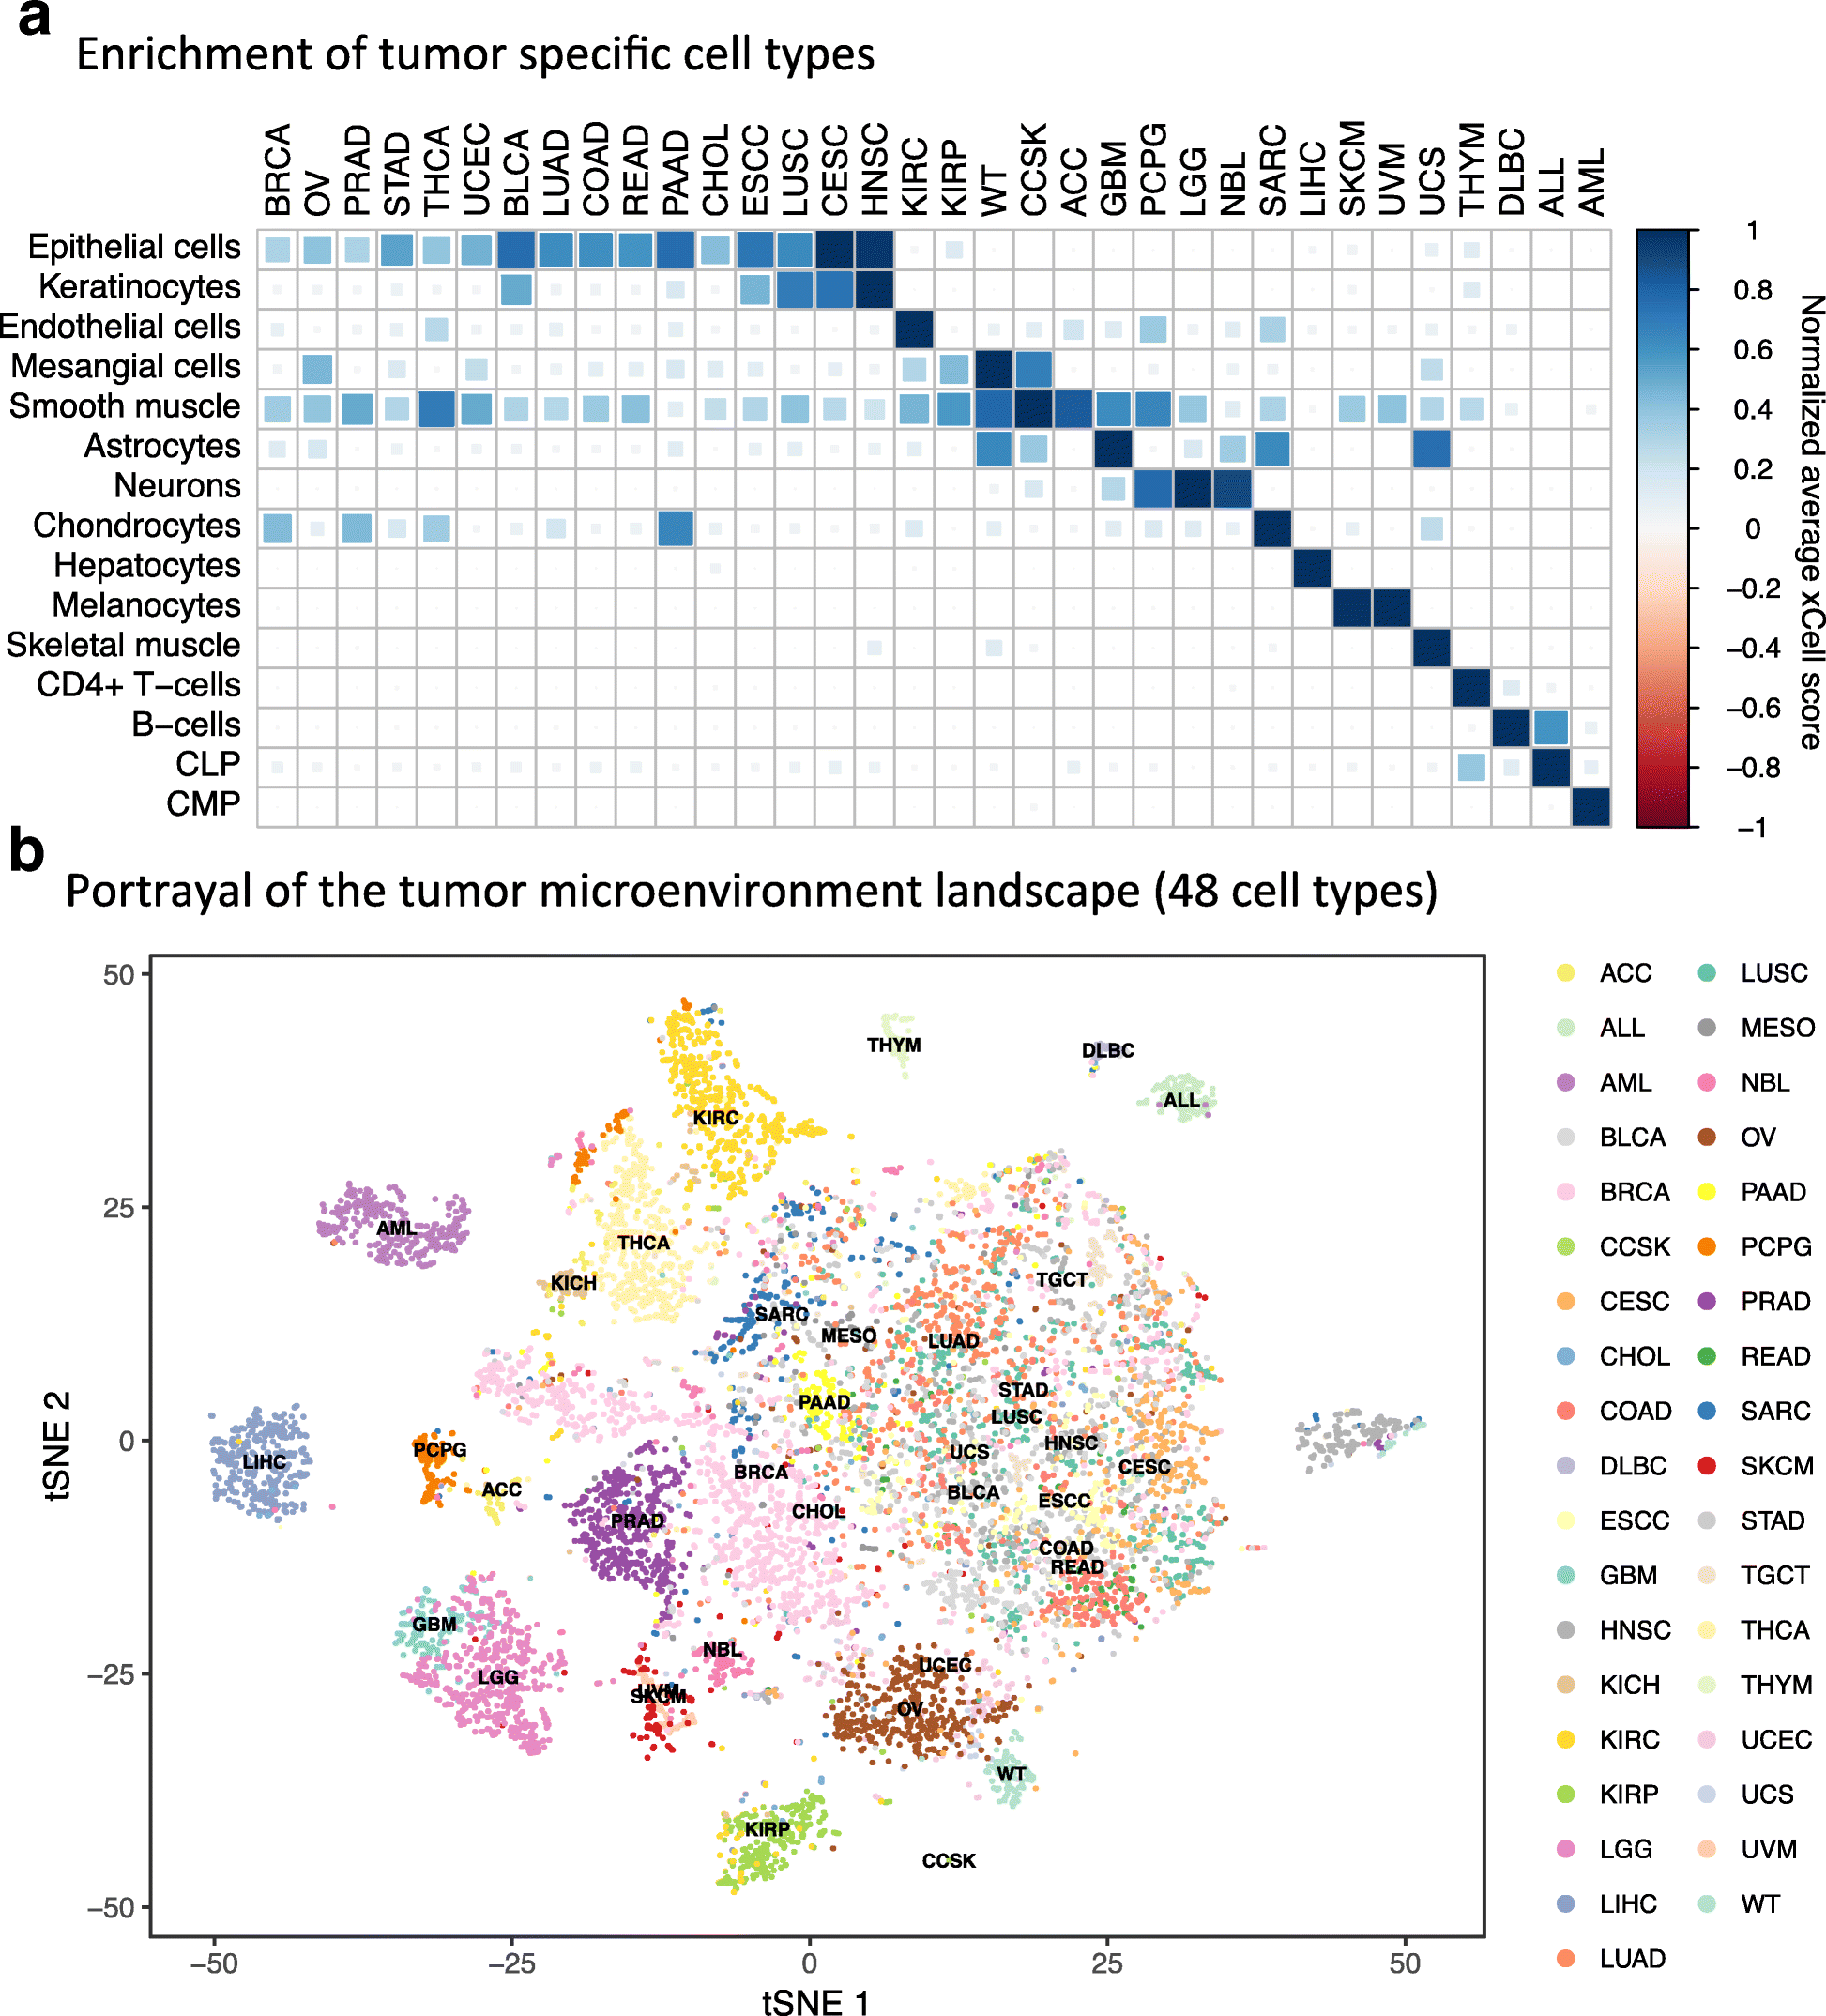
Cell type enrichment analysis in tumors. a Average scores for nine cell types across 24 cancer types from TCGA (The Cancger Genome Atlas). Scores were normalized across rows. Signatures were chosen such that they are the cell of origin of a cancer type or the most significant signature of the cancer type compared to all others. b t-SNE (t-Distributed Stochastic Neighbor Embedding) plot of 8875 primary cancer samples from TCGA (The Cancger Genome Atlas) and TARGET colored by cancer type. The t-SNE plot was generated using the enrichment scores of 48 non-epithelial, non-stem cell, and non-cell type-specific scores. Many of the cancer types create distinct clusters, emphasizing the important role of the tumor microenvironment in characterizing tumors
Similar articles
- Cell-Type Enrichment Analysis of Bulk Transcriptomes Using xCell.
Aran D. Aran D. Methods Mol Biol. 2020;2120:263-276. doi: 10.1007/978-1-0716-0327-7_19. Methods Mol Biol. 2020. PMID: 32124326 - In silico microdissection of microarray data from heterogeneous cell populations.
Lähdesmäki H, Shmulevich L, Dunmire V, Yli-Harja O, Zhang W. Lähdesmäki H, et al. BMC Bioinformatics. 2005 Mar 14;6:54. doi: 10.1186/1471-2105-6-54. BMC Bioinformatics. 2005. PMID: 15766384 Free PMC article. - Robust enumeration of cell subsets from tissue expression profiles.
Newman AM, Liu CL, Green MR, Gentles AJ, Feng W, Xu Y, Hoang CD, Diehn M, Alizadeh AA. Newman AM, et al. Nat Methods. 2015 May;12(5):453-7. doi: 10.1038/nmeth.3337. Epub 2015 Mar 30. Nat Methods. 2015. PMID: 25822800 Free PMC article. - Patterns of ribosomal protein expression specify normal and malignant human cells.
Guimaraes JC, Zavolan M. Guimaraes JC, et al. Genome Biol. 2016 Nov 24;17(1):236. doi: 10.1186/s13059-016-1104-z. Genome Biol. 2016. PMID: 27884178 Free PMC article. - Recent advances in flow cytometric techniques for cancer detection and prognosis.
McCoy JP Jr, Carey JL. McCoy JP Jr, et al. Immunol Ser. 1990;53:171-87. Immunol Ser. 1990. PMID: 2100554 Review.
Cited by
- BCL3, GBP1, IFI16, and CCR1 as potential brain-derived biomarkers for parietal grey matter lesions in multiple sclerosis.
Guo H, Li Z, Wang Y. Guo H, et al. Sci Rep. 2024 Nov 18;14(1):28543. doi: 10.1038/s41598-024-76949-y. Sci Rep. 2024. PMID: 39557900 - Integrated proteomics and scRNA-seq analyses of ovarian cancer reveal molecular subtype-associated cell landscapes and immunotherapy targets.
Tan R, Wen M, Yang W, Zhan D, Zheng N, Liu M, Zhu F, Chen X, Wang M, Yang S, Xie B, He Q, Yuan K, Sun L, Wang Y, Qin J, Zhang Y. Tan R, et al. Br J Cancer. 2024 Nov 15. doi: 10.1038/s41416-024-02894-2. Online ahead of print. Br J Cancer. 2024. PMID: 39548315 - Peripheral immune cell abundance differences link blood mitochondrial DNA copy number and Parkinson's disease.
Wang L, Han J, Fearnley LG, Milton M, Rafehi H, Reid J, Gerring ZF, Masaldan S, Lang T, Speed TP, Bahlo M. Wang L, et al. NPJ Parkinsons Dis. 2024 Nov 14;10(1):219. doi: 10.1038/s41531-024-00831-x. NPJ Parkinsons Dis. 2024. PMID: 39543161 Free PMC article. - Integrated bioinformatics analysis for identifying fibroblast-associated biomarkers and molecular subtypes in human membranous nephropathy.
Gui C, Liu S, Fu Z, Li H, Zhang D, Deng Y. Gui C, et al. Heliyon. 2024 Sep 25;10(21):e38424. doi: 10.1016/j.heliyon.2024.e38424. eCollection 2024 Nov 15. Heliyon. 2024. PMID: 39524772 Free PMC article. - Machine learning unveils key Redox signatures for enhanced breast Cancer therapy.
Wang T, Wang S, Li Z, Xie J, Du K, Hou J. Wang T, et al. Cancer Cell Int. 2024 Nov 9;24(1):368. doi: 10.1186/s12935-024-03534-8. Cancer Cell Int. 2024. PMID: 39522039 Free PMC article.
References
Publication types
MeSH terms
Grants and funding
- HHSN272201200028C/AI/NIAID NIH HHS/United States
- U24 CA195858/CA/NCI NIH HHS/United States
- U24 CA195858/National Cancer Institute (US)/International
- HHSN272201200028C/Division of Intramural Research, National Institute of Allergy and Infectious Diseases (US)/International
LinkOut - more resources
Full Text Sources
Other Literature Sources


