Exosomal cargo including microRNA regulates sensory neuron to macrophage communication after nerve trauma - PubMed (original) (raw)
doi: 10.1038/s41467-017-01841-5.
Karli Montague 1, Hefin R Jones 2, Laura Castaldi 3, David Chambers 1, Jayne H Kelleher 1, Valentina Vacca 1 4, Thomas Pitcher 1, John Grist 1, Hadil Al-Ahdal 5, Liang-Fong Wong 5, Mauro Perretti 2, Johnathan Lai 6, Peter Mouritzen 6, Paul Heppenstall 3, Marzia Malcangio 7
Affiliations
- PMID: 29176651
- PMCID: PMC5701122
- DOI: 10.1038/s41467-017-01841-5
Exosomal cargo including microRNA regulates sensory neuron to macrophage communication after nerve trauma
Raffaele Simeoli et al. Nat Commun. 2017.
Abstract
Following peripheral axon injury, dysregulation of non-coding microRNAs (miRs) occurs in dorsal root ganglia (DRG) sensory neurons. Here we show that DRG neuron cell bodies release extracellular vesicles, including exosomes containing miRs, upon activity. We demonstrate that miR-21-5p is released in the exosomal fraction of cultured DRG following capsaicin activation of TRPV1 receptors. Pure sensory neuron-derived exosomes released by capsaicin are readily phagocytosed by macrophages in which an increase in miR-21-5p expression promotes a pro-inflammatory phenotype. After nerve injury in mice, miR-21-5p is upregulated in DRG neurons and both intrathecal delivery of a miR-21-5p antagomir and conditional deletion of miR-21 in sensory neurons reduce neuropathic hypersensitivity as well as the extent of inflammatory macrophage recruitment in the DRG. We suggest that upregulation and release of miR-21 contribute to sensory neuron-macrophage communication after damage to the peripheral nerve.
Conflict of interest statement
J.L. and P.M. are employees of Exiqon A/S. The remaining authors declare no competing financial interests.
Figures
Fig. 1
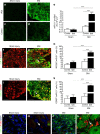
Expression of miR-21 is increased in DRG neurons following spared nerve injury. a–d Upregulation of miR-21 expression detected by fluorescence in situ hybridization (FISH) in ipsilateral L5 DRG neurons 7 days after SNI compared to sham injury and contralateral DRG neurons. Scale bar = 100 μm. e Quantification of miR-21+ neurons in L4/5 DRG. f, g Immunostaining for large-diameter DRG neurons (NF-200, red) and FISH for miR-21 (green) in sham and SNI ipsilateral L5 DRG. Scale bar = 100 μm. h Quantification of large cell bodies NF-200+ neurons that also express miR-21 in L4/5 DRG. i, j Immunostaining of small-diameter DRG neurons (CGRP, red) and FISH for miR-21 (green) in sham and SNI ipsilateral L5 DRG. Scale bar = 100 μm. k Quantification of CGRP+ neurons that also express miR-21 in L4/5 DRG. l–o Immunostaining of macrophages (F4/80+ cells, red), FISH for miR-21 (green), and nuclei (4',6-diamidino-2-phenylindole (DAPI), blue) in sham and SNI DRG. Scale bar = 100 μm. m, o Representative example of high-magnification merge (×63), a puncta (yellow) can be seen in macrophages (F4/80+ red cells), scale bar = 10 μm. Data are means ± S.E.M., n = 3 mice/group. ***P < 0.001, one-way ANOVA, post hoc Bonferroni
Fig. 2
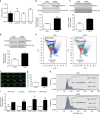
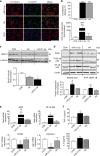
Capsaicin induces release of extracellular vesicles that include exosomes containing miRs from sensory neurons in culture. a Intracellular expression of miRs 21-5p, Let7b-5p, 124-3p, and 134-5p normalized to SNORD 202 (housekeeping non-coding RNA; n = 5 cultures). b–d Representative western blot and quantification of exosomal markers TSG101, Flotillin-1, and MFG-E8 in the culture media of DRG neurons incubated with buffer control (0.001% dimethyl sulphoxide (DMSO) in HEPES buffer + glucose 1 mg/ml; CON) or Capsaicin (1 µM; CAPS) for 3 h. Data are means ± S.E.M., n = 4 cultures; *P < 0.05 and **P < 0.01 compared to control, Student’s _t-_test. e–g ImageStream™ analyses. e Pseudocolour dot plots of carboxyfluorescein succinimidyl ester (CFSE) fluorescence against side scatter (SSC) for EVs isolated from culture media of neurons incubated with buffer control or CAPS for 3 h. f, g Representative images and quantification of EVs. Data are means ± S.E.M., n = 4 cultures; **P < 0.01 compared to control, Student’s _t_-test. h NanoSight detection of exosomes isolated from culture media of neurons incubated with buffer control or CAPS for 3 h. Representative outcome is shown. Each colored line represents a single frame recording with a total of 3 frames for each sample. The inset data indicate mean diameter, mode diameter and D90 values represent the diameter of 90% of the particles. i Expression of miRs 21-5p, Let7b-5p, 124-3p and 134-5p in the exosomal fraction of DRG neurons media treated with buffer control or CAPS for 3 h. Data are means ± S.E.M., n = 4 cultures; *P < 0.05, **P < 0.01 and ***P < 0.001 compared to control, Student’s t test
Fig. 3
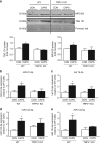
Exosomes release from sensory neurons is mediated by TRPV1 activation. a Representative western blot image and quantification of exosomal markers TSG101 and MFG-E8, in the media of cultured DRG neurons obtained from WT and TRPV1 KO mice and incubated with buffer control or CAPS for 3 h. b–e Expression of miRs in exosomal fraction of DRG media obtained from WT and TRPV1 KO mice. Data are means ± S.E.M., n = 4. *P < 0.05 compared to control WT, one-way ANOVA, post hoc Bonferroni test
Fig. 4
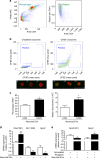
Exosomes released from pure sensory neurons after capsaicin are phagocytosed by macrophages. a, b Representative scatterplots (gating strategy) and ImageStreamTM images showing EVs (CFSE-labeled, green) uptake by macrophages (F4/80+, red). EVs were isolated from culture media after incubation of pure DRG neurons with buffer control or CAPS for 3 h. c Percentage-positive and median fluorescence intensity of CFSE+ macrophages incubated with neuron-derived EVs. Data are means ± S.E.M., n = 4. *P < 0.05, compared to control, Student’s _t-_test. d Nos2, Mrc1, and Spry2 mRNA expression levels in macrophages incubated with and without exosomes derived from CAPS-treated pure DRG neurons. e Nos2 and Spry2 mRNA expression levels in macrophages transfected with miR-21-5p antagomir or scrambled oligomer and incubated with EVs derived from CAPS-treated pure DRG neurons. Data are means ± S.E.M., n = 3; *P < 0.05 and **P < 0.01 Student’s _t-_test
Fig. 5
Expression of miR-21-5p is increased in antagomir-transfected macrophages exposed to capsaicin-released exosomes. a Peritoneal macrophage intracellular expression of miRs 21-5p, Let7b-5p, 155-5p, and 134-5p normalized to SNORD 202 (housekeeping non-coding RNA; n = 4 cultures). b miR-21-5p expression in macrophages transfected with miR-21-5p antagomir or scrambled oligomer and incubated with or without EVs derived from CAPS-treated pure DRG neurons. c miR-21-5p expression in macrophages transfected with miR-21-5p antagomir or scrambled oligomer and incubated with or without miR-21-overexpressing EVs derived from CAPS-treated DRG neurons. Data are means ± S.E.M., n = 3; ***P < 0.001, compared to scrambled oligomer; # P < 0.05, compared to macrophages not exposed to EVs, one-way ANOVA, post hoc Bonferroni test. d Expression of Nos2 mRNA in macrophages incubated with GFP-overexpressing or miR-21-overexpressing neuronal EVs. Data are means ± S.E.M., n = 3; *P < 0.05 compared to macrophages not exposed to EVs; # P < 0.05 compared to GFP-derived EVs, one-way ANOVA, post hoc Bonferroni test. e Mrc1 and Spry2 mRNA expression levels in macrophages transfected with miR-21-5p antagomir or scrambled oligomer and incubated with miR-21-overexpressing EVs derived from CAPS-treated DRG neurons. Data are means ± S.E.M., n = 3; *P < 0.05 and **P < 0.01 Student’s _t_-test
Fig. 6
Transfection of peritoneal macrophages with miR-21-5p “mimic” induces upregulation of pro-inflammatory markers. a Peritoneal macrophage transfection for 48 h with FAM-labeled miR-21-5p mimic or scrambled control N4, and co-localization of miR-21-5p and N4 (FAM-labeled, green) with F4/80 (macrophage marker, red); nuclear stain DAPI (blue). Objective ×20, scale bar = 200 µm. b Transfection efficacy expressed as percentage of cells double-positive for F4/80 and FAM-labeled miR-21-5p mimic or N4; miR-21-5p expression in transfected macrophages revealed by qPCR. Data are means ± S.E.M., n = 6 coverslips. ***P < 0.001 compared to CON; ### P < 0.001 compared to N4, one-way ANOVA, post hoc Bonferroni. c Overexpression of miR-21-5p in macrophages induces a significant reduction of Spry2 protein revealed by western blot. d Representative western blot and quantification of iNOS and P-NF-κB protein levels induced by overexpression of miR-21-5p in macrophages. Data are means ± S.E.M., n = 4 for each group. *P < 0.05 and **P < 0.01 compared to CON; # P < 0.05 and ## P < 0.01 compared to N4, one-way ANOVA, post hoc Bonferroni. e mRNA expression levels for pro-inflammatory (Nos2, Rela) and anti-inflammatory (Mrc1, Arg1) mediators following macrophage transfection with miR-21-5p mimic and N4. Data are means ± S.E.M., n = 6 for each group. *P < 0.05 and **P < 0.01 compared to CON; # P < 0.05, compared to N4, one-way ANOVA, post hoc Bonferroni. f TNF-α and IL-6 levels in media of transfected macrophages. Data are means ± S.E.M., n = 6; *P < 0.05 and **P < 0.01 compared to CON, one-way ANOVA, post hoc Bonferroni
Fig. 7
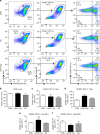
Transfection of peritoneal macrophages with miR-21-5p mimic reduces M2 and favors M1 phenotype. a Representative scatterplots of peritoneal macrophages transfected with N4 or miR-21-5p mimc for 48 h. Cells were immunolabeled with antibody–fluorophore conjugates against CD45, CD11b, F4/80, CD206, and CD11c. Macrophages were defined as CD45+CD11b+F4/80+ cells, and their fluorescence intensity for CD206 and CD11c labels were used to define M1 (CD206−CD11c+) and M2 (CD206+CD11c−) phenotypes. Numbers in gates refer to percentage of positive cells for each specific marker. b–f Bar charts represent numbers of leukocytes (CD45+ cells), macrophages (CD11b+F4/80+) and (CD206+CD11c+), M1 macrophages (CD206−CD11c+) and M2 macrophages (CD206+CD11c−). Data are means ± S.E.M., n = 4 for each group. **P < 0.01 compared to CON; ## P < 0.01 compared to N4, one-way ANOVA, post hoc Bonferroni
Fig. 8
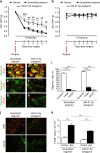
Intrathecal delivery of miR-21 antagomir prevents mechanical hypersensitivity and reduces macrophage numbers in the DRG following SNI injury. a Effect of continuous intrathecal delivery of the miR-21-5p antagomir (12 pmol/day) for 7 days on the development of mechanical hypersensitivity. b No effect on contralateral nociceptive thresholds of miR-21-5p, scrambled oligomers, or vehicle. Data are presented as 50% of paw withdrawal thresholds (PWT); means ± S.E.M., n = 6 mice in vehicle group and 12 mice in oligomer-treated groups. *P < 0.05, **P < 0.01, ***P < 0.001 compared to vehicle; ## P < 0.01, ### P < 0.001 compared to scrambled oligomer, two-way ANOVA followed by Tukey test. Scrambled oligomer and miR-21-5p antagomir (green) distribution in L5 DRG and co-localization with the neuronal marker β-tubulin (red; c, d, i) macrophage marker F4/80 (red; e, f, i), or the satellite cell marker GFAP (red; g–i). Scale bar = 50 μm. j Macrophage infiltration (F4/80, red) in ipsilateral and contralateral L5 DRG. Scale bar = 50 μm. k Quantification of F4/80+ cells in L4 and L5 DRG ipsilateral and contralateral to injury following intrathecal delivery of either the scrambled oligomer or miR-21-5p antagomir. Data are means ± S.E.M., n = 4 for each group. ***P < 0.001, one-way ANOVA, post hoc Bonferroni
Fig. 9
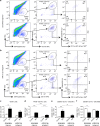
Intrathecal delivery of miR-21-5p antagomir reduces immune cell recruitment and number of M1 macrophages in DRG following SNI injury. Representative scatterplots of immune cells sorted from pools of contralateral and ipsilateral L4 and L5 DRG obtained from SNI mice intrathecally treated with scrambled oligomer (a) or miR-21-5p antagomir (b) as in Fig. 8. Cells were gated on CD45+, F4/80+, and CD11b+. Macrophages were defined as CD11b+F4/80+ and further analyzed for the M2 (CD206+CD11c−) and M1 (CD206−CD11c+) phenotypes as indicated by arrows. Numbers in gates refer to the percentage of positive cells for each specific marker. Bar charts represent absolute number in DRG of leukocytes (CD45+; c), macrophages (CD11b+F4/80+; d), M1 macrophages (CD206− CD11c+; e), and M2 macrophages (CD206+ CD11c−; f). Statistical analysis was performed on data obtained from four independent experiments. Data are means ± S.E.M., n = 4 for each group. **P < 0.01 and ***P < 0.001, one-way ANOVA, post hoc Bonferroni
Fig. 10
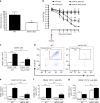
Conditional deletion of miR-21 in sensory neurons prevents the development of mechanical hypersensitivity and is associated with polarization of macrophages toward an anti-inflammatory phenotype. a Downregulation of miR-21-5p levels in DRG of miR-21 cKO compared to WT littermate mice. Data are expressed as means ± S.E.M., n = 5 mice for each group. # P < 0.05 compared to WT, Student’s _t-_test. b Effect of miR-21 deletion in DRG sensory neurons on the development of mechanical hypersensitivity following SNI. Data are presented as 50% of paw withdrawal thresholds (PWT); means ± S.E.M., n = 10 mice. # P < 0.05, ## P < 0.01, compared to WT ipsilateral, two-way ANOVA followed by Tukey test. c Bar charts represent absolute number of leukocyte in DRG. d Representative scatterplots of immune cells sorted from pools of ipsilateral L4 and L5 DRG obtained from WT mice or miR-21 cKO mice, on day-7 post SNI injury. Numbers in gates refer to the percentage of positive cells for each specific marker. e Number of macrophages, f M1 macrophages (g) and M2 macrophages. Statistical analysis was performed on data from two independent experiments. Data are expressed as means ± S.E.M., n = 4 for each group. *P < 0.05, **P < 0.01, and ***P < 0.001, one-way ANOVA, post hoc Bonferroni
Similar articles
- Extracellular vesicle-encapsulated microRNA-23a from dorsal root ganglia neurons binds to A20 and promotes inflammatory macrophage polarization following peripheral nerve injury.
Zhang Y, Liu J, Wang X, Zhang J, Xie C. Zhang Y, et al. Aging (Albany NY). 2021 Feb 17;13(5):6752-6764. doi: 10.18632/aging.202532. Epub 2021 Feb 17. Aging (Albany NY). 2021. PMID: 33621204 Free PMC article. - Satellite glial cell-secreted exosomes after in-vitro oxaliplatin treatment presents a pro-nociceptive effect for dorsal root ganglion neurons and induce mechanical hypersensitivity in naïve mice.
Zhao L, Liu S, Zhang X, Yang J, Mao M, Zhang S, Xu S, Feng S, Wang X. Zhao L, et al. Mol Cell Neurosci. 2023 Sep;126:103881. doi: 10.1016/j.mcn.2023.103881. Epub 2023 Jul 18. Mol Cell Neurosci. 2023. PMID: 37467904 - Changes in the expression of IL-6-Mediated MicroRNAs in the dorsal root ganglion under neuropathic pain in mice.
Hori N, Narita M, Yamashita A, Horiuchi H, Hamada Y, Kondo T, Watanabe M, Igarashi K, Kawata M, Shibasaki M, Yamazaki M, Kuzumaki N, Inada E, Ochiya T, Iseki M, Mori T, Narita M. Hori N, et al. Synapse. 2016 Aug;70(8):317-24. doi: 10.1002/syn.21902. Epub 2016 Jun 3. Synapse. 2016. PMID: 26990296 - Role of the immune system in neuropathic pain.
Malcangio M. Malcangio M. Scand J Pain. 2019 Dec 18;20(1):33-37. doi: 10.1515/sjpain-2019-0138. Scand J Pain. 2019. PMID: 31730538 Review. - The Yin/Yang Balance of Communication between Sensory Neurons and Macrophages in Traumatic Peripheral Neuropathic Pain.
Gheorghe RO, Grosu AV, Bica-Popi M, Ristoiu V. Gheorghe RO, et al. Int J Mol Sci. 2022 Oct 16;23(20):12389. doi: 10.3390/ijms232012389. Int J Mol Sci. 2022. PMID: 36293246 Free PMC article. Review.
Cited by
- Characterization of transgenic mouse lines for selectively targeting satellite glial cells and macrophages in dorsal root ganglia.
Rabah Y, Rubino B, Moukarzel E, Agulhon C. Rabah Y, et al. PLoS One. 2020 Sep 11;15(9):e0229475. doi: 10.1371/journal.pone.0229475. eCollection 2020. PLoS One. 2020. PMID: 32915783 Free PMC article. - TRPV1: The key bridge in neuroimmune interactions.
Chen J, Sun W, Zhu Y, Zhao F, Deng S, Tian M, Wang Y, Gong Y. Chen J, et al. J Intensive Med. 2024 Apr 1;4(4):442-452. doi: 10.1016/j.jointm.2024.01.008. eCollection 2024 Oct. J Intensive Med. 2024. PMID: 39310069 Free PMC article. Review. - Extracellular vesicles: The next generation in gene therapy delivery.
Cecchin R, Troyer Z, Witwer K, Morris KV. Cecchin R, et al. Mol Ther. 2023 May 3;31(5):1225-1230. doi: 10.1016/j.ymthe.2023.01.021. Epub 2023 Jan 25. Mol Ther. 2023. PMID: 36698310 Free PMC article. Review. - Exosomes derived from differentiated human ADMSC with the Schwann cell phenotype modulate peripheral nerve-related cellular functions.
Liu B, Kong Y, Shi W, Kuss M, Liao K, Hu G, Xiao P, Sankarasubramanian J, Guda C, Wang X, Lei Y, Duan B. Liu B, et al. Bioact Mater. 2021 Dec 14;14:61-75. doi: 10.1016/j.bioactmat.2021.11.022. eCollection 2022 Aug. Bioact Mater. 2021. PMID: 35310346 Free PMC article. - Repurposing of Tranilast for Potential Neuropathic Pain Treatment by Inhibition of Sepiapterin Reductase in the BH4 Pathway.
Moore BJR, Islam B, Ward S, Jackson O, Armitage R, Blackburn J, Haider S, McHugh PC. Moore BJR, et al. ACS Omega. 2019 Jul 10;4(7):11960-11972. doi: 10.1021/acsomega.9b01228. eCollection 2019 Jul 31. ACS Omega. 2019. PMID: 31460307 Free PMC article.
References
Publication types
MeSH terms
Substances
LinkOut - more resources
Full Text Sources
Other Literature Sources
Molecular Biology Databases
