A new genus of horse from Pleistocene North America - PubMed (original) (raw)
doi: 10.7554/eLife.29944.
Grant D Zazula 3, Ross DE MacPhee 4, Eric Scott 5 6, James A Cahill 1, Brianna K McHorse 7, Joshua D Kapp 1, Mathias Stiller 1 8, Matthew J Wooller 9 10, Ludovic Orlando 11 12, John Southon 13, Duane G Froese 14, Beth Shapiro 1 15
Affiliations
- PMID: 29182148
- PMCID: PMC5705217
- DOI: 10.7554/eLife.29944
A new genus of horse from Pleistocene North America
Peter D Heintzman et al. Elife. 2017.
Abstract
The extinct 'New World stilt-legged', or NWSL, equids constitute a perplexing group of Pleistocene horses endemic to North America. Their slender distal limb bones resemble those of Asiatic asses, such as the Persian onager. Previous palaeogenetic studies, however, have suggested a closer relationship to caballine horses than to Asiatic asses. Here, we report complete mitochondrial and partial nuclear genomes from NWSL equids from across their geographic range. Although multiple NWSL equid species have been named, our palaeogenomic and morphometric analyses support the idea that there was only a single species of middle to late Pleistocene NWSL equid, and demonstrate that it falls outside of crown group Equus. We therefore propose a new genus, Haringtonhippus, for the sole species H. francisci. Our combined genomic and phenomic approach to resolving the systematics of extinct megafauna will allow for an improved understanding of the full extent of the terminal Pleistocene extinction event.
Keywords: Haringtonhippus francisci; ancient DNA; evolutionary biology; genomics; morphometrics; radiocarbon dating; stilt-legged equids; systematics.
Conflict of interest statement
No competing interests declared.
Figures
Figure 1.. Phylogeny of extant and middle-late Pleistocene equids, as inferred from the Bayesian analysis of full mitochondrial genomes.
Purple node-bars illustrate the 95% highest posterior density of node heights and are shown for nodes with >0.99 posterior probability support. The range of divergence estimates derived from our nuclear genomic analyses is shown by the thicker, lime green node-bars ([Orlando et al., 2013]; this study). Nodes highlighted in the main text are labeled with boxed numbers. All analyses were calibrated using as prior information a caballine/non-caballine Equus divergence estimate of 4.0–4.5 Ma (Orlando et al., 2013) at node 3, and, in the mitochondrial analyses, the known ages of included ancient specimens. The thicknesses of nodes 2 and 3 represent the range between the median nuclear and mitochondrial genomic divergence estimates. Branches are coloured based on species provenance and the most parsimonious biogeographic scenario given the data, with gray indicating ambiguity. Fossil record occurrences for major represented groups (including South American Hippidion, New World stilt-legged equids, and Old World Sussemiones) are represented by the geographically coloured bars, with fade indicating uncertainty in the first appearance datum (after (Eisenmann et al., 2008; Forsten, 1992; O'Dea et al., 2016; Orlando et al., 2013) and references therein). The Asiatic ass species (E. kiang, E. hemionus) are not reciprocally monophyletic based on the analyzed mitochondrial genomes, and so the Asiatic ass clade is shown as ‘_E. kiang + hemionus_’. Daggers denote extinct taxa. NW: New World.
Figure 1—figure supplement 1.. An example maximum likelihood (ML) phylogeny of equid mitochondrial genomes.
This topology resulted from the analysis of mtDNA data set 3 (see Appendix 1) with all partitions and Hippidion included, and dog and ceratomorphs as outgroup (not shown). Numbers above branches are Bayesian posterior probability support values from equivalent MrBayes and BEAST analyses, with those below indicating ML bootstrap values calculated in RAxML, and are shown for major nodes. (A) Full phylogeny of the analyzed equid sequences. (B) The Haringtonhippus (NWSL equid) clade, with tips color coded by geographic origin: east Beringia, blue; contiguous USA, red (following Figure 3). Tips in bold were included in the BEAST analysis (see also Supplementary file 1).
Figure 1—figure supplement 2.. A comparison of relative private transversion frequencies between the nuclear genomes of a horse, donkey, and 17 NWSL equids.
A comparison of relative private transversion frequencies between the nuclear genomes of a caballine Equus (horse, E. caballus; green), a non-caballine Equus (donkey, E. asinus; red), and 17 NWSL equids (=Haringtonhippus francisci; blue) at different read lengths, with reads divided into 10 base pair (bp) bins. Analyses are based on alignment to the horse (A) or donkey (B) genome coordinates. To account for bins with low data content, we only display comparisons with at least 200,000 observable sites.
Figure 1—figure supplement 3.. Calculation of divergence date estimates from nuclear genome data.
Relative branch lengths are from Figure 1—source data 3. Minimum (darker blue) and maximum (lighter blue) estimates are shown for the NWSL equid branch.
Figure 2.. Morphological analysis of extant and middle-late Pleistocene equids.
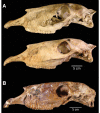
(A) Crania of Haringtonhippus francisci, upper: LACM(CIT) 109/156450 from Nevada, lower: TMM 34–2518 from Texas. (B) From upper to lower, third metatarsals of: H. francisci (YG 401.268), E. lambei (YG 421.84), and E. cf. scotti (YG 198.1) from Yukon. Scale bar is 5 cm. (C) Principal component analysis of selected third metatarsals from extant and middle-late Pleistocene equids, showing clear clustering of stilt-legged (hemionine Equus (orange) and H. francisci (green)) from stout-legged (caballine Equus; blue) specimens (see also Figure 2—source data 1). Symbol shape denotes the specimen identification method (DNA: square, triangle: DNA/morphology, circle: morphology). The first and second principal components explain 95% of the variance.
Figure 2—figure supplement 1.. The two crania assigned to H. francisci.
(A) LACM(CIT) 109/156450 from Nevada, identified through mitochondrial and nuclear palaeogenomic analysis. Upper: right side (reflected for comparison), lower: left side. (B) Part of the H. francisci holotype, TMM 34–2518 from Texas.
Figure 2—figure supplement 2.. Comparison between the limb bones of H. francisci, E. lambei, and E. cf. scotti from Yukon.
(A) Third metatarsals from H. francisci (upper; YG 401.268), E. lambei (middle; YG 421.84), and E. cf. scotti (lower; YG 198.1). (B) Third metacarpals from H. francisci (upper; YG 404.663), E. lambei (middle; YG 109.6), and E. cf. scotti (lower; YG 378.15). (C) Proximal fragments of radii from H. francisci (left; YG 303.1085), and E. lambei (right; YG 303.325). (D) First phalanges from H. francisci (left; YG 130.3), E. lambei (middle; YG 404.22), and E. cf. scotti (right; YG 168.1).
Figure 2—figure supplement 3.. An example equid metacarpal from Natural Trap Cave, Wyoming.
This specimen (KU 47800; JK260) was originally referred to Equus sp., but is here identified as H. francisci on the basis of mitochondrial and nuclear genome data. We note the relative slenderness of this specimen, which is comparable to YG 404.663 (H. francisci) from Yukon in Figure 2—figure supplement 2.
Figure 2—figure supplement 4.. An example femur of H. francisci from Gypsum Cave, Nevada.
This specimen (LACM(CIT)109/150708; JW277/JK166) was originally identified by Weinstock et al., 2005. List of Source data files.
Figure 3.. The geographic distribution of Haringtonhippus.
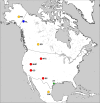
Blue circles are east Beringian localities (KL: Klondike region, Yukon Territory, Canada). Red circles are contiguous USA localities (NTC: Natural Trap Cave, Wyoming, USA; GC: Gypsum Cave, Nevada, USA; MHC: Mineral Hill Cave, Nevada, USA; DC: Dry Cave, New Mexico, USA [Barrón-Ortiz et al., 2017; Weinstock et al., 2005]). Orange circles are localities with tentatively assigned Haringtonhippus specimens only (FB: Fairbanks, Alaska, USA; ED: Edmonton, Alberta, Canada, USA; SJC: San Josecito Cave, Nuevo Leon, Mexico; (Barrón-Ortiz et al., 2017; Guthrie, 2003). The green-star-labeled HT is the locality of the francisci holotype, Wharton County, Texas, USA. This figure was drawn using Simplemappr (Shorthouse, 2010).
Appendix 1—figure 1.. An overview of the nuclear genome analysis pipeline.
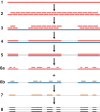
A first reference genome sequence (red; step 1) is divided into 150 bp pseudo-reads, tiled every 75 bp for exactly 2 × genomic coverage (step 2). These pseudo-reads are then mapped to a second reference genome (blue; step 3), and a consensus sequence of the mapped pseudo-reads is called (step 4). Regions of the second reference genome that are not covered by the pseudo-reads are masked (step 5). For each NWSL equid sample, reads (orange) are mapped independently to the first reference consensus sequence (step 6a) and masked second reference genome (step 6b). Alignments from steps 6a and 6b are then merged (step 7). For alignment coordinates that have base calls for the first reference, second reference, and NWSL equid sample genomes, the relative frequencies of private transversion substitutions (yellow stars) for each genome are calculated (step 8). The co-ordinates from the second reference genome (blue) are used for each analysis.
Appendix 2—figure 1.. Characterization of ancient mitochondrial DNA damage patterns from nine equid samples.
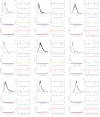
H. francisci: (A–C) JK166 (LACM(CIT) 109/150807; Nevada), (D–F) JK207 (LACM(CIT) 109/156450; Nevada), (G–I) JK260 (KU 47800; Wyoming), (J–L) PH013 (YG 130.6; Yukon), (M–O) PH047 (YG 404.663; Yukon), (P–R) MS272 (YG 401.268; Yukon), (S–U) MS349 (YG 130.55; Yukon); E. cf. scotti: (V–X) PH055 (YG 198.1; Yukon); E. lambei: (Y–AA) MS316 (YG 328.54; Yukon). Every third panel: (A) to (Y) DNA fragment length distributions; (B) to (Z) proportion of cytosines that are deaminated at fragment ends (red: cytosine → thymine; blue: guanine → adenine); and (C) to (AA) mean base frequencies immediately upstream and downstream of the 5’ and 3’ ends of mapped reads.
Appendix 2—figure 2.. Characterization of ancient nuclear DNA damage patterns from six H. francisci samples.
(A–C) JK166 (LACM(CIT) 109/150807; Nevada), (D–F) JK260 (KU 47800; Wyoming), (G–I) PH013 (YG 130.6; Yukon), (J–L) PH036 (YG 76.2; Yukon), (M–O) MS349 (YG 130.55; Yukon), (P–R) MS439 (YG 401.387; Yukon). Every third panel: (A) to (P) DNA fragment length distributions; (B) to (Q) proportion of cytosines that are deaminated at fragment ends (red: cytosine → thymine; blue: guanine → adenine); and (C) to (R) mean base frequencies immediately upstream and downstream of the 5’ and 3’ ends of mapped reads.
Appendix 2—figure 3.. Seven phylogenetic hypotheses for the four major groups of equids with sequenced mitochondrial genomes.
These major groups are Hippidion, the New World stilt-legged equids (=Haringtonhippus), non-caballine Equus (asses, zebras, and E. ovodovi) and caballine Equus (horses). (A) imbalanced and (B) balanced hypotheses. The hypotheses presented in (C) and (D) are identical to (A) and (B), except that Hippidion is excluded. Node letters are referenced in Appendix 2—tables 1–2. We only list combinations that were recovered by our palaeogenomic, or previous palaeogenetic, analyses.
Appendix 2—figure 4.. A comparison of relative private transversion frequencies between the nuclear genomes of a caballine Equus (horse, E.
caballus; green), a non-caballine Equus (donkey, E. asinus; red), and the 17 New World-stilt legged (NWSL) equid samples (=Haringtonhippus francisci; blue), using approach three (Appendix 1), with samples ordered by increasing mean mapped read length. Analyses are based on alignment to the horse (A) or donkey (B) genome coordinates.
Similar articles
- Evolution, systematics, and phylogeography of pleistocene horses in the new world: a molecular perspective.
Weinstock J, Willerslev E, Sher A, Tong W, Ho SY, Rubenstein D, Storer J, Burns J, Martin L, Bravi C, Prieto A, Froese D, Scott E, Xulong L, Cooper A. Weinstock J, et al. PLoS Biol. 2005 Aug;3(8):e241. doi: 10.1371/journal.pbio.0030241. Epub 2005 Jun 28. PLoS Biol. 2005. PMID: 15974804 Free PMC article. - Cheek tooth morphology and ancient mitochondrial DNA of late Pleistocene horses from the western interior of North America: Implications for the taxonomy of North American Late Pleistocene Equus.
Barrón-Ortiz CI, Rodrigues AT, Theodor JM, Kooyman BP, Yang DY, Speller CF. Barrón-Ortiz CI, et al. PLoS One. 2017 Aug 17;12(8):e0183045. doi: 10.1371/journal.pone.0183045. eCollection 2017. PLoS One. 2017. PMID: 28817644 Free PMC article. - Mitochondrial phylogenomics of modern and ancient equids.
Vilstrup JT, Seguin-Orlando A, Stiller M, Ginolhac A, Raghavan M, Nielsen SC, Weinstock J, Froese D, Vasiliev SK, Ovodov ND, Clary J, Helgen KM, Fleischer RC, Cooper A, Shapiro B, Orlando L. Vilstrup JT, et al. PLoS One. 2013;8(2):e55950. doi: 10.1371/journal.pone.0055950. Epub 2013 Feb 20. PLoS One. 2013. PMID: 23437078 Free PMC article. - Eurasian wild asses in time and space: morphological versus genetic diversity.
Geigl EM, Grange T. Geigl EM, et al. Ann Anat. 2012 Jan 20;194(1):88-102. doi: 10.1016/j.aanat.2011.06.002. Epub 2011 Jul 8. Ann Anat. 2012. PMID: 21820882 Review. - Genomics and the Evolutionary History of Equids.
Librado P, Orlando L. Librado P, et al. Annu Rev Anim Biosci. 2021 Feb 16;9:81-101. doi: 10.1146/annurev-animal-061220-023118. Epub 2020 Nov 16. Annu Rev Anim Biosci. 2021. PMID: 33197207 Review.
Cited by
- The complete mitochondrial genome of the extinct Pleistocene horse (Equus cf. lenensis) from Kotelny Island (New Siberian Islands, Russia) and its phylogenetic assessment.
Nedoluzhko AV, Sharko FS, Boulygina ES, Tsygankova SV, Slobodova NV, Gruzdeva NM, Rastorguev SM, Spasskaya NN, Maschenko EN. Nedoluzhko AV, et al. Mitochondrial DNA B Resour. 2019 Dec 13;5(1):243-245. doi: 10.1080/23802359.2019.1699877. Mitochondrial DNA B Resour. 2019. PMID: 33366505 Free PMC article. - Overkill, glacial history, and the extinction of North America's Ice Age megafauna.
Meltzer DJ. Meltzer DJ. Proc Natl Acad Sci U S A. 2020 Nov 17;117(46):28555-28563. doi: 10.1073/pnas.2015032117. Epub 2020 Nov 9. Proc Natl Acad Sci U S A. 2020. PMID: 33168739 Free PMC article. - Investigating the reliability of metapodials as taxonomic Indicators for Beringian horses.
Landry Z, Roloson MJ, Fraser D. Landry Z, et al. J Mamm Evol. 2022;29(4):863-875. doi: 10.1007/s10914-022-09626-4. Epub 2022 Sep 21. J Mamm Evol. 2022. PMID: 36438779 Free PMC article. - Darwinian genomics and diversity in the tree of life.
Stephan T, Burgess SM, Cheng H, Danko CG, Gill CA, Jarvis ED, Koepfli KP, Koltes JE, Lyons E, Ronald P, Ryder OA, Schriml LM, Soltis P, VandeWoude S, Zhou H, Ostrander EA, Karlsson EK. Stephan T, et al. Proc Natl Acad Sci U S A. 2022 Jan 25;119(4):e2115644119. doi: 10.1073/pnas.2115644119. Proc Natl Acad Sci U S A. 2022. PMID: 35042807 Free PMC article. - Hipparion tracks and horses' toes: the evolution of the equid single hoof.
Vincelette AR, Renders E, Scott KM, Falkingham PL, Janis CM. Vincelette AR, et al. R Soc Open Sci. 2023 Jun 21;10(6):230358. doi: 10.1098/rsos.230358. eCollection 2023 Jun. R Soc Open Sci. 2023. PMID: 37351494 Free PMC article.
References
- Azzaroli A, Voorhies MR. The Genus Equus in North America. The blancan species. Palaeontographia Italica. 1993;80:175–198.
- Azzaroli A. Ascent and decline of monodactyl equids: a case for prehistoric overkill. Annales Zoologici Fennici. 1992;28:151–163.
- Azzaroli A. A synopsis of the Quaternary species of Equus in North America. Bolletino Della Societa Palaeontologica Italiana. 1995;34:205–221.


