A Next Generation Connectivity Map: L1000 Platform and the First 1,000,000 Profiles - PubMed (original) (raw)
. 2017 Nov 30;171(6):1437-1452.e17.
doi: 10.1016/j.cell.2017.10.049.
Rajiv Narayan 1, Steven M Corsello 2, David D Peck 1, Ted E Natoli 1, Xiaodong Lu 1, Joshua Gould 1, John F Davis 1, Andrew A Tubelli 1, Jacob K Asiedu 1, David L Lahr 1, Jodi E Hirschman 1, Zihan Liu 1, Melanie Donahue 1, Bina Julian 1, Mariya Khan 1, David Wadden 1, Ian C Smith 1, Daniel Lam 1, Arthur Liberzon 1, Courtney Toder 1, Mukta Bagul 1, Marek Orzechowski 1, Oana M Enache 1, Federica Piccioni 1, Sarah A Johnson 1, Nicholas J Lyons 1, Alice H Berger 2, Alykhan F Shamji 1, Angela N Brooks 2, Anita Vrcic 1, Corey Flynn 1, Jacqueline Rosains 1, David Y Takeda 2, Roger Hu 1, Desiree Davison 1, Justin Lamb 1, Kristin Ardlie 1, Larson Hogstrom 1, Peyton Greenside 1, Nathanael S Gray 3, Paul A Clemons 1, Serena Silver 1, Xiaoyun Wu 1, Wen-Ning Zhao 4, Willis Read-Button 1, Xiaohua Wu 1, Stephen J Haggarty 4, Lucienne V Ronco 1, Jesse S Boehm 1, Stuart L Schreiber 5, John G Doench 1, Joshua A Bittker 1, David E Root 1, Bang Wong 1, Todd R Golub 6
Affiliations
- PMID: 29195078
- PMCID: PMC5990023
- DOI: 10.1016/j.cell.2017.10.049
A Next Generation Connectivity Map: L1000 Platform and the First 1,000,000 Profiles
Aravind Subramanian et al. Cell. 2017.
Abstract
We previously piloted the concept of a Connectivity Map (CMap), whereby genes, drugs, and disease states are connected by virtue of common gene-expression signatures. Here, we report more than a 1,000-fold scale-up of the CMap as part of the NIH LINCS Consortium, made possible by a new, low-cost, high-throughput reduced representation expression profiling method that we term L1000. We show that L1000 is highly reproducible, comparable to RNA sequencing, and suitable for computational inference of the expression levels of 81% of non-measured transcripts. We further show that the expanded CMap can be used to discover mechanism of action of small molecules, functionally annotate genetic variants of disease genes, and inform clinical trials. The 1.3 million L1000 profiles described here, as well as tools for their analysis, are available at https://clue.io.
Keywords: Functional genomics; chemical biology; gene expression profiling.
Copyright © 2017 Elsevier Inc. All rights reserved.
Figures
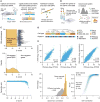
Figure 1. L1000 gene expression platform implementation and validation
A. Overview of ligation-mediated amplification. Cells are treated in 384-well plates, lysed and mRNA captured on oligo-dT plates. mRNA is reverse-transcribed and oligonucleotide probes designed with transcript-specific, 24-mer unique barcode and universal primer sequences annealed to the cDNA, ligated and PCR-amplified using biotinylated primers. PCR product is hybridized to optically addressed polystyrene microspheres, where each bead is coupled to an oligonucleotide complementary to a landmark gene's barcode. Transcript abundance is quantified by fluorescence using a Luminex FlexMap 3D scanner. B. Deconvoluting 1,000 landmark genes using 500 bead colors. Each bead is analyzed for its bead color (denoting landmark gene identity) and phycoerythrin intensity (denoting transcript abundance). Aliquots of the same bead color, separately coupled to two different gene barcodes, are combined in a ratio of 2:1. A distribution of fluorescent intensities reveals two peaks (partitioned by _k_-means clustering), the larger peak designating the landmark for which double number of beads were used. C. Validation of L1000 probes using shRNA knockdown. MCF7 and PC3 cells transduced with shRNAs targeting 955 landmark genes. Differential expression values (z-scores) were computed for each landmark and the percentile rank of expression z-scores in the experiment in which it was targeted relative to all other experiments was computed. 841/955 genes (88%) rank in the top 1% of all experiments and 907/955 (95%)rank in the top 5%. Top panel: z-score of BAX gene in every experiment. Middle panel: Z-score distribution from all targeted (orange) and non-targeted (white) genes. Distribution from the targeted set is significantly lower than non-targeted (p value <10-16). Bottom panel: Scatter of percentile rank versus expression z-score for 955 targeted genes. D. Comparison of L1000 with other platforms. Samples of RNA from 6 human cancer cell lines were profiled on L1000, Affymetrix GeneChip HG-U133 Plus 2.0 Array, Illumina Human HT-12 v4 Expression BeadChip Array, and mRNA-seq (Illumina Hi-Seq). E. Comparison of L1000 with RNA-seq and Affymetrix using patient-derived samples. RNA samples from 3,176 tissue specimens profiled on L1000 and RNA-seq, and a subset on Affymetrix microarrays. Top panels: Scatter plots of L1000 expression versus RNA-seq in landmark (left, Spearman correlation of 0.86) and landmark plus inferred (middle, Spearman correlation of 0.91) expression for a single sample. Bottom left:Spearman correlation distribution for L1000 vs RNA-seq of landmark genes for the same sample (orange) and different samples (gray), across all 3,176 patient samples. Bottom right: All L1000 inferred genes were subject to recall analysis by comparison with their RNA-seq measured equivalents. Scatter plot shows R versus cross-platform correlation for all inferred genes. 9,196 of 11,350 (81%) have an R in the 95th percentile (dotted line).
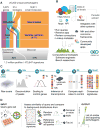
Figure 2. L1000 dataset coverage, signature generation, and data access
A. Classification of data in CMap-L1000v1. The 25,200 unique perturbagens correspond to 19,811 compounds, shRNA and/or cDNA targeting 5,075 genes, and 314 biologics. Annotated perturbagens profiled systematically across 9 core cell lines comprise the reference or Touchstone portion of the dataset, while the unannotated reagents make up the Discover portion. B. Modes of access to analysis tools and data. The clue.io software platform enables computational biologists, bench scientists, and software engineers to leverage CMap by offering web applications for analysis, and APIs and docker containers for code and data access. C. Signature generation and data levels. I) Raw bead count and fluorescence intensity measured by Luminex scanners II) Deconvoluted data to assign expression levels to two transcripts measured on the same bead IIIa) Normalization to adjust for non-biological variation IIIb) Inferred expression of 12,328 genes from measurement of 978 landmarks IV) Differential expression values V) Signatures representing collapse of replicate profiles. D. Schematic of query analysis. Query is specified by sets of up- and down-regulated genes. Similarities between the query and all signatures in CMap are computed. Normalized similarities are converted to a p-value and FDR, by comparison with a compendium of random queries, and to τ via comparison with reference signature queries. Perturbagens are then sorted by τ to generate most similar and opposing perturbagens.
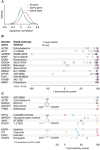
Figure 3. Analysis of genetic loss of function perturbations
A. Off-target effects of shRNAs. Distributions of Spearman correlations between signatures of 12,961 shRNAs in A549 cells targeting the same gene but different seed sequences (blue), targeting different genes but the same seed (red) and all pairs of shRNAs (gray). Distribution was randomly down-sampled to 10 million points. All pairwise comparisons of distributions were significantly different (adjusted p < 10e-7 by Kruskal-Wallis test followed by Dunn test with Benjamini-Hochberg correction). B. Consensus Gene Signature (CGS) improves on-target signal. A consensus gene signature (CGS) is computed from a weighted average of signatures of independent shRNAs targeting the same gene. Connectivity to annotated small molecules targeting each gene (horizontal axis) is markedly improved by CGS over individual shRNAs (with τ closer to 100), suggesting that the CGS procedure mitigates the seed effect inherent to individual shRNAs and enhances on-target signal. Connections are shown summarized across cell lines unless otherwise indicated. C. CRISPR knockout augments compound-target analysis. Top: Consistency between Loss of Function (LoF) signatures from CRISPR and CGS enhances confidence in connectivity to small molecules (CP). Middle: CRISPR-based LoF recovers some connections to small molecules missed by CGS. Bottom: Lack of compound-target connectivity, despite consistency between LoF reagents and validated compound signature suggests non-equivalency of genetic and pharmacological agent-derived signatures.
Figure 4. Reference perturbagen classes for CMap discovery
A. Process for defining Perturbagen Classes (PCLs). Left: Annotations gathered from literature sources to construct pairwise association matrix between perturbagens based on shared descriptors such as MoA, target gene and pathway membership. Middle: Each perturbagen is subject to ROC analysis to determine whether it recovers expected connections. Right: Remaining members are grouped based on shared annotations and assessed for intra-group connectivity of CMap signatures. Groups sufficiently interconnected are retained as PCLs. B. PCL validation. 137 compounds with known activities corresponding to one or more of 54 PCLs, but not used in PCL construction, were profiled across multiple cell types. Histogram shows rank of each expected PCL connection for the compounds (purple) versus the rank of all unexpected PCL connections (grey). The expected PCL distribution is significantly right-shifted (one-sided p < 2.2e-16 via two-sample KS test). C. Using PCLs for discovery. 3,333 known drugs and 2,418 unannotated but transcriptionally active compounds were subject to PCL analysis. Count of strong and selective connections to validated PCLs byknown drugs (teal) and unannotated compounds (blue). Abbreviations: inh. inhibitor, ag. agonist, rec.receptor, antag. antagonist, and chan. channel. D. Detecting multiple drug activities using PCLs. The PKC inhibitor enzastaurin was profiled in CMap across multiple doses. Connectivity to each established kinase inhibitor PCL is shown in the heatmap. Strong dose-responsive connections were observed to PKC and GSK3 inhibitor PCLs.
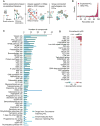
Figure 5. Characterizing known and unexpected activities of small molecules
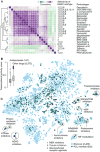
A. HDAC inhibitor PCL substructure. Hierarchical clustering of pairwise connectivities of the HDAC inhibitor PCL members reveals substructure within the class. Pan-HDAC inhibitors cluster together, distinct from more isoform-selective compounds. B. Antibacterials exhibit lower transcriptional activity than other drugs. Distributions of the maximum TASper compound for 147 antibacterials and 2,372 known drugs in CMap-TS. The antibacterials' TAS distribution is significantly lower (p < 3e-11) than that of other drugs. C. Comparison of unannotated compounds with known drugs. t-SNE projection of the signatures of 2,418unannotated but transcriptionally active compounds (blue) with PCL members (teal). Some unannotated compounds occupy regions not covered by drugs, presenting opportunities for novel chemical development.
Figure 6. Kinase inhibitor discovery using reference transcriptional signatures
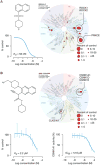
A. Discovery of ROCK1/ROCK2 inhibitor. Top left panel: chemical structure of BRD-2751, predicted to be aROCK inhibitor. Right: TREEspot selectivity profile of Kinomescan binding assay confirmed compound binding to ROCK1/ROCK2. Bottom left: Dose response testing by Kinomescan showed ROCK1 KD of 56 nM. B. Discovery of novel CSNK1A1 inhibitor. Top left panel: The chemical structure of BRD-1868. Top right:TREEspot image of Kinomescan binding assay performed with BRD-1868 at 10 uM demonstrated inhibition of6/456 kinases tested including CSNK1A1. Bottom left: CSNK1A1 binding by BRD-1868 confirmed by Kinomescan, with Kd 2.2 uM. Bottom right: BRD-1868 inhibits phosphorylation of peptide substrate byCSNK1A1, with IC50 12.9 uM. Error bars indicate standard deviation between technical replicates.
Figure 7. Assessing impact of allelic variants and drug response in clinical trials
A. Predicting LoF alleles. Clinically-observed FBXW7 alleles were overexpressed and L1000 profiles obtained. Protein structure shows residues in question. Wild-type FBXW7 connects strongly to MYC shRNA, which is a known target (heat map). Mutations at residues adjacent to the substrate recognition site lose the MYC connection. τ values are summarized across multiple cell types. Bar plot above heat map indicates incidence of each mutation in COSMIC database. B. Interpreting drug resistance. Transcriptional profiles of pre-treatment, early on-treatment, and relapse tumor biopsies obtained from clinical trials of BRAF and MEK inhibitors. Queries from on-treatment versus pre-treatment biopsies exhibited connectivity to pharmacologic inhibition of BRAF or MEK as well as BRAF shRNA in A375 cells, reflecting target engagement in vivo (left 3 columns in heat map). MAP kinase signaling was re-activated, as indicated by a strong negative connection to the same CMap signature in the subset of relapse biopsies with known MAP kinase pathway-related resistance mutations (right 3 columns of heat map). C. Predicting therapeutic efficacy. Transcriptional profiles of pre-treatment and on-treatment biopsies from clinical trial of PHA-793887. Differential expression between the two time points yielded variable connectivity to negative regulators of cell cycle. Patients with strong positive connectivity to cell cycle inhibition signatures remained on trial for a median of 21 weeks; patients with negative connections remained on study for only 8 weeks.
Similar articles
- Compound signature detection on LINCS L1000 big data.
Liu C, Su J, Yang F, Wei K, Ma J, Zhou X. Liu C, et al. Mol Biosyst. 2015 Mar;11(3):714-22. doi: 10.1039/c4mb00677a. Epub 2015 Jan 22. Mol Biosyst. 2015. PMID: 25609570 Free PMC article. - A comprehensive evaluation of connectivity methods for L1000 data.
Lin K, Li L, Dai Y, Wang H, Teng S, Bao X, Lu ZJ, Wang D. Lin K, et al. Brief Bioinform. 2020 Dec 1;21(6):2194-2205. doi: 10.1093/bib/bbz129. Brief Bioinform. 2020. PMID: 31774912 - A review of connectivity map and computational approaches in pharmacogenomics.
Musa A, Ghoraie LS, Zhang SD, Glazko G, Yli-Harja O, Dehmer M, Haibe-Kains B, Emmert-Streib F. Musa A, et al. Brief Bioinform. 2018 May 1;19(3):506-523. doi: 10.1093/bib/bbw112. Brief Bioinform. 2018. PMID: 28069634 Free PMC article. Review. - LINCS Canvas Browser: interactive web app to query, browse and interrogate LINCS L1000 gene expression signatures.
Duan Q, Flynn C, Niepel M, Hafner M, Muhlich JL, Fernandez NF, Rouillard AD, Tan CM, Chen EY, Golub TR, Sorger PK, Subramanian A, Ma'ayan A. Duan Q, et al. Nucleic Acids Res. 2014 Jul;42(Web Server issue):W449-60. doi: 10.1093/nar/gku476. Epub 2014 Jun 6. Nucleic Acids Res. 2014. PMID: 24906883 Free PMC article. - Small RNA transcriptome investigation based on next-generation sequencing technology.
Zhou L, Li X, Liu Q, Zhao F, Wu J. Zhou L, et al. J Genet Genomics. 2011 Nov 20;38(11):505-13. doi: 10.1016/j.jgg.2011.08.006. Epub 2011 Aug 31. J Genet Genomics. 2011. PMID: 22133681 Review.
Cited by
- Exploration of a miRNA-mRNA network shared between acute pancreatitis and Epstein-Barr virus infection by integrated bioinformatics analysis.
Wei X, Weng Z, Xu X, Yao J. Wei X, et al. PLoS One. 2024 Nov 15;19(11):e0311130. doi: 10.1371/journal.pone.0311130. eCollection 2024. PLoS One. 2024. PMID: 39546499 Free PMC article. - Improving compound-protein interaction prediction by focusing on intra-modality and inter-modality dynamics with a multimodal tensor fusion strategy.
Wang M, Wang J, Ji J, Ma C, Wang H, He J, Song Y, Zhang X, Cao Y, Dai Y, Hua M, Qin R, Li K, Cao L. Wang M, et al. Comput Struct Biotechnol J. 2024 Oct 5;23:3714-3729. doi: 10.1016/j.csbj.2024.10.004. eCollection 2024 Dec. Comput Struct Biotechnol J. 2024. PMID: 39525082 Free PMC article. - Overcoming Therapy Resistance in Colorectal Cancer: Targeting the Rac1 Signaling Pathway as a Potential Therapeutic Approach.
Anselmino LE, Malizia F, Avila A, Cesatti Laluce N, Mamberto M, Zanotti LC, Farré C, Sauzeau V, Menacho Márquez M. Anselmino LE, et al. Cells. 2024 Oct 26;13(21):1776. doi: 10.3390/cells13211776. Cells. 2024. PMID: 39513883 Free PMC article. - Gene expression profiles of precursor cells identify compounds that reduce NRP1 surface expression in macrophages: Implication for drug repositioning for COVID-19.
Iwata A, Chelvanambi S, Asano T, Whelan M, Nakamura Y, Aikawa E, Sasaki Y, Aikawa M. Iwata A, et al. Front Cardiovasc Med. 2024 Oct 24;11:1438396. doi: 10.3389/fcvm.2024.1438396. eCollection 2024. Front Cardiovasc Med. 2024. PMID: 39512370 Free PMC article. - Single-cell transcriptomics reveal diverging pathobiology and opportunities for precision targeting in scleroderma-associated versus idiopathic pulmonary arterial hypertension.
Tuhy T, Coursen JC, Graves T, Patatanian M, Cherry C, Niedermeyer SE, Khan SL, Rosen DT, Croglio MP, Elnashar M, Kolb TM, Mathai SC, Damico RL, Hassoun PM, Shimoda LA, Suresh K, Aldred MA, Simpson CE. Tuhy T, et al. bioRxiv [Preprint]. 2024 Oct 25:2024.10.25.620225. doi: 10.1101/2024.10.25.620225. bioRxiv. 2024. PMID: 39484590 Free PMC article. Preprint.
References
- Carlino MS, Gowrishankar K, Saunders CAB, Pupo GM, Snoyman S, Zhang XD, Saw R, Becker TM, Kefford RF, Long GV, et al. Antiproliferative effects of continued mitogen-activated protein kinase pathway inhibition following acquired resistance to BRAF and/or MEK inhibition in melanoma. Mol Cancer Ther. 2013;12:1332–1342. - PubMed
MeSH terms
Substances
Grants and funding
- KL2 TR001100/TR/NCATS NIH HHS/United States
- U54 HG006093/HG/NHGRI NIH HHS/United States
- T32 CA009172/CA/NCI NIH HHS/United States
- U01 HG008699/HG/NHGRI NIH HHS/United States
- U54 HL127366/HL/NHLBI NIH HHS/United States
LinkOut - more resources
Full Text Sources
Other Literature Sources
