Glut3 Addiction Is a Druggable Vulnerability for a Molecularly Defined Subpopulation of Glioblastoma - PubMed (original) (raw)
. 2017 Dec 11;32(6):856-868.e5.
doi: 10.1016/j.ccell.2017.10.016. Epub 2017 Nov 30.
Sten Ilmjärv 2, Valérie Dutoit 3, Kathryn Elliott 4, Tami von Schalscha 4, Maria F Camargo 4, Alexander Reiss 4, Toshiro Moroishi 5, Laetitia Seguin 4, German Gomez 4, Jung-Soon Moo 5, Olivier Preynat-Seauve 6, Karl-Heinz Krause 2, Hervé Chneiweiss 7, Jann N Sarkaria 8, Kun-Liang Guan 5, Pierre-Yves Dietrich 3, Sara M Weis 4, Paul S Mischel 9, David A Cheresh 10
Affiliations
- PMID: 29198914
- PMCID: PMC5730343
- DOI: 10.1016/j.ccell.2017.10.016
Glut3 Addiction Is a Druggable Vulnerability for a Molecularly Defined Subpopulation of Glioblastoma
Érika Cosset et al. Cancer Cell. 2017.
Abstract
While molecular subtypes of glioblastoma (GBM) are defined using gene expression and mutation profiles, we identify a unique subpopulation based on addiction to the high-affinity glucose transporter, Glut3. Although Glut3 is a known driver of a cancer stem cell phenotype, direct targeting is complicated by its expression in neurons. Using established GBM lines and patient-derived stem cells, we identify a subset of tumors within the "proneural" and "classical" subtypes that are addicted to aberrant signaling from integrin αvβ3, which activates a PAK4-YAP/TAZ signaling axis to enhance Glut3 expression. This defined subpopulation of GBM is highly sensitive to agents that disrupt this pathway, including the integrin antagonist cilengitide, providing a targeted therapeutic strategy for this unique subset of GBM tumors.
Keywords: Glut3; cancer stem cells; glioblastoma; glucose metabolism; integrin.
Published by Elsevier Inc.
Figures
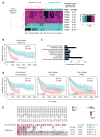
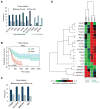
Figure 1. β3 levels correlate with poor survival and expression of genes involved in glucose metabolism
(A) Hierarchical clustering of integrin β subunit expression correlated to a risk score predicting the patient survival for the TCGA GBM-LGG dataset. (B) Kaplan-Meier analysis of Freije dataset for ITGB3 (β3) expression (n = 42 β3 low, n = 43 β3 high; p-value (p) < 0.0001). Low = low risk group; High: high risk group. (C) Functional annotation clustering (series GSE4412, Freije dataset) of gene set enrichment analysis based on β3high versus β3low expression. Graph shows the percent enrichment for each family of genes. (D) Kaplan-Meier analysis of Freije dataset for SLC2A3 (Glut3), ALDOC and PFKM expression. SLC2A3 (p-value=0.002); ALDOC (p-value=0.0065); PFKM (p-value= 0.0003). (E) β3 and Glut3 expression are significantly correlated across a range of GBM datasets according to the MEM output. See also Figure S1 and Tables S1–S3.
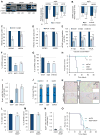
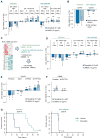
Figure 2. The impact of integrin αvβ3 on GBM is attributed to its regulation of Glut3 expression
(A) Immunoblots show expression of indicated proteins for U87MG, LN229 and LN18 GBM cells infected by shRNA Control (Ctrl) or shβ3. Graph shows the fold change of protein expression determined by densitometry analysis. (B) mRNA expression was determined by qPCR in U87MG, LN229 and LN18 infected with shRNA Control (shCtrl) or shβ3. (C) Relative glucose uptake in U87MG, LN229 and LN18 cells with β3 knockdown compared to control (shCtrl). (D) Bars represent the relative lactate production in U87MG and LN229 cells with β3 knockdown compared to control (shCtrl). (E) Effect of β3 and Glut3 knockdown on anchorage-independent growth of U87MG under high (4.5 g/l) or low (0.4 or 0.8 g/L) glucose conditions. (F) Effect of β3 and Glut3 knockdown on tumorsphere formation of U87MG under low glucose conditions (0.4 g/L). (G) Flow cytometry was used to quantify β3+ versus β3− as well as Glut3+ versus Glut3− in a growth competition assay under low glucose conditions (0.4 g/L). (H) Effect of β3 and Glut3 knockdown on tumor growth in vivo: U87MG shCtrl and U87MG β3 and Glut3 shRNA. (n=15 mice per group). (I) Graph represents the fold change of β-galactosidase positive cells versus the total cell number. Inverted microscopy images of acidic senescence-associated β-galactosidase staining in U87MG shCtrl and U87MG β3 and Glut3 shRNA (n=5 fields counted per group). (J) Cell-cycle analysis showing the percentage of cells in G0/G1, S, and G2/M in U87MG cells with β3 and Glut3 knockdown. (K) Images show acidic senescence-associated β-galactosidase staining, a marker of senescence, in mice implanted with U87MG shCtrl, shβ3, shGlut3, or shβ3 with ectopic expression of Glut3. Scale bar, 100μm (top left). Scale bar, 25μm (top right). (L) Flow cytometry was used to quantify U87MG shCtrl (GFP−) versus U87MG shβ3-Glut3+ (GFP+) in a growth competition assay. (M) Effect of ectopic expression of Glut3 on U87MG β3 shRNA on anchorage-independence growth. (N) Graph represents the fold change of β-galactosidase positive cells versus the total cell number. Inverted microscopy images of acidic senescence-associated β-galactosidase staining in U87MG β3 shRNA overexpressing Glut3 compared to U87MG shCtrl (n=5 fields counted per group). (O) Effect of ectopic expression of Glut3 on tumor growth in vivo: U87MG shCtrl and U87MG β3 and Glut3 shRNA. (n=15 mice per group). This experiment was performed at the same time as the in vivo experiment shown in figure 2H. Data are represented as mean (n=3–5) ± SEM (*p<0.05, **p<0.01 and ***p<0.001). See also Figure S2.
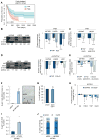
Figure 3. β3 modulates Glut3 expression through PAK4-YAP/TAZ axis
(A) Kaplan-Meier analysis of Freije dataset for WWTR1 (TAZ) expression (n=42 for β3 low and n=43 for β3 high; p-value = 0.02). Low = low risk group; High = high risk group. (B) Immunoblots show the effect of β3 knockdown on protein expression of YAP and β3. Bars represent the fold change of protein expression determined by densitometry analysis. Data are represented as mean (n=3–5) ± SEM (*p<0.05, **p<0.01 and ***p<0.001). (C) Graph shows the effect of β3 knockdown on mRNA expression of YAP and TAZ determined by qRT-PCR, displayed as fold change for gene expression normalized to sh-control in U87MG (n=3), LN229 (n=3) and U251 (n=2). (D) Immunoblots show the effect of YAP/TAZ knockdown on Glut3 protein expression, and the graph shows the fold increase determined by densitometry analysis. U87MG (n=3), LN229 (n=3) and U251 (n=2). (E) Graph shows the effect of YAP/TAZ knockdown on mRNA expression for SLC2A3 (Glut3), YAP and WWTR1 (TAZ) determined by qRT-PCR, displayed as fold change of gene expression normalized to sh-control in U87MG (n=3) and LN229 (n=2). (F) Acidic senescence-associated β-galactosidase staining in U87MG shCtrl versus YAP/TAZ shRNA (n=3). Scale bar, 50μm. (G) Effect of ectopic expression of YAP on U87MG β3 shRNA on anchorage-independent growth in U87MG (n=3). (H) Graph shows the fold change of protein expression in U87MG (n=2) and LN229 (n=2) determined by densitometry analysis. (I) Acidic senescence-associated β-galactosidase staining in U87MG shCtrl and PAK4 siRNA (n=3). (J) Cell-cycle analysis showing the percentage of cells in G0/G1, S, and G2/M in U87MG cells with PAK4 siRNA (n=3). Data are represented as mean (n=2–5) ± SEM (*p<0.05, **p<0.01 and ***p<0.001). See also Figure S3.
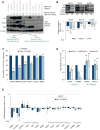
Figure 4. Integrin αvβ3 is required for Glut3 expression in patient-derived gliomaspheres that show heterogeneity in Glut3 “addiction”
(A) Representative immunoblots show expression of β3, Glut3, and TAZ in GSCs with a schematic representing the decision tree for selecting GSCs based on β3/Glut3 expression (n=2). (B) Immunoblots show effect of β3 knockdown on expression of indicated proteins in Ge479 (n=3). Graph represents the fold change of protein expression relative to sh-control determined by densitometry analysis. (C) Effect of glucose concentration on cell viability measured by CellTiter-Glo in GSCs (n=3–5). (D) Effect of Glut3 knockdown on cell viability measured by CellTiter-Glo in GSCs (n=3–4). (E) Expression of glycolytic, pentose phosphate and mitochondrial oxidative phosphorylation (OXPHOS) related genes were determined by qRT-PCR after β3 or Glut3 knockdown in Ge479 (n=3). Bars show the fold change of gene expression normalized to sh-control. Data are represented as mean (n=2–5) ± SEM (*p<0.05, **p<0.01 and ***p<0.001). See also Figure S4.
Figure 5. The Mesenchymal subtype of GBM is enriched for genes involved in glycolytic pathway and correspond to a Glut3 non-addicted genetic signature
(A) Enrichment analysis of glycolytic genes for the Freije dataset. Compared to other subtypes (Other sub), the Mesenchymal subtype showed high expression of SLC2A3 (Glut3), HK3, PFKP, PGK1, LDHA, SLC2A5 (Glut5) and SLC2A10 (Glut10), and no or low expression of LDHB, PFKP and ALDOC. (B) Kaplan-Meier analysis of Freije dataset for PGK1 expression (n=42 for β3 low and n=43 for β3 high; P=0.00000007). (C) Enrichment analysis for ITGB3 (β3), SLC2A3 (Glut3, also found in figure 5A), YAP and WWTR1 (TAZ). (D) Glut3 addicted vs. Glut3 non-addicted samples are identified using 96 signature genes. mRNA was determined by qRT-PCR (n=2) and Bio-Rad software has been used for analysis. Only the most significant genes are shown. See also Figure S5 and Table S7.
Figure 6. The Proneural/Classical subtype of GBM is sensitive to antagonists of αvβ3, YAP and PAK4
(A) Effect of LM609 (αvβ3 function blocking antibody) and cilengitide (cyclic peptide antagonist of αv integrins including αvβ3 and αvβ5) on cell viability measured by CellTiter-Glo in GSCs (n=3–5). (B) Effect of YAP inhibitor (Verteporfin) or PAK4 inhibitor (PF-03758309) on cell viability measured by CellTiter-Glo in GSCs (n=3–5). (C) Schematic depicting Mayo Clinic sample request. Samples were requested based on their Glut3 addicted vs. non-addicted signature, and then analyzed for cell viability in presence of cilengitide and LM609. (D) Effect of LM609 (αvβ3 function blocking antibody) and cilengitide (cyclic peptide antagonist of αv integrins including αvβ3 and αvβ5) on Mayo Clinic GSCs cell viability measured by CellTiter-Glo in GSCs (n=3–5, except n=2 for GBM150 and GBM85). (E) Effect of LM609 (αvβ3 function blocking antibody) and cilengitide (cyclic peptide antagonist of αv integrins including αvβ3 and αvβ5) on cell viability of Ge479 knockdown for β3, PAK4 and YAP/TAZ measured by CellTiter-Glo in GSCs (n=3–5). For Ge479 parental, the same data are displayed figure 6A. (F) Effect of LM609 (αvβ3 function blocking antibody) and cilengitide (cyclic peptide antagonist of αv integrins including αvβ3 and αvβ5) on cell viability of GBM6 with ectopic expression of β3 measured by CellTiter-Glo in GSCs (n=3–5). For GBM6 parental, the same data are displayed figure 6A. (G) Effect of Cilengitide on tumor growth. Mice bearing orthotopic Ge518 (Glut3 non-addicted) and Ge479 (Glut3 addicted) brain tumors were treated with vehicle or cilengitide (25mg kg−1; 8 mice per group). Data are represented as mean (n=3–5) ± SEM (*p<0.05, **p<0.01 and ***p<0.001). See also Figure S6.
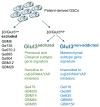
Figure 7
Schematic depicting the proposed model of Glut3 addiction in GBM In contrast to established GBM cell lines that are uniformly β3/Glut3high and Glut3 addicted, patient-derived GSC models show heterogeneity in expression of β3/Glut3. Importantly, the population of β3/Glut3high GSC models can be further separated into Glut3 addicted vs. Glut3 non-addicted subsets based on a gene signature and/or molecular subtype. Only the β3/Glut3high GSC models with Proneural/Classical subtype markers are sensitive to inhibitors that target elements of the αvβ3/PAK4/YAP pathway.
Comment in
- Glut3 Addiction: A Druggable Vulnerability in Glioblastoma.
Bunda S, Zadeh G, Aldape KD. Bunda S, et al. Cancer Cell. 2017 Dec 11;32(6):726-727. doi: 10.1016/j.ccell.2017.11.017. Cancer Cell. 2017. PMID: 29232550
Similar articles
- A role for GLUT3 in glioblastoma cell invasion that is not recapitulated by GLUT1.
Libby CJ, Gc S, Benavides GA, Fisher JL, Williford SE, Zhang S, Tran AN, Gordon ER, Jones AB, Tuy K, Flavahan W, Gordillo J, Long A, Cooper SJ, Lasseigne BN, Augelli-Szafran CE, Darley-Usmar V, Hjelmeland AB. Libby CJ, et al. Cell Adh Migr. 2021 Dec;15(1):101-115. doi: 10.1080/19336918.2021.1903684. Cell Adh Migr. 2021. PMID: 33843470 Free PMC article. - Novel Integrin αvβ3-Specific Ligand for the Sensitive Diagnosis of Glioblastoma.
Zhang L, Shan X, Meng X, Gu T, Guo L, An X, Jiang Q, Ge H, Ning X. Zhang L, et al. Mol Pharm. 2019 Sep 3;16(9):3977-3984. doi: 10.1021/acs.molpharmaceut.9b00602. Epub 2019 Jul 29. Mol Pharm. 2019. PMID: 31306580 - Glut3 Addiction: A Druggable Vulnerability in Glioblastoma.
Bunda S, Zadeh G, Aldape KD. Bunda S, et al. Cancer Cell. 2017 Dec 11;32(6):726-727. doi: 10.1016/j.ccell.2017.11.017. Cancer Cell. 2017. PMID: 29232550 - miR-3189-targeted GLUT3 repression by HDAC2 knockdown inhibits glioblastoma tumorigenesis through regulating glucose metabolism and proliferation.
Kwak S, Park SH, Kim SH, Sung GJ, Song JH, Jeong JH, Kim H, Ha CH, Kim SW, Choi KC. Kwak S, et al. J Exp Clin Cancer Res. 2022 Mar 8;41(1):87. doi: 10.1186/s13046-022-02305-5. J Exp Clin Cancer Res. 2022. PMID: 35260183 Free PMC article. - Glucose transport: meeting the metabolic demands of cancer, and applications in glioblastoma treatment.
Labak CM, Wang PY, Arora R, Guda MR, Asuthkar S, Tsung AJ, Velpula KK. Labak CM, et al. Am J Cancer Res. 2016 Aug 1;6(8):1599-608. eCollection 2016. Am J Cancer Res. 2016. PMID: 27648352 Free PMC article. Review.
Cited by
- An Experimentally Defined Hypoxia Gene Signature in Glioblastoma and Its Modulation by Metformin.
Calvo Tardón M, Marinari E, Migliorini D, Bes V, Tankov S, Charrier E, McKee TA, Dutoit V, Dietrich PY, Cosset E, Walker PR. Calvo Tardón M, et al. Biology (Basel). 2020 Sep 2;9(9):264. doi: 10.3390/biology9090264. Biology (Basel). 2020. PMID: 32887267 Free PMC article. - Transcript Analysis of Zebrafish GLUT3 Genes, slc2a3a and slc2a3b, Define Overlapping as Well as Distinct Expression Domains in the Zebrafish (Danio rerio) Central Nervous System.
Lechermeier CG, Zimmer F, Lüffe TM, Lesch KP, Romanos M, Lillesaar C, Drepper C. Lechermeier CG, et al. Front Mol Neurosci. 2019 Aug 27;12:199. doi: 10.3389/fnmol.2019.00199. eCollection 2019. Front Mol Neurosci. 2019. PMID: 31507372 Free PMC article. - NOX4 regulates TGFβ-induced proliferation and self-renewal in glioblastoma stem cells.
García-Gómez P, Golán I, S Dadras M, Mezheyeuski A, Bellomo C, Tzavlaki K, Morén A, Carreras-Puigvert J, Caja L. García-Gómez P, et al. Mol Oncol. 2022 May;16(9):1891-1912. doi: 10.1002/1878-0261.13200. Epub 2022 Mar 14. Mol Oncol. 2022. PMID: 35203105 Free PMC article. - ITGB3/CD61: a hub modulator and target in the tumor microenvironment.
Zhu C, Kong Z, Wang B, Cheng W, Wu A, Meng X. Zhu C, et al. Am J Transl Res. 2019 Dec 15;11(12):7195-7208. eCollection 2019. Am J Transl Res. 2019. PMID: 31934272 Free PMC article. Review. - YAP1 and its fusion proteins in cancer initiation, progression and therapeutic resistance.
Szulzewsky F, Holland EC, Vasioukhin V. Szulzewsky F, et al. Dev Biol. 2021 Jul;475:205-221. doi: 10.1016/j.ydbio.2020.12.018. Epub 2021 Jan 8. Dev Biol. 2021. PMID: 33428889 Free PMC article. Review.
References
- Aguirre-Gamboa R, Gomez-Rueda H, Martinez-Ledesma E, Martinez-Torteya A, Chacolla-Huaringa R, Rodriguez-Barrientos A, Tamez-Pena JG, Trevino V. SurvExpress: an online biomarker validation tool and database for cancer gene expression data using survival analysis. PLoS ONE. 2013;8:e74250. - PMC - PubMed
- Boado RJ, Black KL, Pardridge WM. Gene expression of GLUT3 and GLUT1 glucose transporters in human brain tumors. Brain Res Mol Brain Res. 1994;27:51–57. - PubMed
MeSH terms
Substances
LinkOut - more resources
Full Text Sources
Other Literature Sources
Medical
Research Materials
