TRPM7 kinase activity is essential for T cell colonization and alloreactivity in the gut - PubMed (original) (raw)
doi: 10.1038/s41467-017-01960-z.
Valentina Vettore 3, Tanja Rezzonico-Jost 1, Sarah Hampe 3, Elsa Rottoli 4, Wiebke Nadolni 3, Michela Perotti 1, Melanie A Meier 3, Constanze Hermanns 3, Sheila Geiger 3, Gunther Wennemuth 5, Camilla Recordati 6, Masayuki Matsushita 7, Susanne Muehlich 3, Michele Proietti 1 8, Vladimir Chubanov 3, Thomas Gudermann 3, Fabio Grassi 9 10 [ 11](#full-view-affiliation-11 "Istituto Nazionale Genetica Molecolare "Romeo ed Enrica Invernizzi", Via Francesco Sforza, 35-20122, Milan, Italy. fabio.grassi@irb.usi.ch."), Susanna Zierler 12
Affiliations
- PMID: 29203869
- PMCID: PMC5714948
- DOI: 10.1038/s41467-017-01960-z
TRPM7 kinase activity is essential for T cell colonization and alloreactivity in the gut
Andrea Romagnani et al. Nat Commun. 2017.
Abstract
The melastatin-like transient-receptor-potential-7 protein (TRPM7), harbouring a cation channel and a serine/threonine kinase, has been implicated in thymopoiesis and cytokine expression. Here we show, by analysing TRPM7 kinase-dead mutant (Trpm7 R/R ) mice, that the enzymatic activity of the receptor is not essential for thymopoiesis, but is required for CD103 transcription and gut-homing of intra-epithelial lymphocytes. Defective T cell gut colonization reduces MHCII expression in intestinal epithelial cells. Mechanistically, TRPM7 kinase activity controls TGF-β-induced CD103 expression and pro-inflammatory T helper 17, but not regulatory T, cell differentiation by modulating SMAD2. Notably, we find that the TRPM7 kinase activity promotes gut colonization by alloreactive T cells in acute graft-versus-host disease. Thus, our results unravel a function of TRPM7 kinase in T cell activity and suggest a therapeutic potential of kinase inhibitors in averting acute graft-versus-host disease.
Conflict of interest statement
The authors declare no competing financial interests.
Figures
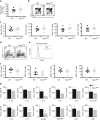
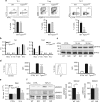
Fig. 1
Normal T cell development in Trpm7 R/R mice but altered cytokine secretion. a Total WT or Trpm7 R/R cell recovery from thymus. b Representative dot plot analysis of thymocytes from WT or Trpm7 R/R thymi stained with CD4 and CD8 mAbs. Percentages are shown in each gate. c Dot charts comparing the total number of thymocytes in the double-negative (DN), double-positive (DP), CD4+, and CD8+ thymocytes are shown (mean ± s.e.m. n = 5). d Representative dot plot analysis of thymocytes gated on DN cells from WT or Trpm7 R/R thymi stained with CD44 and CD25 mAbs. Percentages are shown in each gate. e Representative histogram overlay of cell surface CD25 in WT or Trpm7 R/R thymocytes. f Dot charts showing the number of total cells (mean ± s.e.m. n = 5) of DN population found in the DN1, DN2, DN3 and DN4 stages. Data are representative results of two independent experiments with five mice per experiment. g Basal cytokine levels evaluated in serum of WT (black, n = 3–7) and Trpm7 R/R (grey, n = 3–7) mice, respectively, and shown as pg ml−1. Bar charts indicate mean ± s.e.m. A total number of seven mice were used for each genotype. Note a significant reduction of serum levels of IL-17 and G-CSF in Trpm7 R/R. A two-tailed Student’s t test was used with *p < 0.05; **p < 0.01 and ***p < 0.001
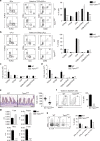
Fig. 2
Selectively reduced intra-epithelial lymphocytes in Trpm7 R/R mice. a Dot plot (left) and statistical analyses (right) of intra-epithelial lymphocytes (IEL) from WT or Trpm7 R/R mice stained as indicated. Percentages are shown in each gate, bar charts show mean percentages ± s.e.m. (WT, n = 6; Trpm7 R/R, n = 7). b Dot plot (left) and statistical analyses (right) of lamina propria lymphocytes (LPL) from WT or Trpm7 R/R mice stained as indicated. Percentages are shown in each gate, bar charts show mean percentages ± s.e.m. (n = 7). c Absolute numbers (WT, n = 6; Trpm7 R/R, n = 7) of the indicated IELs subsets. Bar charts show mean percentages ± s.e.m. d Absolute numbers (mean ± s.e.m. n = 7) of the indicated LPL subsets. e CD3 immunohistochemical staining of small intestine sections of WT or Trpm7 R/R mice and relative quantification (right). Scale bars indicate 100 µm. f Dot blots and statistical analyses of MHCII expression in EpCAM+ intestinal epithelial cells (IEC). Percentages are shown in each gate, bar charts show mean percentages ± s.e.m. (n = 3). g Quantitative real-time PCR of T-bet, Foxp3, Rorc and Il-17a expression in purified TCRαβ+CD4+ IELs from WT or Trpm7 R/R mice. h Dot plot and statistical analyses of IFN-γ and IL-17A staining in WT or Trpm7 R/R TCRαβ+CD4+ IELs. Percentages are shown in each gate, bar charts show mean percentages ± s.e.m. (WT, n = 5; Trpm7 R/R, n = 8). Data are representative results of at least 3 independent experiments. A two-tailed Student’s t test was used with *p < 0.05; **p < 0.01 and ***p < 0.001
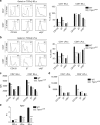
Fig. 3
Trpm7 R/R mutation affects αEβ7 expression in T cells. a Representative histogram overlay of cell surface CD103, β7 and α4β7 expression of intra-epithelial lymphocytes (IEL, left) and relative statistical analysis (right). Percentages are shown in each gate, bar charts show mean percentages ± s.e.m. (n = 4). b Representative histogram overlay of cell surface CD103, β7 and α4β7 expression of lamina propria lymphocytes (LPL, left) and relative statistical analysis (right). Percentages are shown in each gate, bar charts show mean percentages ± s.e.m. (n = 4). c Surface CD103, β7, and α4β7 expression in IELs, bar charts show mean fluorescence intensity ± s.e.m. (n = 5). d Surface CD103, β7 and α4β7 expression of LPLs, bar charts show mean fluorescence intensity ± s.e.m. (n = 5). e Quantitative real-time PCR of Itgae expression in purified TCRαβ+CD4+ lymphocytes from spleen (SPL), lamina propria (LPL) or intra-epithelium (IEL). Data are representative results of at least 3 independent experiments. A two-tailed Student’s t test was used with *p < 0.05; **p < 0.01 and ***p < 0.001
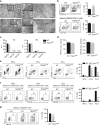
Fig. 4
TRPM7 kinase-dead T cell autonomous defect in in vivo CD103 expression and intra-epithelial localization. a Transmission electron microscopic (TEM) images of small intestine (upper panel) and colon (lower panel) sections from WT or Trpm7 R/R mice. Note no changes in tight junction, adherens junction or desmosome formation between the two genotypes. Scale bars indicate 500 and 200 nm, respectively. b Dot plot (left) and statistical analyses (right) of CD11c+MHCII+ DC and relative CD103 expression. Percentages are shown in each gate, bar charts show mean percentages ± s.e.m. (n = 3). c Quantitative real-time PCR of Tgf-β1, Tgf-β2 and Tgf-β3 expression in WT or Trpm7 R/R purified CD11c+MHCII+ DC cells (left) or in EpCAM+ IEC (right). d TGF-β1 and TGF-β2 levels measured in serum harvested from WT or Trpm7 R/R mice (n = 4). Data are shown as mean ± s.e.m. e Dot plot and statistical analyses of spleen (SPL), lamina propria (LPL) and intra-epithelial (IEL) TCRαβ+ CD4+ lymphocytes from Rag1 −_/− /Il2rg −/− mice reconstituted with purified WT or Trpm7 R/R naive CD4 cells. f Cells were gated for surface CD4 and TCRαβ and were analysed for CD103 expression. Percentages are shown in each gate, bar charts show mean percentages ± s.e.m. (n = 4). g Dot plots and statistical analyses of MHCII expression in EpCAM+ intestinal epithelial cells (IEC) from Rag1 −/− /Il2rg −/_− mice reconstituted with purified WT or Trpm7 R/R naive T cells. Percentages are shown in each gate, bar charts show mean percentages ± s.e.m. (n = 4). Data are representative results of at least three independent experiments. A two-tailed Student’s t test was used with *p < 0.05; **p < 0.01 and ***p < 0.001
Fig. 5
Trpm7 R/R T cells have autonomous defects in in vitro Th17 polarization and CD103 upregulation. a Representative dot plots and statistical analyses of IFN-γ, IL-17A, CD25 and FOXP3 expression in stimulated naive T cells under Th1, Treg or Th17-polarizing conditions after 5 days of in vitro culture. Percentages are shown in each gate, bar charts show mean percentages ± s.e.m. (n = 4). b Quantitative real-time PCR of T-bet, ifn -γ, Rorc, and Il-17a expression in naive T cells stimulated under Th1 or Th17-polarizing conditions after 5 days of culture in vitro. (n = 3). c Western blot analysis of STAT3 phosphorylation (Tyr705) of control and IL-6 treated WT and Trpm7 R/R (R/R) naive T cells, respectively. Blots are representatives of at least three independent experiments. d Histogram overlays and statistical analyses of CD103 and β7 staining by flow cytometry in WT or Trpm7 R/R naive T cells stimulated with anti-CD3ε/anti-CD28 in the absence or presence of TGF-β (10 ng ml−1) for 4 days. Histograms show mean fluorescence intensity (MFI) ± s.e.m. (n = 4). Data are representative results of at least three independent experiments. e Quantitative real-time PCR of Itgae (CD103) in control (CTRL) and WT or Trpm7 R/R naive T cells stimulated with anti-CD3ε/anti-CD28 in the presence of TGF-β (5 ng ml−1) for 24 h. Data are shown as 2−ΔΔCP ± s.e.m. (n = 3). f Western blot and statistical analysis of SMAD2 (Ser465/467) and SMAD3 (Ser423/425) phosphorylation. Blots are representatives of at least four independent experiments. The semi-quantitative analysis was done via ImageJ software and plotted as percent increase in intensity of pSMAD/total SMAD compared to control. Bar charts show mean percentages ± s.e.m. for SMAD2 and SMAD3 (n = 4–5). A two-tailed Student’s t test was used with *p < 0.05; **p < 0.01 and ***p < 0.001. To demonstrate a significant increase in TGF-β-induced SMAD phosphorylation compared to untreated controls a one-way ANOVA was used with # p < 0.05
Fig. 6
TRPM7 kinase affects SMAD2 translocation via direct phosphorylation. a Analysis of pSMAD2 translocation into the nucleus. WT and Trpm7 R/R naive CD4+ T cells were co-stimulated with αCD3/αCD28 and 5 ng ml−1 TGF-β1 for 10 min. Representative western blot images depicting that pSMAD2 and total SMAD2 in the nuclear fraction (right) were strongly reduced in Trpm7 R/R T cells compared to WT. In the respective cytosolic fraction (left), the pSMAD2 was not detectable, however amounts of total SMAD2 were comparable between Trpm7 R/R and WT. b Concentration-dependent phosphorylation of human recombinant SMAD2-GST by TRPM7 kinase. Data have been obtained via RBC hotspot in vitro kinase assay using 4 µM ATP and 4 µM substrate at 2 h. RBC standard substrate was used as a positive control, substrate alone as a negative control and kinase activity alone was subtracted as background. Data have been converted to nM substrate phosphorylation and are plotted as mean ± s.e.m. Truncated recombinant SMAD2 (trun. SMAD2-GST) as well as the GST-tag alone were not phosphorylated, suggesting specific phosphorylation of SMAD2 at the c-terminal SXS motif. c Analysis of interaction between SMAD2 and TRPM7 in CD4+ T cells via proximity ligation assay (PLA). Scale bar indicates 10 µm. Note a significant increase in SMAD2 co-localization with TRPM7 in WT T cells treated with 5 ng ml−1 TGF-β1 (#### p < 0.0001; two-tailed Student’s t test). Trpm7 R/R T cells fail to recruit SMAD2 into close proximity to the TRPM7 kinase upon TGF-β1 stimulation compared to WT (****p < 0.0001; two-tailed Student’s t test). Bar graphs show mean PLA signals per cell counted in five fields of vision ± s.e.m. d ChIP assay was performed in untreated and TGF-β1 (5 ng ml−1) stimulated CD4+ T cells using a specific antibody against SMAD2 for immunoprecipitation. Primers for Itgae and Gapdh were used for qRT-PCR; Gapdh was used for normalization. Note a significant increase in -fold enrichment in TGF-β1-treated WT T cells compared to untreated controls (# p < 0.05, one-way analysis of variance) as well as a reduction in fold enrichment of TGF-β1-treated Trpm7 R/R T cells compared to WT (*p < 0.05, one-way ANOVA). Bar graphs show mean ± s.e.m
Fig. 7
TRPM7 kinase activity promotes destruction of the host intestinal epithelium by T cells during GVHD. a Representative picture of colon specimens at day 25 after BMT in recipients of WT or Trpm7 R/R splenocytes or (CTRL) bone marrow cells alone (left) and relative statistical analyses showing colon length (right). Bars represent mean ± s.e.m. (n = 5). b Survival of lethally irradiated BALB/c recipients of C57BL/6J bone marrow cells (BMC) alone (CTRL, triangle, dashed line) or in combination with WT (black circles) or Trpm7 R/R (R/R, grey squares) splenocytes (n = 10). c Dot plot and statistical analyses of TCRαβ+H-2b+ IELs cells from BALB/c mice reconstituted with WT or Trpm7 R/R splenocytes. Percentages are shown in each gate, bar charts show mean percentages ± s.e.m. (n = 3). d Dot plot and statistical analyses of MHCII expression in EpCAM+ IEC from BALB/c mice reconstituted with WT or Trpm7 R/R splenocytes. Percentages are shown in each gate, bar charts show mean percentages ± s.e.m. (n = 3). e Dot plot and statistical analyses of CD103 and β7 expression in electronically gated H-2b+TCRαβ+CD4+ or H-2b+TCRαβ+CD8+ IELs. Percentages are shown within each gate, bar charts show mean percentages ± s.e.m. (n = 3)
Similar articles
- TGFβR signalling controls CD103+CD11b+ dendritic cell development in the intestine.
Bain CC, Montgomery J, Scott CL, Kel JM, Girard-Madoux MJH, Martens L, Zangerle-Murray TFP, Ober-Blöbaum J, Lindenbergh-Kortleve D, Samsom JN, Henri S, Lawrence T, Saeys Y, Malissen B, Dalod M, Clausen BE, Mowat AM. Bain CC, et al. Nat Commun. 2017 Sep 20;8(1):620. doi: 10.1038/s41467-017-00658-6. Nat Commun. 2017. PMID: 28931816 Free PMC article. - TGF-{beta}-dependent CD103 expression by CD8(+) T cells promotes selective destruction of the host intestinal epithelium during graft-versus-host disease.
El-Asady R, Yuan R, Liu K, Wang D, Gress RE, Lucas PJ, Drachenberg CB, Hadley GA. El-Asady R, et al. J Exp Med. 2005 May 16;201(10):1647-57. doi: 10.1084/jem.20041044. J Exp Med. 2005. PMID: 15897278 Free PMC article. - Deletion of Trpm7 disrupts embryonic development and thymopoiesis without altering Mg2+ homeostasis.
Jin J, Desai BN, Navarro B, Donovan A, Andrews NC, Clapham DE. Jin J, et al. Science. 2008 Oct 31;322(5902):756-60. doi: 10.1126/science.1163493. Science. 2008. PMID: 18974357 Free PMC article. - CD103+ GALT DCs promote Foxp3+ regulatory T cells.
Siddiqui KR, Powrie F. Siddiqui KR, et al. Mucosal Immunol. 2008 Nov;1 Suppl 1:S34-8. doi: 10.1038/mi.2008.43. Mucosal Immunol. 2008. PMID: 19079226 Review. - TGF-β function in immune suppression.
Yoshimura A, Muto G. Yoshimura A, et al. Curr Top Microbiol Immunol. 2011;350:127-47. doi: 10.1007/82_2010_87. Curr Top Microbiol Immunol. 2011. PMID: 20680806 Review.
Cited by
- Identification of novel inhibitors of the transcriptional coactivator MRTF-A for HCC therapy.
Franz MJ, Wenisch P, Wohlleben P, Rupprecht L, Chubanov V, Gudermann T, Kyheröinen S, Vartiainen MK, Heinrich MR, Muehlich S. Franz MJ, et al. Mol Ther Oncol. 2024 Aug 6;32(3):200855. doi: 10.1016/j.omton.2024.200855. eCollection 2024 Sep 19. Mol Ther Oncol. 2024. PMID: 39262570 Free PMC article. - Structural mechanisms of TRPM7 activation and inhibition.
Nadezhdin KD, Correia L, Narangoda C, Patel DS, Neuberger A, Gudermann T, Kurnikova MG, Chubanov V, Sobolevsky AI. Nadezhdin KD, et al. Nat Commun. 2023 May 8;14(1):2639. doi: 10.1038/s41467-023-38362-3. Nat Commun. 2023. PMID: 37156763 Free PMC article. - CRAC Channels and Calcium Signaling in T Cell-Mediated Immunity.
Vaeth M, Kahlfuss S, Feske S. Vaeth M, et al. Trends Immunol. 2020 Oct;41(10):878-901. doi: 10.1016/j.it.2020.06.012. Epub 2020 Jul 22. Trends Immunol. 2020. PMID: 32711944 Free PMC article. Review. - Functional Expression of TRPV1 Ion Channel in the Canine Peripheral Blood Mononuclear Cells.
Bujak JK, Kosmala D, Majchrzak-Kuligowska K, Bednarczyk P. Bujak JK, et al. Int J Mol Sci. 2021 Mar 20;22(6):3177. doi: 10.3390/ijms22063177. Int J Mol Sci. 2021. PMID: 33804707 Free PMC article. - TRPM7 Upregulate the Activity of SMAD1 through PLC Signaling Way to Promote Osteogenesis of hBMSCs.
Hong F, Wu S, Zhang C, Li L, Chen J, Fu Y, Wang J. Hong F, et al. Biomed Res Int. 2020 May 22;2020:9458983. doi: 10.1155/2020/9458983. eCollection 2020. Biomed Res Int. 2020. PMID: 32596398 Free PMC article. Retracted.
References
Publication types
MeSH terms
Substances
LinkOut - more resources
Full Text Sources
Other Literature Sources
Molecular Biology Databases
Research Materials
Miscellaneous
