The unique histidine in OSCP subunit of F-ATP synthase mediates inhibition of the permeability transition pore by acidic pH - PubMed (original) (raw)
. 2018 Feb;19(2):257-268.
doi: 10.15252/embr.201744705. Epub 2017 Dec 7.
Kristen Jones 3, Salvatore Antonucci 1 2, Barbara Spolaore 4, Federico Fogolari 5, Valeria Petronilli 1 2, Valentina Giorgio 1 2, Michela Carraro 1 2, Fabio Di Lisa 1 2, Michael Forte 3, Ildikó Szabó 6, Giovanna Lippe 7, Paolo Bernardi 8 2
Affiliations
- PMID: 29217657
- PMCID: PMC5797955
- DOI: 10.15252/embr.201744705
The unique histidine in OSCP subunit of F-ATP synthase mediates inhibition of the permeability transition pore by acidic pH
Manuela Antoniel et al. EMBO Rep. 2018 Feb.
Abstract
The permeability transition pore (PTP) is a Ca2+-dependent mitochondrial channel whose opening causes a permeability increase in the inner membrane to ions and solutes. The most potent inhibitors are matrix protons, with channel block at pH 6.5. Inhibition is reversible, mediated by histidyl residue(s), and prevented by their carbethoxylation by diethylpyrocarbonate (DPC), but their assignment is unsolved. We show that PTP inhibition by H+ is mediated by the highly conserved histidyl residue (H112 in the human mature protein) of oligomycin sensitivity conferral protein (OSCP) subunit of mitochondrial F1FO (F)-ATP synthase, which we also show to undergo carbethoxylation after reaction of mitochondria with DPC. Mitochondrial PTP-dependent swelling cannot be inhibited by acidic pH in H112Q and H112Y OSCP mutants, and the corresponding megachannels (the electrophysiological counterpart of the PTP) are insensitive to inhibition by acidic pH in patch-clamp recordings of mitoplasts. Cells harboring the H112Q and H112Y mutations are sensitized to anoxic cell death at acidic pH. These results demonstrate that PTP channel formation and its inhibition by H+ are mediated by the F-ATP synthase.
Keywords: F‐ATP synthase; channel; mitochondria; permeability transition.
© 2017 The Authors.
Figures
Figure 1. Effect of acidic pH and DPC on the interactions of CyPD with F‐ATP synthase at OSCP and carbethoxylation of OSCP H112
- A
Bovine heart mitochondria were incubated at the indicated pH in the absence or presence of 200 μM DPC, treated with 1% (w/v) digitonin, and F‐ATP synthase was immunoprecipitated with an anti‐F‐ATP synthase Ab followed by 15% SDS–PAGE. β subunit and CyPD content were detected by Western blotting. The ratio between CyPD and the corresponding β subunit is reported in the lower part of the panel, referring to pH 7.4 values as 100%. Data are an average ± s.e. of three independent experiments. The _P_‐values calculated with the Student's _t_‐test are shown, ***P ≤ 0.001. - B, C
EDTA‐SMP were solubilized at the indicated pH values, extracted with 1% (w/v) digitonin, and subjected to BN‐PAGE in order to separate dimers (V d) and monomers (V m), which were identified by Coomassie blue (B) or in‐gel activity staining (C) and analyzed by densitometry, which is reported in the bottom part of each panel. Values report the dimer/monomer ratio, where the ratio at pH 7.4 was taken as 100%. Data are an average ± s.e. of three independent experiments. The _P_‐values calculated with the Student's _t_‐test are shown, *P ≤ 0.05 ***P ≤ 0.001. - D
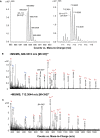
Sequence of peptides 95–113 of OSCP before (left panel) and after reaction with DPC (right panel) obtained from tryptic digests of the SDS–PAGE band corresponding to the expected molecular mass of OSCP in immunoprecipitated F‐ATP synthase. Fragments of the series b and y identified in the LC‐MS/MS analysis are indicated on the sequence of the peptides. H112 and H112CeT are indicated in red boldface. Ions y4–y17 show a mass shift of +72 Da in the modified peptide.
Figure 2. The PTP cannot be inhibited by acidic pH in cells with OSCP H112Q and H112Y replacements
- Permeabilized HEK293T cells expressing wild‐type (WT) or edited (H112Q or H112Y) OSCP subunit were suspended in KSCN‐based media at pH 7.4 (left traces) or pH 6.5 (right traces), and PTP opening was measured as the decrease in absorbance at 540 nm. Where indicated (arrows), 0.1 mM Ca2+ in the absence of further additions (black traces) or in the presence of 0.5 mM DPC (red traces) or 2 μM CsA (blue traces) was added. The bottom panel reports the difference between the absorbance readings before the addition of Ca2+ and at the end of the swelling phase. Data are mean ± s.e. of five experiments (triplicate samples) for Ca2+ alone (black bars) and Ca2+ + DPC (red bars) and of three experiments (duplicate samples) for Ca2+ + CsA (blue bars). Solid bars, pH 7.4; hatched bars, pH 6.5.
- Mitochondria were prepared from cells, suspended in sucrose buffer at pH 7.4 (solid bars) or 6.5 (hatched bars) in the absence (black bars) or presence (blue bars) of 1.6 μM CsA, extracted with 1% (w/v) digitonin, and immunoprecipitated with an F‐ATP synthase antibody. The immunoprecipitates were subjected to 12% SDS–PAGE followed by Western blotting for CyPD and α subunit of F‐ATP synthase. Each immunodetected band was analyzed by densitometry, and the ratio between CyPD and α subunit was measured and expressed relative to the ratio obtained in the absence of CsA at pH 7.4, which was taken as 100%. Data are average ± s.e. of six independent experiments.
- HEK293T cells were incubated in a balanced salt solution containing 2‐deoxyglucose at pH 7.4 (solid bars) or 6.5 (hatched bars) and anoxia induced by incubation in a BD GasPak EZ Anaerobe Gas‐generating Pouch System (BD Biosciences). Cell death was measured based on LDH release (average ± s.e. from eight independent experiments).
Data information: In all panels, the _P_‐values calculated with the Student's _t_‐test are shown (*P ≤ 0.05, **P ≤ 0.01, ***P ≤ 0.001).
Figure EV1. Mass spectrometry analysis of the DPC‐modified OSCP subunit from bovine heart F‐ATP synthase
- A
LC‐MS/MS data were acquired on the tryptic digest of the SDS–PAGE band corresponding to the theoretical molecular mass of OSCP separated from the immunoprecipitated ATP synthase. The m/z region of the ESI‐MS spectra acquired in the LC‐MS/MS analysis in which triply charged ions of peptide 95–113 (left panel, RT 16.8 min—experimental mass: 2,062.0504 Da, calculated mass: 2,062.034 Da) and 95–113CEt (right panel, RT 17.3 min—experimental mass: 2,134.0713 Da, calculated mass: 2,134.0551 Da) were detected is shown. The signal of the modified peptide was lower than that of the native peptide, a likely consequence of the instability of carbethoxylated His residues in peptides leading in turn to progressive loss of derivatization 17. - B, C
In the ESI‐MS/MS spectra of peptide 95–113 and 95–113CEt, ions assigned to fragments of the series y and b are indicated. Ions y4–y17 show a mass shift of +72 Da in the modified peptide.
Figure EV2. Mitochondrial swelling in KSCN‐based medium in mouse liver mitochondria and permeabilized HEK293T cells
- A, B
One hundred micrograms of mouse liver mitochondria (A) or 1 × 10⁶ wild‐type HEK293T cells (B) was suspended in KSCN‐based medium at pH 7.4. Final volume was 0.2 ml, and swelling was assessed as the decrease in absorbance at 540 nm. Where indicated (arrows), 0.5 mM (A) or 0.1 mM (B) Ca2+ was added. Red and blue traces: The medium was supplemented with 0.2 μM ruthenium red or 2 μM CsA, respectively. Where indicated, 10 μM alamethicin was added. Traces shown are representative of quadruplicate samples from two independent experiments per condition.
Figure EV3. OSCP H112Y and H112Q replacements do not affect ATPase inhibition by acidic pH and cellular oxygen consumption rate
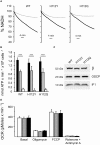
- Permeabilized HEK293T cells expressing wild‐type (WT) or edited (H112Y or H112Q) OSCP subunit were suspended as specified in Materials and Methods at pH 7.4 (closed trace) or pH 6.5 (gray trace), and ATP hydrolysis was measured as the decrease in NADH absorbance at 340 nm. One representative trace per condition (out of at least three biological replicates in triplicate) is shown as % of the initial value.
- Rate of resveratrol‐sensitive ATP hydrolysis at pH 7.4 (closed bars), pH 6.5 initial phase (gray bars), and pH 6.5 final phase (open bars). Data are average ± s.e. of four independent experiments. _P_‐values shown are calculated with the Student's _t_‐test (***P ≤ 0.001).
- Mitochondria were isolated from wild‐type, H112Y and H112Q cells and evaluated by Western blotting for β subunit (β), OSCP and IF1. Molecular size is indicated on the left.
- Respiration was assessed using a Seahorse XF24 extracellular flux analyzer. Oxygen consumption rate (OCR) was recorded without additions (Basal) followed by the addition of 1 μg/ml oligomycin, 0.1 μM FCCP, or 1 μM rotenone and 1 μM antimycin A. Open, gray and closed bars refer to wild‐type, H112Q and H112Y OSCP mutants, respectively. Data are average ± s.e.m. of six independent experiments.
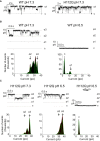
Figure 3. H112Q replacement in OSCP does not affect single channel features of the MMC in mitoplasts but renders it insensitive to acidification
- Representative current traces recorded at V (pipette) +10 mV from mitoplasts derived from wild‐type (WT) or H112Q OSCP mutation‐harboring cells.
- Channel activity (top) and corresponding amplitude histograms (bottom) recorded in wild‐type mitochondria before (WT pH 7.3) and after acidification to pH 6.5 (WT pH 6.5). Amplitude histograms were obtained from 120‐s‐long current traces for the corresponding pH values, and the panels are from the same experiment.
- Recordings as in (B) from mitoplasts of cells harboring the OSCP H112Q replacement. Left panel, pH 7.3; middle panel, 440 s after acidification to pH 6.5; right panel, 30 s after the addition of 5 mM Ba2+ at pH 6.5. Amplitude histograms were obtained from 100‐s‐long segments, and the panels are from the same experiment.
Data information: Note that both in panels (B and C) well‐visible subconductance states can be detected in the amplitude histograms (peaks between open levels o2 and o3 on left panels). Gaussian fitting has been obtained using the Origin Program set. In all panels: c, closed; o1, o2, o3 open states with discrete subconductance.
Figure EV4. Representative current traces of patch‐clamp experiments on mitoplasts
- A–C
Current traces were recorded at an applied pipette voltage of +10 mV in WT (A), H112Q (B), and H112Y mitoplasts (C). Note the presence of substates (arrows) typical of the mitochondrial megachannel 39. The recordings also document the half‐conductance substate that was prevalently observed. In panel (C), activity was recorded at pH 7.3 (left) followed by the addition of 0.1 M HCl to the recording chamber to obtain pH 6.5, and recording was resumed 310 s later (right).
Figure 4. Effect of H112 protonation on OSCP molecular dynamics and sequence comparison of OSCP across species
The left panel depicts a cryo‐EM based atomic model of monomeric bovine F‐ATP synthase (pdb 5ara) (excluding subunits e, f, g, DAPIT, 6.8PL, and A6L) with OSCP (cyan) and subunit b (yellow) highlighted on the structure of F‐ATP synthase in the lower part of the panel. The region H112‐E115 is shown as van der Waals spheres (inflated for better visibility). The backbone of the stretch T130‐K135 is shown in red van der Waals spheres. The top part of the panel shows the results of restrained molecular dynamics simulations of the isolated lateral stalk (OSCP and subunits b, d, F6) displaying a large number of conformations in this region. Snapshots taken at 1‐ns intervals along the last 15 ns of the trajectory are shown for the fragment 112‐HRGE‐115 for the deprotonated (HIS) and the protonated form (HIS+). Only for protonated H112, a salt bridge with a well‐defined turn or helix arrangement at H112‐E115 is found in a large number of MD conformations. The larger conformational variability of the deprotonated form can also be appreciated. The right panel reports a sequence comparison of OSCP across 16 out of 197 species (HRGE is boxed in red; Sauria sequences are in the thin black box). Conservation, quality of the alignment and consensus at each position in the alignment of all vertebrate sequences in RefSeq, excluding Sauria and most divergent sequences, are described in the documentation of the program JalView 67.
Similar articles
- Permeability transition in human mitochondria persists in the absence of peripheral stalk subunits of ATP synthase.
He J, Carroll J, Ding S, Fearnley IM, Walker JE. He J, et al. Proc Natl Acad Sci U S A. 2017 Aug 22;114(34):9086-9091. doi: 10.1073/pnas.1711201114. Epub 2017 Aug 7. Proc Natl Acad Sci U S A. 2017. PMID: 28784775 Free PMC article. - Purified F-ATP synthase forms a Ca2+-dependent high-conductance channel matching the mitochondrial permeability transition pore.
Urbani A, Giorgio V, Carrer A, Franchin C, Arrigoni G, Jiko C, Abe K, Maeda S, Shinzawa-Itoh K, Bogers JFM, McMillan DGG, Gerle C, Szabò I, Bernardi P. Urbani A, et al. Nat Commun. 2019 Sep 25;10(1):4341. doi: 10.1038/s41467-019-12331-1. Nat Commun. 2019. PMID: 31554800 Free PMC article. - Ca2+ binding to F-ATP synthase β subunit triggers the mitochondrial permeability transition.
Giorgio V, Burchell V, Schiavone M, Bassot C, Minervini G, Petronilli V, Argenton F, Forte M, Tosatto S, Lippe G, Bernardi P. Giorgio V, et al. EMBO Rep. 2017 Jul;18(7):1065-1076. doi: 10.15252/embr.201643354. Epub 2017 May 15. EMBO Rep. 2017. PMID: 28507163 Free PMC article. - OSCP subunit of mitochondrial ATP synthase: role in regulation of enzyme function and of its transition to a pore.
Giorgio V, Fogolari F, Lippe G, Bernardi P. Giorgio V, et al. Br J Pharmacol. 2019 Nov;176(22):4247-4257. doi: 10.1111/bph.14513. Epub 2018 Nov 28. Br J Pharmacol. 2019. PMID: 30291799 Free PMC article. Review. - From ATP to PTP and Back: A Dual Function for the Mitochondrial ATP Synthase.
Bernardi P, Di Lisa F, Fogolari F, Lippe G. Bernardi P, et al. Circ Res. 2015 May 22;116(11):1850-62. doi: 10.1161/CIRCRESAHA.115.306557. Circ Res. 2015. PMID: 25999424 Free PMC article. Review.
Cited by
- Fondation Leducq Transatlantic Network of Excellence Targeting Mitochondria to Treat Heart Disease.
Murphy E, Bernardi P, Cohen M, Di Lisa F, Forte M, Molkentin JD, Ovize M. Murphy E, et al. Circ Res. 2019 Apr 26;124(9):1294-1296. doi: 10.1161/CIRCRESAHA.119.314893. Circ Res. 2019. PMID: 31021720 Free PMC article. No abstract available. - Cytoplasmic and Mitochondrial Calcium Signaling: A Two-Way Relationship.
Wacquier B, Combettes L, Dupont G. Wacquier B, et al. Cold Spring Harb Perspect Biol. 2019 Oct 1;11(10):a035139. doi: 10.1101/cshperspect.a035139. Cold Spring Harb Perspect Biol. 2019. PMID: 31110132 Free PMC article. Review. - Routes for Potassium Ions across Mitochondrial Membranes: A Biophysical Point of View with Special Focus on the ATP-Sensitive K+ Channel.
Kravenska Y, Checchetto V, Szabo I. Kravenska Y, et al. Biomolecules. 2021 Aug 8;11(8):1172. doi: 10.3390/biom11081172. Biomolecules. 2021. PMID: 34439838 Free PMC article. Review. - Mitochondrial Ion Channels of the Inner Membrane and Their Regulation in Cell Death Signaling.
Urbani A, Prosdocimi E, Carrer A, Checchetto V, Szabò I. Urbani A, et al. Front Cell Dev Biol. 2021 Jan 5;8:620081. doi: 10.3389/fcell.2020.620081. eCollection 2020. Front Cell Dev Biol. 2021. PMID: 33585458 Free PMC article. Review. - Mitochondria in acute myocardial infarction and cardioprotection.
Ramachandra CJA, Hernandez-Resendiz S, Crespo-Avilan GE, Lin YH, Hausenloy DJ. Ramachandra CJA, et al. EBioMedicine. 2020 Jul;57:102884. doi: 10.1016/j.ebiom.2020.102884. Epub 2020 Jul 10. EBioMedicine. 2020. PMID: 32653860 Free PMC article. Review.
References
- Raaflaub J (1953) Die schwellung isolierter leberzell mitochondrien und ihre physikalisch beeinfluβarkeit. Helv Physiol Pharmacol Acta 11: 142–156 - PubMed
- Chinopoulos C, Adam‐Vizi V (2010) Mitochondria as ATP consumers in cellular pathology. Biochem Biophys Acta 1802: 221–227 - PubMed
- Pfeiffer DR, Kuo TH, Tchen TT (1976) Some effects of Ca2+, Mg2+, and Mn2+ on the ultrastructure, light‐scattering properties, and malic enzyme activity of adrenal cortex mitochondria. Arch Biochem Biophys 176: 556–563 - PubMed
- Hunter DR, Haworth RA, Southard JH (1976) Relationship between configuration, function, and permeability in calcium‐treated mitochondria. J Biol Chem 251: 5069–5077 - PubMed
Publication types
MeSH terms
Substances
LinkOut - more resources
Full Text Sources
Other Literature Sources
Miscellaneous


