Transcription Factor Activities Enhance Markers of Drug Sensitivity in Cancer - PubMed (original) (raw)
. 2018 Feb 1;78(3):769-780.
doi: 10.1158/0008-5472.CAN-17-1679. Epub 2017 Dec 11.
Francesco Iorio 1 2, Angela Matchan 2 3, Nuno Fonseca 1, Patricia Jaaks 3, Gareth Peat 1 2, Miguel Pignatelli 1 2, Fiammetta Falcone 4, Cyril H Benes 5, Ian Dunham 1 2, Graham Bignell 2 3, Simon S McDade 4, Mathew J Garnett 2 3, Julio Saez-Rodriguez 6 2 7
Affiliations
- PMID: 29229604
- PMCID: PMC6522379
- DOI: 10.1158/0008-5472.CAN-17-1679
Transcription Factor Activities Enhance Markers of Drug Sensitivity in Cancer
Luz Garcia-Alonso et al. Cancer Res. 2018.
Abstract
Transcriptional dysregulation induced by aberrant transcription factors (TF) is a key feature of cancer, but its global influence on drug sensitivity has not been examined. Here, we infer the transcriptional activity of 127 TFs through analysis of RNA-seq gene expression data newly generated for 448 cancer cell lines, combined with publicly available datasets to survey a total of 1,056 cancer cell lines and 9,250 primary tumors. Predicted TF activities are supported by their agreement with independent shRNA essentiality profiles and homozygous gene deletions, and recapitulate mutant-specific mechanisms of transcriptional dysregulation in cancer. By analyzing cell line responses to 265 compounds, we uncovered numerous TFs whose activity interacts with anticancer drugs. Importantly, combining existing pharmacogenomic markers with TF activities often improves the stratification of cell lines in response to drug treatment. Our results, which can be queried freely at dorothea.opentargets.io, offer a broad foundation for discovering opportunities to refine personalized cancer therapies.Significance: Systematic analysis of transcriptional dysregulation in cancer cell lines and patient tumor specimens offers a publicly searchable foundation to discover new opportunities to refine personalized cancer therapies. Cancer Res; 78(3); 769-80. ©2017 AACR.
©2017 American Association for Cancer Research.
Conflict of interest statement
Disclosure of Potential Conflicts of Interest
All the authors declare that they have no competing interests.
Figures
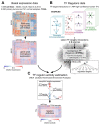
Figure 1. Estimation of Transcription Factor (TF) activities overview.
A) RNA-seq basal gene expression in cell lines data and TCGA samples (normal and tumors together) was processed separately to obtain normalised log-counts per million (CPM) that were then gene-wise normalised using a kernel estimation of the cumulative density function (kcdf). B) Consensus TFs regulons (CTFRs) were derived by selecting TF-target interactions observed in at least 2 sources among a collection of databases. In final CTFRs, targets under > 10 TFs and TFs with < 3 targets are removed. C) Estimation of single-sample TF activities from gene expression data and the CTFRs using the aREA algorithm from VIPER. Normal and tumor TCGA samples were analysed together.
Figure 2. Transcription Factor (TF) activities across primary tumors and cancer cell lines.
A) Heatmap of the differential TF activity (log fold change) between normal and tumoral samples across 14 tumor types. Red and blue indicate lower- and higher-activity in tumors, respectively, whereas white indicates non-significant (adj. p>0.05) associations. Only TFs with significant in at least 50% of the tumors are plotted. B) Tumor type similarity: Correlation based hierarchical clustering of tumor type-level TF activities for 23 primary tumors. C) Comparison of TF activities between primary tumors and cell lines for 19 common tumor types. Each value in the heatmap represents the pearson correlation coefficients between tumor type-level TF activities. Asterisks indicate significant correlations (adj. p<0.05). D) Activity distributions for tissue-specific TFs. Each point represents the TF activity in a given patient or cell line.
Figure 3. Functional characterisation of mutant Transcription Factor (TF) on transcriptional activities.
A) Functional evaluation of TF mutations on their own activity. B) Boxplot depicting TF activities according TP53 mutation zygosity in cell lines. C) Comparison of the predicted effect size of significant TP53 mutations between primary tumors and cell lines. D) Systematic characterisation of mutant TFs in primary tumors. Each bar represents the number of significant mutant groups in the TF impacting its activity. Red and blue indicate positive and negative effects, respectively. E) Boxplots comparing TF activities across different variants for NFE2L2, AHR, FOXA1, REST and SREBF2. Red dots indicate that the mutation is reported in COSMIC v70.
Figure 4. Functional characterisation of driver mutations on Transcription Factor (TF) activities.
A) Volcano plot with effect size (x) and adjusted p-value (y) of all tested pancancer associations. B) Number of significant associations per TF in primary tumors and cell lines, coloured according to the sign of the association: red and blue correspond to significantly higher or lower TF activities in mutants compared to wild-type, respectively. C) Significant (FDR<5%) the TF-driver associations from primary tumors and cell lines and the overlap. Shared driver-TF pairs are indicated in the table. D) Log odds-ratio of finding a significant interaction by network distance (minimum number of directed intermediates between the driver and the corresponding TF). ** indicates p<0.05; ***p<0.001 (FET). E) Enrichment in positive/negative driver-TF associations (red/blue, respectively) to involve oncogenic/tumor-suppressor TFs, respectively.
Figure 5. Associations between Transcription Factor (TF) activities and drug sensitivity.
A) Frequency of TFs in significant pancancer TF-drug associations. B) Enrichment p-values for drug classes that are overrepresented among significant pancancer associations. C and D) Heatmaps of significant associations with with drugs targeting ERK-MAPK pathway (C) and cytotoxic drugs (D). E) Volcano plot with effect size (x) and adjusted p-value (y) of all tested pancancer TF-drug associations. Red and blue indicate positive (resistance) and negative (sensitivity) effects, respectively. F) Volcano plot with effect size (x) and adjusted p-value (y) of all tested cancer-specific TF-drug associations. G) Examples of cancer-specific TF-drug associations. Red and blue indicate positive (resistance) and negative (sensitivity) effects, respectively.
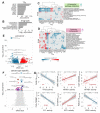
Figure 6. Modelling the combined effect on drug sensitivity of known pharmacogenomic markers and Transcription Factor (TF) activities.
A) Analysis strategy: 2 pharmacogenomic regression models are built, one without any TF information (null model) and another including the activity of a TF (test model). Both models are compared using a Likelihood Ratio test. B) Improvement of the association TP53MUTNutlin-3a by including TP53 TF activity. C) Improvement of the association BRAFMUT-Dabrafenib by including ATF2 TF activity. D) Improvement of the association BRAFMUT-Trametinib by including JUND TF activity. Left box represents the top TFs improving the null pharmacogenomic model. Indicated p-values are nominal, with FDR<0.05. First boxplot represents the IC50 (y) in mutant (blue) and WT (red) samples (x). The second scatterplot represents the IC50 (y) and the predicted TF activity (x). The third scatterplot represents the interaction between the IC50 (y) and the predicted TF activity (x) in mutant (blue) and WT (red) samples. The fourth boxplot represents the IC50 (y) in mutant and WT samples (x) coloured according to the TF activity (low: activity<-1; basal: -1<activity<1; high: activity>1).
Similar articles
- Genetic dependencies associated with transcription factor activities in human cancer cell lines.
Thatikonda V, Supper V, Wachter J, Kaya O, Kombara A, Bilgilier C, Ravichandran MC, Lipp JJ, Sharma R, Badertscher L, Boghossian AS, Rees MG, Ronan MM, Roth JA, Grosche S, Neumüller RA, Mair B, Mauri F, Popa A. Thatikonda V, et al. Cell Rep. 2024 May 28;43(5):114175. doi: 10.1016/j.celrep.2024.114175. Epub 2024 Apr 30. Cell Rep. 2024. PMID: 38691456 - Genetic Interactions and Tissue Specificity Modulate the Association of Mutations with Drug Response.
Cramer D, Mazur J, Espinosa O, Schlesner M, Hübschmann D, Eils R, Staub E. Cramer D, et al. Mol Cancer Ther. 2020 Mar;19(3):927-936. doi: 10.1158/1535-7163.MCT-19-0045. Epub 2019 Dec 11. Mol Cancer Ther. 2020. PMID: 31826931 - Cell-Line Selectivity Improves the Predictive Power of Pharmacogenomic Analyses and Helps Identify NADPH as Biomarker for Ferroptosis Sensitivity.
Shimada K, Hayano M, Pagano NC, Stockwell BR. Shimada K, et al. Cell Chem Biol. 2016 Feb 18;23(2):225-235. doi: 10.1016/j.chembiol.2015.11.016. Epub 2016 Feb 4. Cell Chem Biol. 2016. PMID: 26853626 Free PMC article. - Targeting nuclear transporters in cancer: Diagnostic, prognostic and therapeutic potential.
Stelma T, Chi A, van der Watt PJ, Verrico A, Lavia P, Leaner VD. Stelma T, et al. IUBMB Life. 2016 Apr;68(4):268-80. doi: 10.1002/iub.1484. Epub 2016 Mar 11. IUBMB Life. 2016. PMID: 26970212 Review. - [Polygenetic pharmacogenomic strategies to identify drug sensitivity biomarkers].
Nishiyama M. Nishiyama M. Gan To Kagaku Ryoho. 2005 Nov;32(12):1902-7. Gan To Kagaku Ryoho. 2005. PMID: 16282724 Review. Japanese.
Cited by
- On the identification of differentially-active transcription factors from ATAC-seq data.
Gerbaldo FE, Sonder E, Fischer V, Frei S, Wang J, Gapp K, Robinson MD, Germain PL. Gerbaldo FE, et al. PLoS Comput Biol. 2024 Oct 23;20(10):e1011971. doi: 10.1371/journal.pcbi.1011971. eCollection 2024 Oct. PLoS Comput Biol. 2024. PMID: 39441876 Free PMC article. - ResisenseNet hybrid neural network model for predicting drug sensitivity and repurposing in breast Cancer.
Karampuri A, Jakkula BK, Perugu S. Karampuri A, et al. Sci Rep. 2024 Oct 14;14(1):23949. doi: 10.1038/s41598-024-71076-0. Sci Rep. 2024. PMID: 39397003 Free PMC article. - RNA sequencing identifies lung cancer lineage and facilitates drug repositioning.
Zeng L, Zhang L, Li L, Liao X, Yin C, Zhang L, Chen X, Sun J. Zeng L, et al. PeerJ. 2024 Sep 24;12:e18159. doi: 10.7717/peerj.18159. eCollection 2024. PeerJ. 2024. PMID: 39346064 Free PMC article. - Purinergic exposure induces epigenomic and transcriptomic-mediated preconditioning resembling epilepsy-associated microglial states.
Martins-Ferreira R, Calafell-Segura J, Chaves J, Ciudad L, Martins da Silva A, Pinho E Costa P, Leal B, Ballestar E. Martins-Ferreira R, et al. iScience. 2024 Jul 20;27(8):110546. doi: 10.1016/j.isci.2024.110546. eCollection 2024 Aug 16. iScience. 2024. PMID: 39184445 Free PMC article. - An unbiased lncRNA dropout CRISPR-Cas9 screen reveals RP11-350G8.5 as a novel therapeutic target for multiple myeloma.
Grillone K, Ascrizzi S, Cremaschi P, Amato J, Polerà N, Croci O, Rocca R, Riillo C, Conforti F, Graziano R, Brancaccio D, Caracciolo D, Alcaro S, Pagano B, Randazzo A, Tagliaferri P, Iorio F, Tassone P. Grillone K, et al. Blood. 2024 Oct 17;144(16):1705-1721. doi: 10.1182/blood.2023021991. Blood. 2024. PMID: 39158066 Free PMC article.
References
- Levine AJ. p53, the Cellular Gatekeeper for Growth and Division. Cell. 1997;88:323–31. - PubMed
- Semenza GL. Hypoxia-inducible factor 1: oxygen homeostasis and disease pathophysiology. Trends Mol Med. 2001;7:345–50. - PubMed
- Oliner JD, Kinzler KW, Meltzer PS, George DL, Vogelstein B. Amplification of a gene encoding a p53-associated protein in human sarcomas. Nature. 1992;358:80–3. - PubMed
- Ohh M, Park CW, Ivan M, Hoffman MA, Kim TY, Huang LE, et al. Ubiquitination of hypoxia-inducible factor requires direct binding to the beta-domain of the von Hippel-Lindau protein. Nat Cell Biol. 2000;2:423–7. - PubMed
- Gonda TJ, Ramsay RG. Nat Rev Cancer. Vol. 15. Nature Research; 2015. Directly targeting transcriptional dysregulation in cancer; pp. 686–94. - PubMed
Publication types
MeSH terms
Substances
LinkOut - more resources
Full Text Sources
Other Literature Sources
Miscellaneous


