Guidelines on experimental methods to assess mitochondrial dysfunction in cellular models of neurodegenerative diseases - PubMed (original) (raw)
Review
. 2018 Mar;25(3):542-572.
doi: 10.1038/s41418-017-0020-4. Epub 2017 Dec 11.
Pierre Theurey 2, Vera Adam-Vizi 3, Nicolas G Bazan 4, Paolo Bernardi 2 5, Juan P Bolaños 6, Carsten Culmsee 7, Valina L Dawson 8 9 10 11 12, Mohanish Deshmukh 13, Michael R Duchen 14, Heiko Düssmann 1, Gary Fiskum 15 16, Maria F Galindo 17, Giles E Hardingham 18, J Marie Hardwick 19, Mika B Jekabsons 20, Elizabeth A Jonas 21, Joaquin Jordán 22, Stuart A Lipton 23 24 25, Giovanni Manfredi 26, Mark P Mattson 27, BethAnn McLaughlin 28, Axel Methner 29, Anne N Murphy 30, Michael P Murphy 31, David G Nicholls 32, Brian M Polster 15 16, Tullio Pozzan 2 5, Rosario Rizzuto 2 5, Jorgina Satrústegui 33, Ruth S Slack 34, Raymond A Swanson 35, Russell H Swerdlow 36, Yvonne Will 37, Zheng Ying 38, Alvin Joselin 34, Anna Gioran 39, Catarina Moreira Pinho 40, Orla Watters 1, Manuela Salvucci 1, Irene Llorente-Folch 1, David S Park 34, Daniele Bano 39, Maria Ankarcrona 40, Paola Pizzo 2 5, Jochen H M Prehn 41
Affiliations
- PMID: 29229998
- PMCID: PMC5864235
- DOI: 10.1038/s41418-017-0020-4
Review
Guidelines on experimental methods to assess mitochondrial dysfunction in cellular models of neurodegenerative diseases
Niamh M C Connolly et al. Cell Death Differ. 2018 Mar.
Abstract
Neurodegenerative diseases are a spectrum of chronic, debilitating disorders characterised by the progressive degeneration and death of neurons. Mitochondrial dysfunction has been implicated in most neurodegenerative diseases, but in many instances it is unclear whether such dysfunction is a cause or an effect of the underlying pathology, and whether it represents a viable therapeutic target. It is therefore imperative to utilise and optimise cellular models and experimental techniques appropriate to determine the contribution of mitochondrial dysfunction to neurodegenerative disease phenotypes. In this consensus article, we collate details on and discuss pitfalls of existing experimental approaches to assess mitochondrial function in in vitro cellular models of neurodegenerative diseases, including specific protocols for the measurement of oxygen consumption rate in primary neuron cultures, and single-neuron, time-lapse fluorescence imaging of the mitochondrial membrane potential and mitochondrial NAD(P)H. As part of the Cellular Bioenergetics of Neurodegenerative Diseases (CeBioND) consortium ( www.cebiond.org ), we are performing cross-disease analyses to identify common and distinct molecular mechanisms involved in mitochondrial bioenergetic dysfunction in cellular models of Alzheimer's, Parkinson's, and Huntington's diseases. Here we provide detailed guidelines and protocols as standardised across the five collaborating laboratories of the CeBioND consortium, with additional contributions from other experts in the field.
Conflict of interest statement
The authors declare that they have no competing interests.
Figures
Fig. 1. Immunofluorescent labelling and fluorescent images of cortical neurons prepared from post-natal wild-type mice
a After 10 days in vitro (DIV), cultures were stained with antibodies against the neuron-specific NF200 (red) and the astrocyte-specific GFAP (green), and with the DNA dye Hoechst (blue). Even when moved to a serum-free media quickly after dissociation, neuronal cultures contain a small proportion of astrocytes and other cell types (such as fibroblasts and endothelial cells). Neurons can be morphologically identified when performing single-cell experiments [153], but regular and careful characterisation of cultures is important for cell population assays. b Cortical neurons (after 6 DIV) transfected with a mitochondrial red fluorescent protein highlight the intricate mitochondrial network throughout the neuron
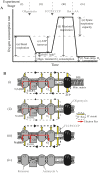
Fig. 2. Schematic of standard experimental protocol to investigate the contribution of components of the mitochondrial respiratory chain to the oxygen (O2) consumption rate (OCR).
a Mitochondrial function can be thoroughly investigated in intact cells by measuring the OCR during sequential addition of mitochondrial respiratory inhibitors (marked with grey triangles). The different stages of the experiment (i)–(iv) and the measured parameters (a)–(f) are described in Protocol 1. The addition of pharmacological compounds or fuel substrates prior to oligomycin (not shown here) can capture further detail regarding the OCR. b Illustration of the effects of relevant pharmacological compounds on the mitochondrial respiratory chain, proton (H+) leak across the mitochondrial inner membrane, and the F1Fo ATP synthase, during the experimental stages marked as (i)–(iv) in A. O2 in the mitochondria is consumed by the respiratory chain through the activity of Complex IV. (i) In the basal state, mitochondrial O2 consumption is predominantly driven by H+ flux through the F1Fo ATP synthase. (ii) Inhibition of the F1Fo ATP synthase with oligomycin reduces mitochondrial O2 consumption, with the OCR in this phase predominantly driven by the H+ leak (but also by substrate oxidation). (iii) Addition of an uncoupler such as FCCP or CCCP increases the H+ leak across the inner membrane, creating a H+ short circuit and facilitating the measurement of maximal OCR. The optimal FCCP/CCCP concentration to induce maximal respiration should be determined for each experimental setting (details in Protocol 1), and it is advisable to also assess maximal respiratory capacity in the absence of oligomycin. (iv) Inhibition of respiratory chain activity with Rotenone and/or Antimycin A ablates mitochondrial O2 consumption. Any O2 consumption measured in this phase is due to non-mitochondrial O2 consumption. Rot rotenone, AA antimycin A, Oligo oligomycin, H+ proton, IMS intermembrane space. *Respiration in stage (b) is predominantly driven by H+ leak, but also by substrate oxidation
Fig. 3. Representative images and time-series data from TMRM (10 nM) measurements in wild-type mouse cortical neurons exposed to mitochondrial inhibitors
. a Brightfield and TMRM fluorescence images were captured on a Zeiss Axiovert 100 microscope (brightfield and TMRM fluorescence are merged in the left-most image, TMRM only in the other images). b Time-series TMRM fluorescence measurements within the region of interest marked by the white polygon in (A)(ii). The precise time-points of the images in (A) are marked (i)–(iii) on the graph. Baseline fluorescence was recorded for 10 min pre-treatment and used to normalise the signal. Complex III inhibition with antimycin A (1 μM) induced a decrease in TMRM fluorescence, indicating mitochondrial membrane depolarisation. Subsequent oligomycin addition (2 μg/ml) further reduced TMRM fluorescence, indicating that prior to oligomycin addition the mitochondrial membrane potential was being maintained by the F1Fo ATP synthase operating in reverse. The loss of any remaining TMRM fluorescence after FCCP addition (10 μM) indicates mitochondrial membrane potential collapse
Fig. 4. Representative images and time-series data from NAD(P)H autofluorescence measurements in wild-type mouse cortical neurons exposed to mitochondrial inhibitors
a Brightfield and NAD(P)H autofluorescence images were captured on a Zeiss Axiovert 100 microscope. b Time-series autofluorescence measurements from the region of interest marked within a white polygon in (A)(iii). The precise time-points of the images in (A) are marked (i)-(iv) on the graph. Baseline fluorescence was recorded for 5 min pre-treatment and used to normalise the signal. Inhibition of the F1Fo ATP synthase with oligomycin (2 μg/ml) reduced NADH consumption by the respiratory chain, leading to an increase in the autofluorescence signal. Subsequent mitochondrial uncoupling with FCCP (0.5 μM) increased respiratory NADH oxidation, decreasing autofluorescence
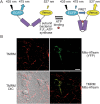
Fig. 5. mitoATeam, a FRET-based reporter of mitochondrial ATP, can be transfected into primary neurons
[99] a The reporter comprises a linker protein (ε-subunit of a bacterial F1Fo ATP synthase) inserted between a donor CFP and acceptor YFP (enhanced CFP and Venus). ATP binding induces a conformational change in the linker protein, increasing FRET between the two FPs and altering the emitted fluorescence. Ratiometric measurements are obtained by calculating the FRET ratio (CFP/YFP). The acceptor YFP can also be laser-excited at ~488 nm. Fluorescent emissions from both FPs should be monitored, to ensure that any ratio change is due to altered FRET (opposite changes in the fluorescence of the individual FPs), rather than other sources (such as increased auto-fluorescence). Image reproduced with permission from [12]. b Representative images of primary mouse cortical neurons (DIV8) transfected with mitoATeam, stained with TMRM, and imaged on a Zeiss LSM 710 confocal microscope. Mitochondrial localisation of the mitoATeam probe was verified by colocalisation with the TMRM signal (merged TMRM and Mito-ATeam image). Scale bar = 10 μm. DIC differential interference contrast
Similar articles
- MicroRNAs Dysregulation and Mitochondrial Dysfunction in Neurodegenerative Diseases.
Catanesi M, d'Angelo M, Tupone MG, Benedetti E, Giordano A, Castelli V, Cimini A. Catanesi M, et al. Int J Mol Sci. 2020 Aug 20;21(17):5986. doi: 10.3390/ijms21175986. Int J Mol Sci. 2020. PMID: 32825273 Free PMC article. Review. - Mitochondrial dysfunction in neurodegenerative diseases and drug targets via apoptotic signaling.
Wu Y, Chen M, Jiang J. Wu Y, et al. Mitochondrion. 2019 Nov;49:35-45. doi: 10.1016/j.mito.2019.07.003. Epub 2019 Jul 6. Mitochondrion. 2019. PMID: 31288090 Review. - Mitochondrial dynamics, a key executioner in neurodegenerative diseases.
Panchal K, Tiwari AK. Panchal K, et al. Mitochondrion. 2019 Jul;47:151-173. doi: 10.1016/j.mito.2018.11.002. Epub 2018 Nov 5. Mitochondrion. 2019. PMID: 30408594 Review. - Reappraisal of metabolic dysfunction in neurodegeneration: Focus on mitochondrial function and calcium signaling.
Jadiya P, Garbincius JF, Elrod JW. Jadiya P, et al. Acta Neuropathol Commun. 2021 Jul 7;9(1):124. doi: 10.1186/s40478-021-01224-4. Acta Neuropathol Commun. 2021. PMID: 34233766 Free PMC article. Review. - Reactive oxygen species: stuck in the middle of neurodegeneration.
Patten DA, Germain M, Kelly MA, Slack RS. Patten DA, et al. J Alzheimers Dis. 2010;20 Suppl 2:S357-67. doi: 10.3233/JAD-2010-100498. J Alzheimers Dis. 2010. PMID: 20421690 Review.
Cited by
- Local glycolysis supports injury-induced axonal regeneration.
Masin L, Bergmans S, Van Dyck A, Farrow K, De Groef L, Moons L. Masin L, et al. J Cell Biol. 2024 Dec 2;223(12):e202402133. doi: 10.1083/jcb.202402133. Epub 2024 Oct 1. J Cell Biol. 2024. PMID: 39352499 Free PMC article. - Mitochondrial Aconitase and Its Contribution to the Pathogenesis of Neurodegenerative Diseases.
Padalko V, Posnik F, Adamczyk M. Padalko V, et al. Int J Mol Sci. 2024 Sep 15;25(18):9950. doi: 10.3390/ijms25189950. Int J Mol Sci. 2024. PMID: 39337438 Free PMC article. Review. - LDL Exposure Disrupts Mitochondrial Function and Dynamics in a Hippocampal Neuronal Cell Line.
Farias HR, Ramos JMO, Griesang CT, Santos L, Junior OVR, Souza DG, Ferreira FS, Somacal S, Martins LAM, de Souza DOG, Moreira JCF, Wyse ATS, Guma FTCR, de Oliveira J. Farias HR, et al. Mol Neurobiol. 2024 Sep 20. doi: 10.1007/s12035-024-04476-y. Online ahead of print. Mol Neurobiol. 2024. PMID: 39302616 - Guidelines for mitochondrial RNA analysis.
Jusic A, Erpapazoglou Z, Dalgaard LT, Lakkisto P, de Gonzalo-Calvo D, Benczik B, Ágg B, Ferdinandy P, Fiedorowicz K, Schroen B, Lazou A, Devaux Y; EU-CardioRNA COST Action CA17129; AtheroNET COST Action CA21153. Jusic A, et al. Mol Ther Nucleic Acids. 2024 Jun 26;35(3):102262. doi: 10.1016/j.omtn.2024.102262. eCollection 2024 Sep 10. Mol Ther Nucleic Acids. 2024. PMID: 39091381 Free PMC article. Review. - Fluorescent Nanocable as a Biomedical Tool: Intracellular Self-Assembly Formed by a Natural Product Interconnects and Synchronizes Mitochondria.
Zhao X, Wang F, Kam C, Wu MY, Zhang J, Xu C, Bao K, He Q, Ye R, Tang BZ, Chen S. Zhao X, et al. ACS Nano. 2024 Aug 13;18(32):21447-21458. doi: 10.1021/acsnano.4c06186. Epub 2024 Jul 30. ACS Nano. 2024. PMID: 39080909 Free PMC article.
References
- Lin MT, Beal MF. Mitochondrial dysfunction and oxidative stress in neurodegenerative diseases. Nature. 2006;443:787–95. - PubMed
Publication types
MeSH terms
Grants and funding
- I01 BX003249/BX/BLRD VA/United States
- P30 AG035982/AG/NIA NIH HHS/United States
- R01 AG056259/AG/NIA NIH HHS/United States
- RF1 AG057409/AG/NIA NIH HHS/United States
- R01 NS086890/NS/NINDS NIH HHS/United States
- CIHR/Canada
- DP1 DA041722/DA/NIDA NIH HHS/United States
- G0902044/MRC_/Medical Research Council/United Kingdom
- R01 NS081149/NS/NINDS NIH HHS/United States
- BB/L020874/1/BB_/Biotechnology and Biological Sciences Research Council/United Kingdom
- MC_UU_00015/3/MRC_/Medical Research Council/United Kingdom
LinkOut - more resources
Full Text Sources
Other Literature Sources
Medical
Research Materials


